Chapter 10 Main effects with reduced sample
Main effects with sample that excludes respondents who fail manipulation check
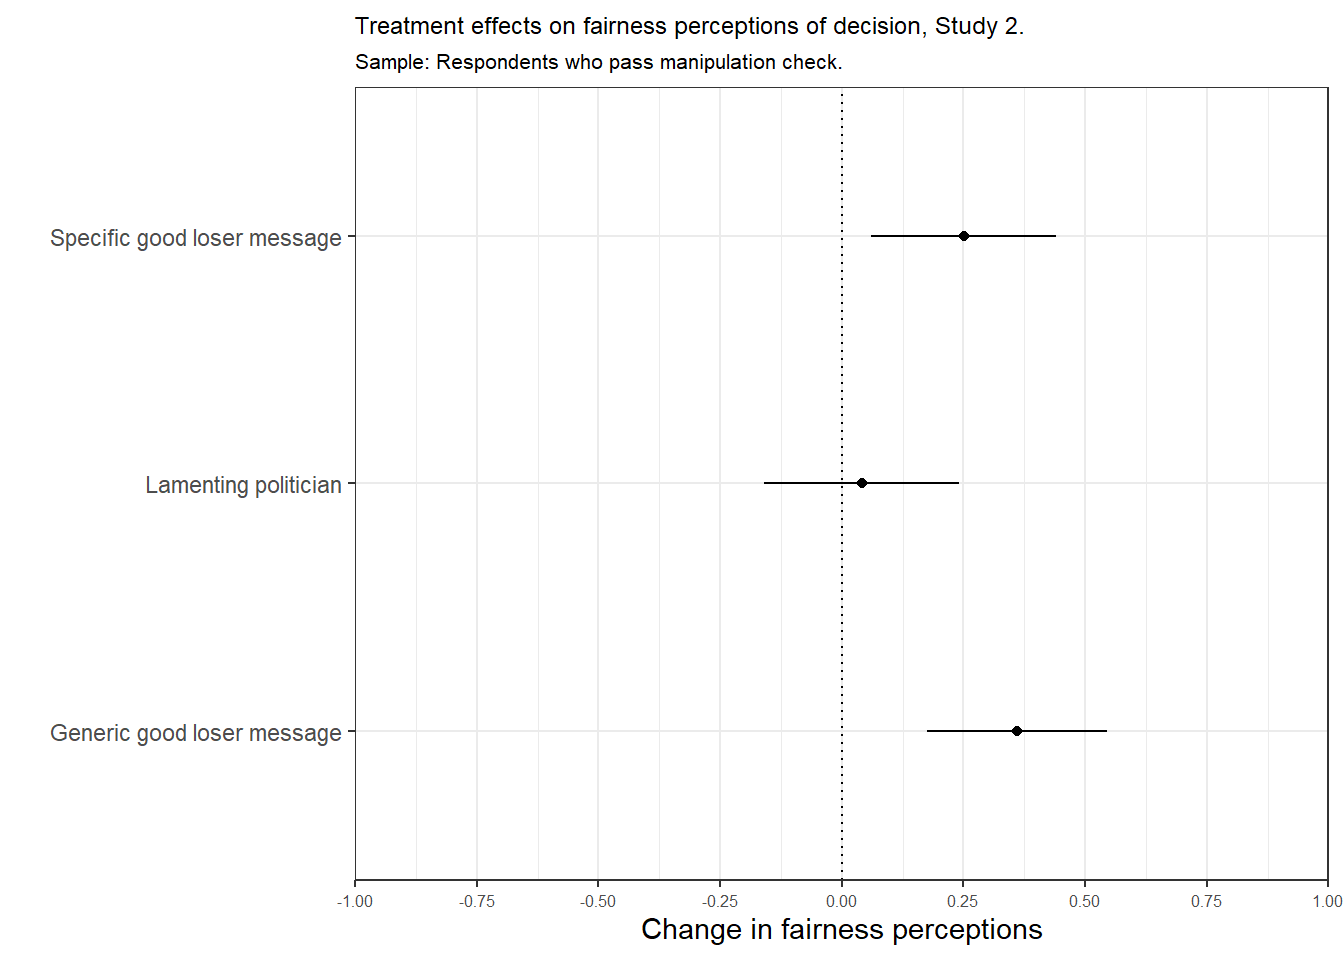
10.1 Fairness
| Treatment value | Estimate | Std. Error | t-statistic | p value |
|---|---|---|---|---|
| Not shown (Intercept) | 3.76 | 0.07 | 56.49 | 0.00 |
| Lamenting politician | 0.04 | 0.10 | 0.43 | 0.67 |
| NA | 0.36 | 0.09 | 4.09 | 0.00 |
| Specific good loser prime | 0.25 | 0.09 | 2.78 | 0.01 |
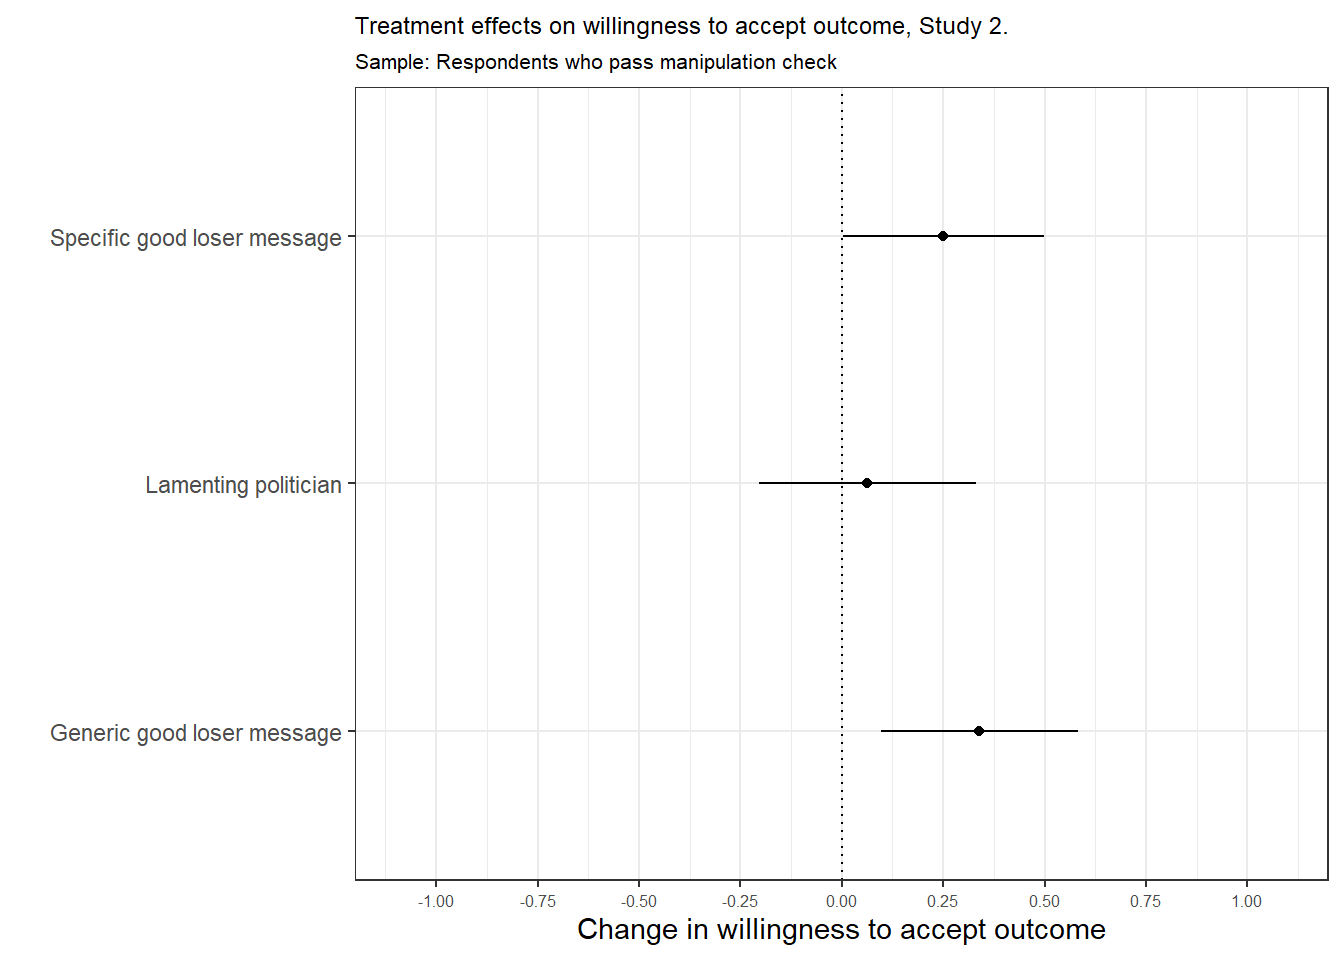
10.2 Willingnes to accept
| Treatment value | Estimate | Std. Error | t-statistic | p value |
|---|---|---|---|---|
| Not shown (Intercept) | 3.45 | 0.08 | 41.16 | 0.00 |
| Lamenting politician | 0.06 | 0.12 | 0.51 | 0.61 |
| Generic good loser prime | 0.34 | 0.11 | 3.03 | 0.00 |
| Specific good loser prime | 0.25 | 0.11 | 2.20 | 0.03 |
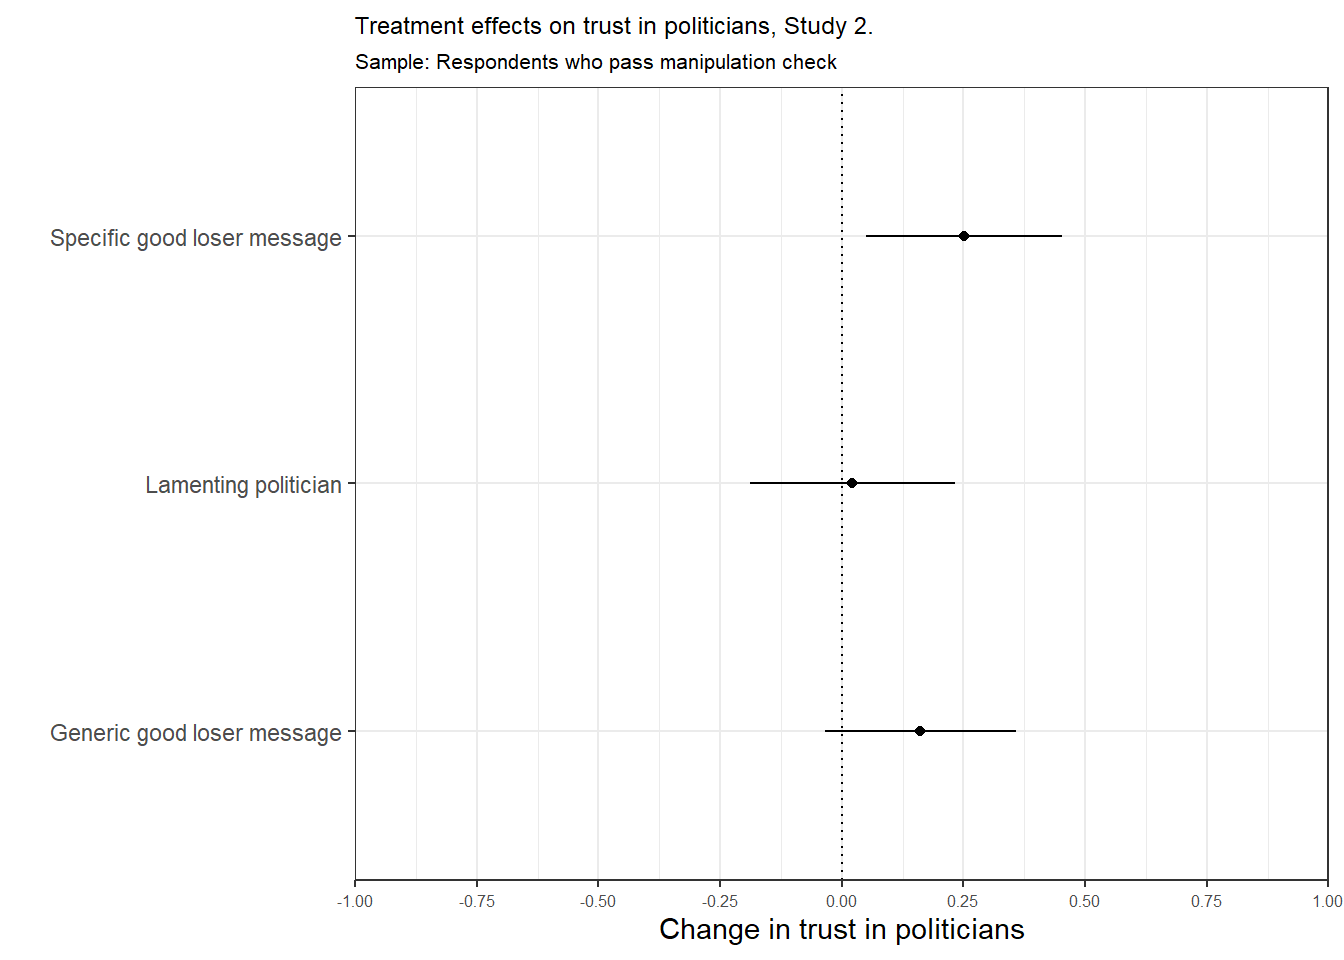
10.3 Trust in politician
| Treatment value | Estimate | Std. Error | t-statistic | p value |
|---|---|---|---|---|
| Not shown (Intercept) | 3.17 | 0.07 | 44.36 | 0.00 |
| Lamenting politician | 0.02 | 0.10 | 0.22 | 0.83 |
| Generic good loser prime | 0.16 | 0.09 | 1.71 | 0.09 |
| Specific good loser prime | 0.25 | 0.10 | 2.59 | 0.01 |