S.I. 3 Effects on losers
Treatment effects on experimental subjects who find the decision outcome to align unfavorably with their own preferences.
3.1 Fairness
In the manuscript, we mention that the Generic good loser message for the respondents with an unfavorable outcome is on par with the outcome favorability effect (difference in fairness perceptions between winners and losers). The table below displays the outcome favorability effect, and table ‘tab:1055_post_fairness’ further below displays the treatment effect of the Generic good loser message.
| Treatment value | Estimate | Std. Error | t-statistic | p value |
|---|---|---|---|---|
| Intercept | 4.79 | 0.08 | 62.18 | 0 |
| Unfavorable outcome | -0.93 | 0.11 | -8.28 | 0 |
3.1.1 Fairness I
Figure 2 in the manuscript:
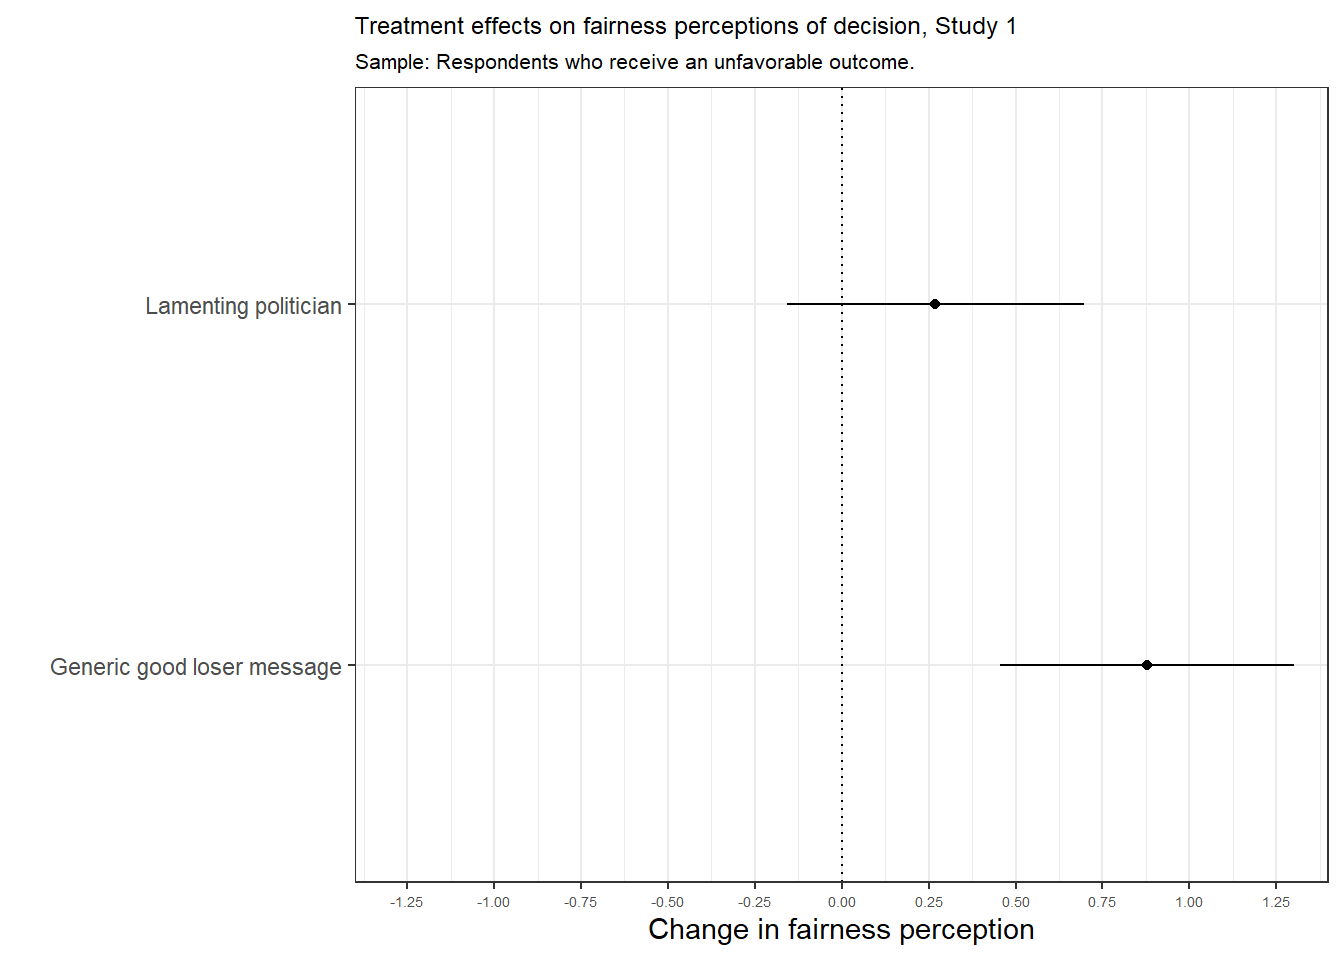
| Treatment value | Estimate | Std. Error | t-statistic | p value |
|---|---|---|---|---|
| Not shown | 3.46 | 0.16 | 22.32 | 0.00 |
| Lamenting politician | 0.27 | 0.21 | 1.26 | 0.21 |
| Generic good loser message | 0.88 | 0.21 | 4.15 | 0.00 |
The sample size of the fitted model is 481.
3.1.2 Fairness II
Lamenting politician as reference category
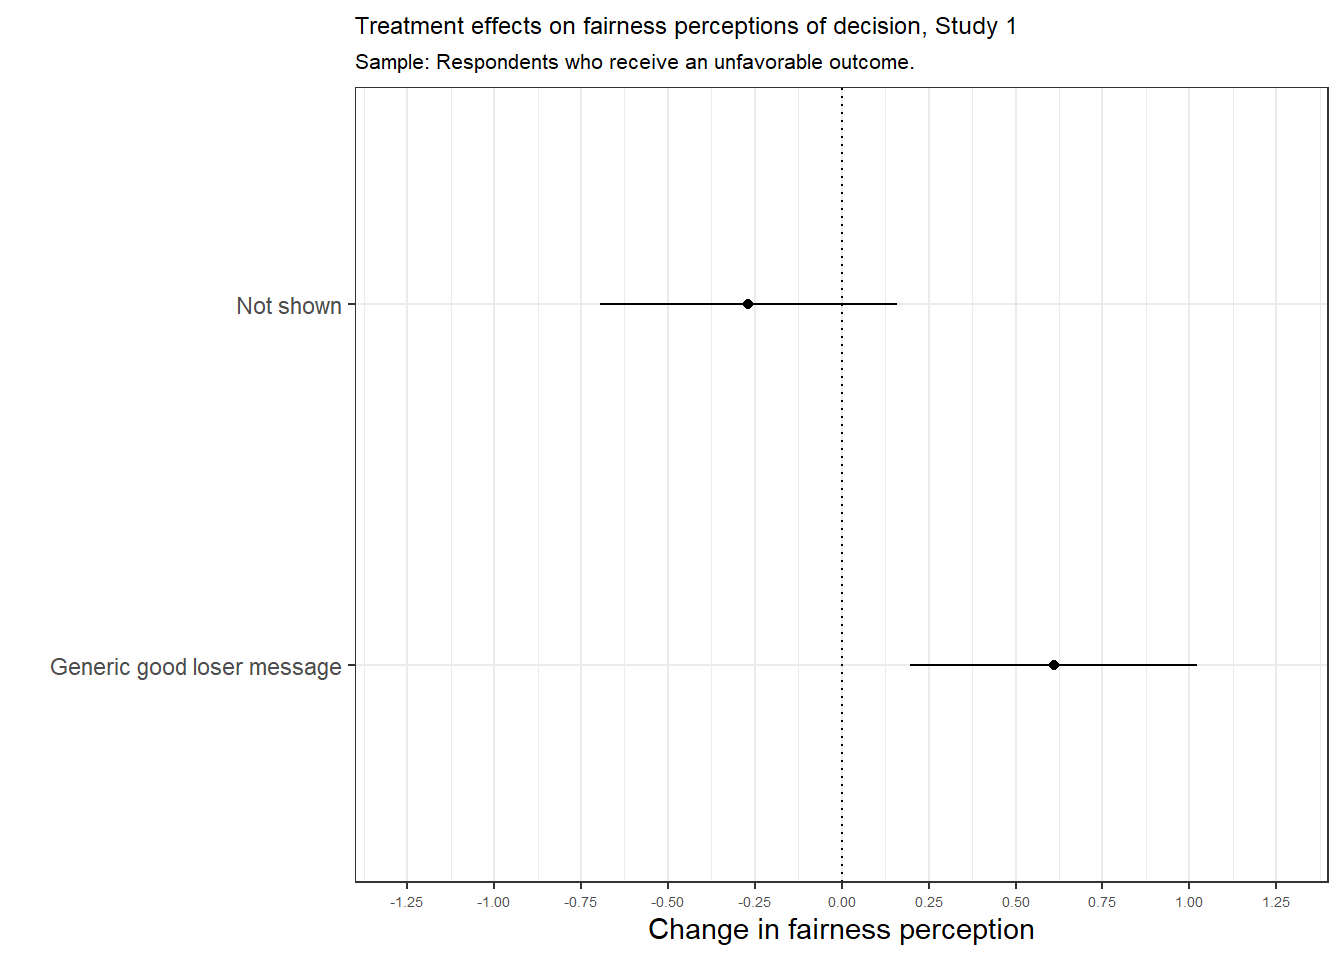
| Treatment value | Estimate | Std. Error | t-statistic | p value |
|---|---|---|---|---|
| Intercept | 3.73 | 0.15 | 25.41 | 0.00 |
| Not shown | -0.27 | 0.21 | -1.26 | 0.21 |
| Generic good loser message | 0.61 | 0.21 | 2.96 | 0.00 |
| Note: | ||||
| Lamenting politician set as reference category. |
3.2 Justice
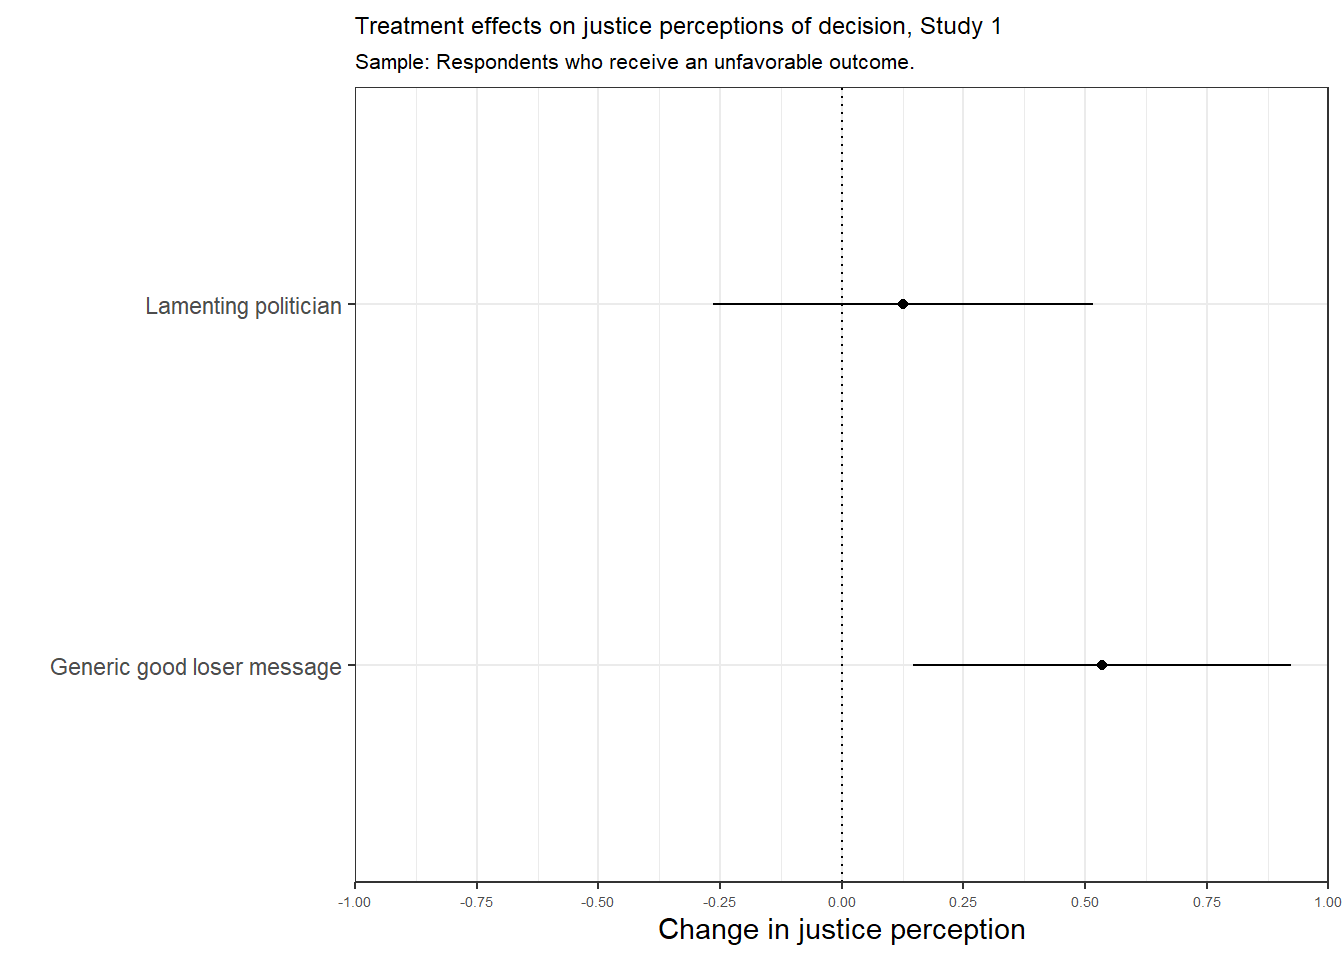
| Treatment value | Estimate | Std. Error | t-statistic | p value |
|---|---|---|---|---|
| Not shown | 3.61 | 0.14 | 25.45 | 0.00 |
| Lamenting politician | 0.13 | 0.20 | 0.64 | 0.52 |
| Generic good loser message | 0.53 | 0.19 | 2.76 | 0.01 |
3.3 Decision evaluation
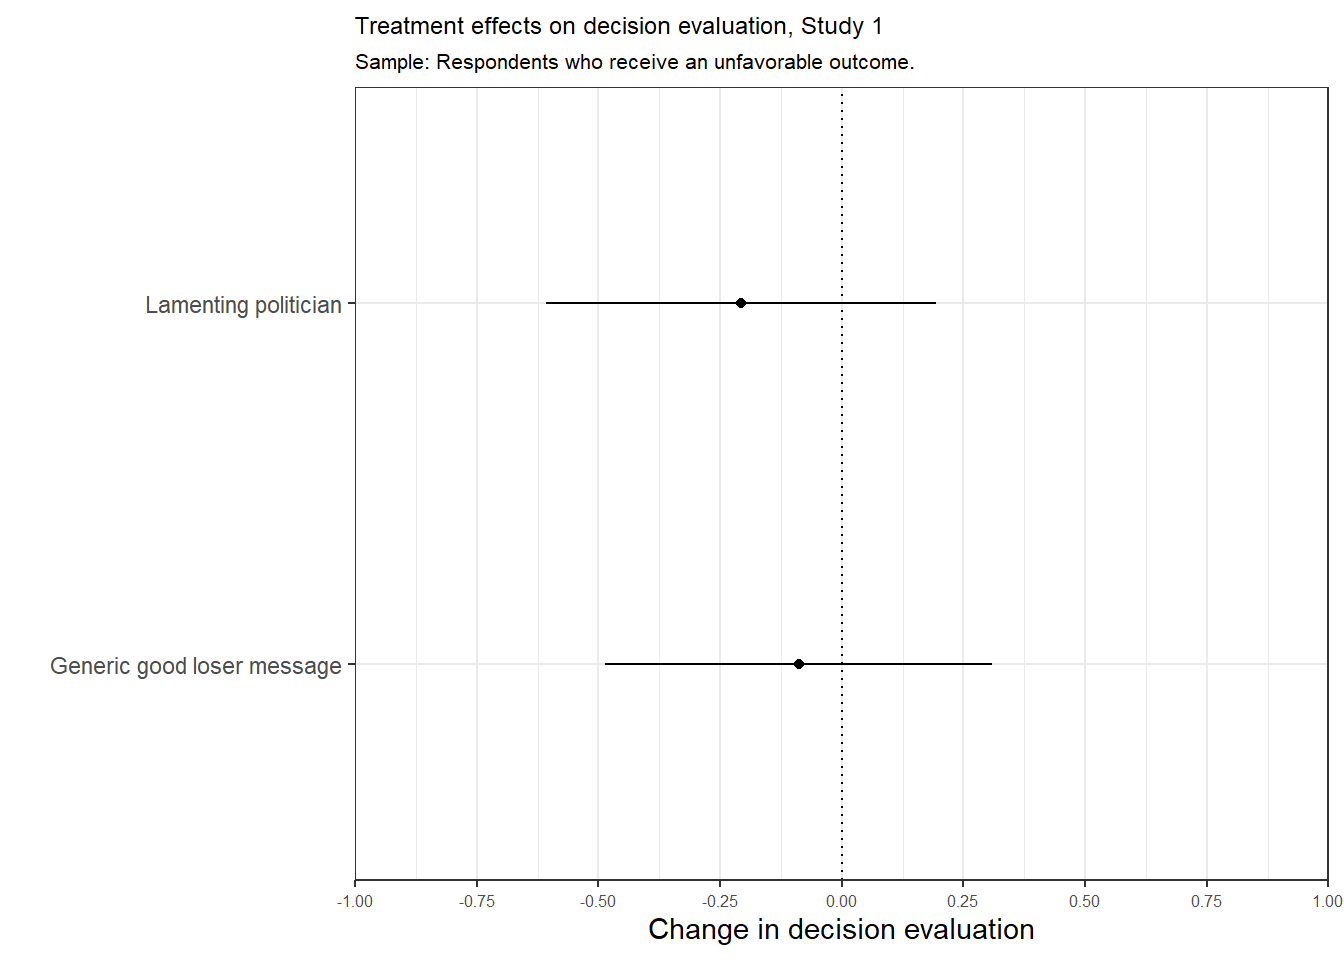
| Treatment value | Estimate | Std. Error | t-statistic | p value |
|---|---|---|---|---|
| Not shown | 3.00 | 0.15 | 20.60 | 0.00 |
| Lamenting politician | -0.21 | 0.20 | -1.03 | 0.30 |
| Generic good loser message | -0.09 | 0.20 | -0.44 | 0.66 |
3.4 Willingness to accept
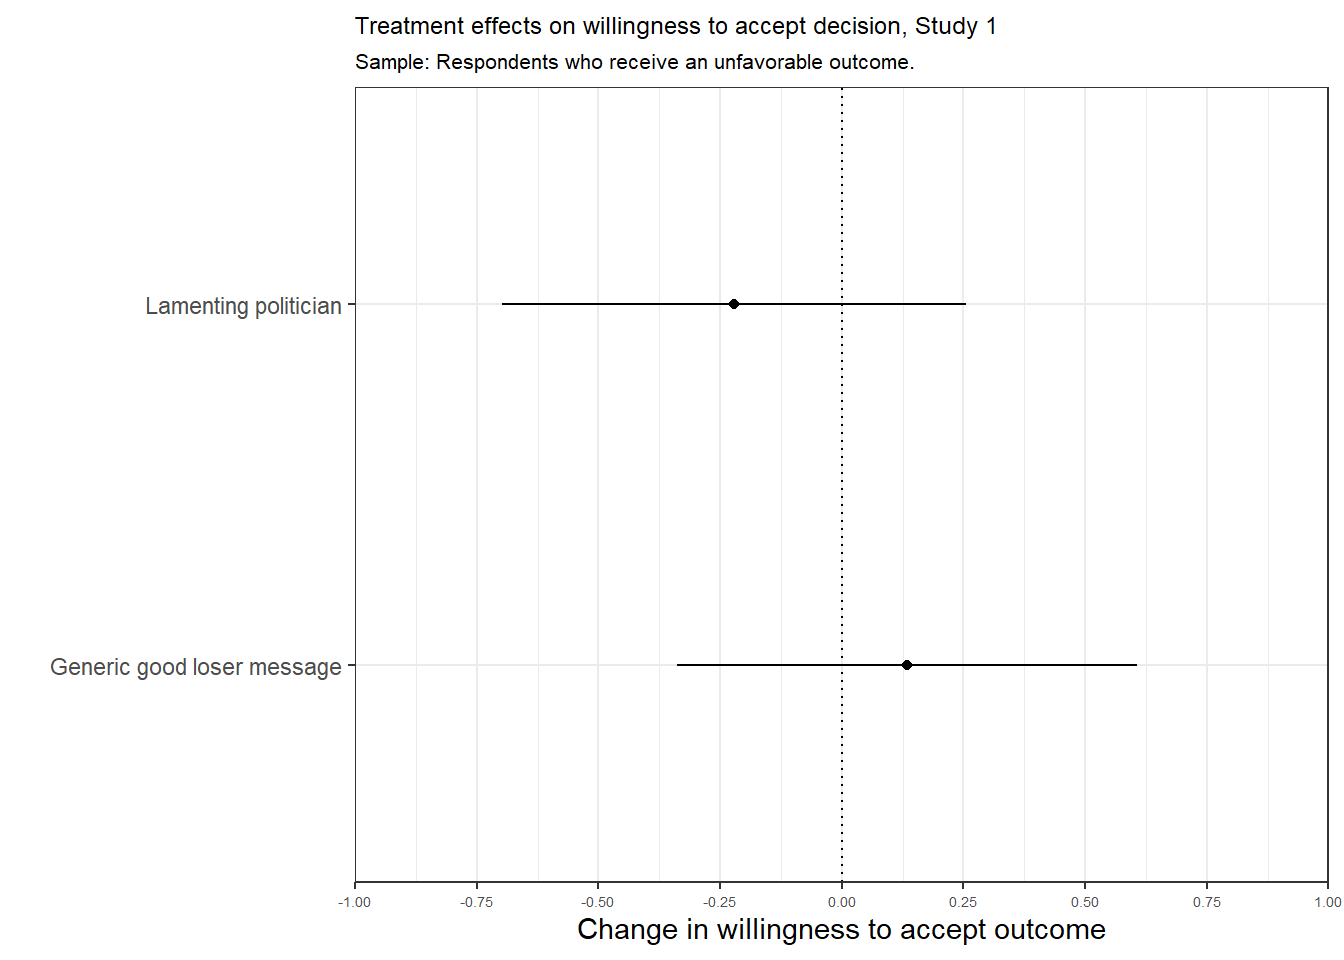
| Treatment value | Estimate | Std. Error | t-statistic | p value |
|---|---|---|---|---|
| Not shown | 4.31 | 0.17 | 24.95 | 0.00 |
| Lamenting politician | -0.22 | 0.24 | -0.93 | 0.35 |
| Generic good loser message | 0.13 | 0.24 | 0.57 | 0.57 |
3.5 Compliance
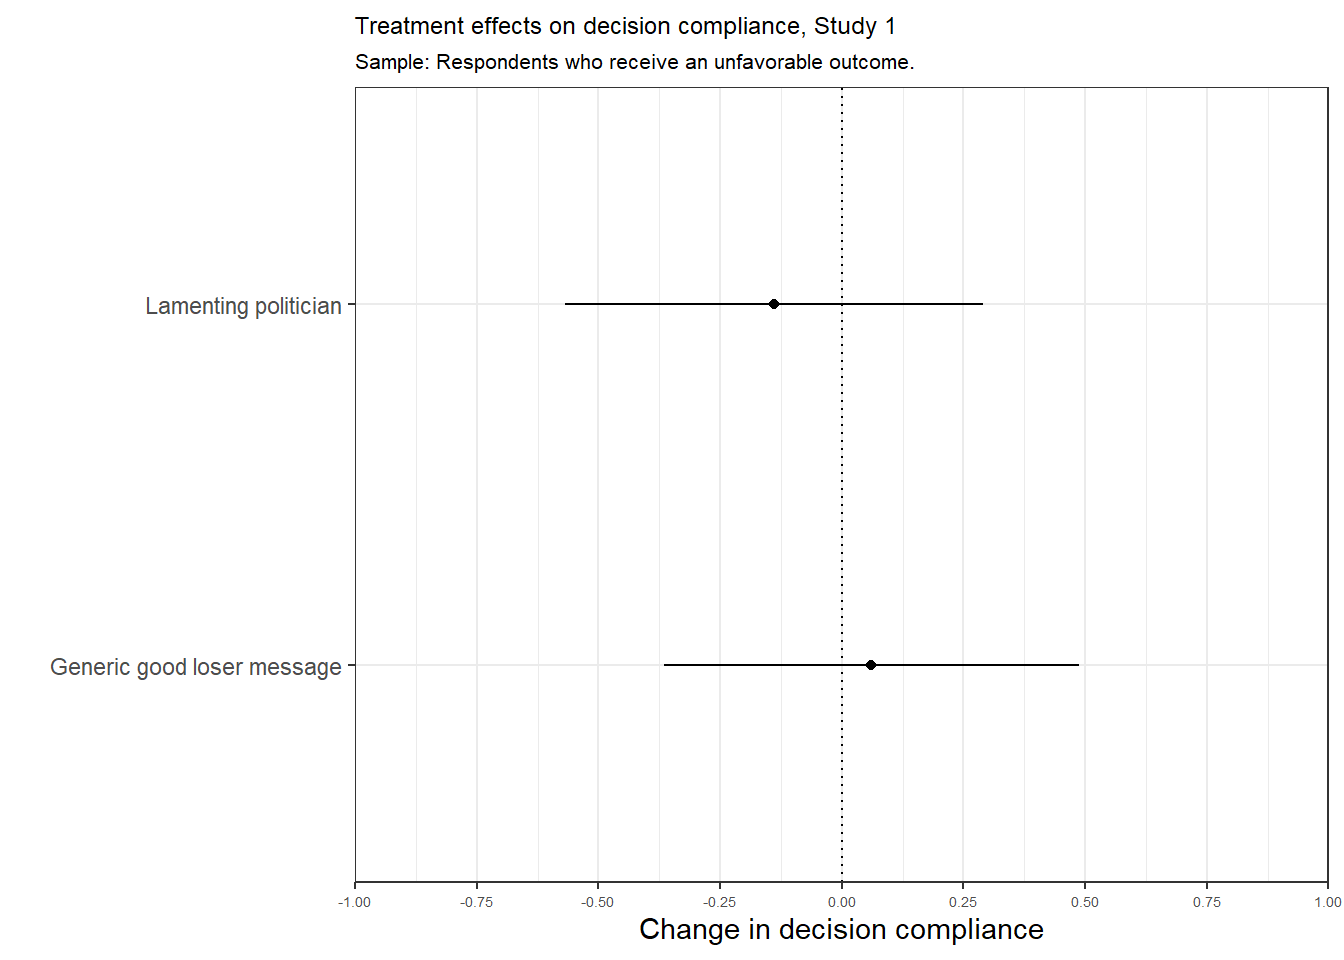
| Treatment value | Estimate | Std. Error | t-statistic | p value |
|---|---|---|---|---|
| Not shown | 4.46 | 0.16 | 28.58 | 0.00 |
| Lamenting politician | -0.14 | 0.22 | -0.65 | 0.52 |
| Generic good loser message | 0.06 | 0.21 | 0.29 | 0.78 |
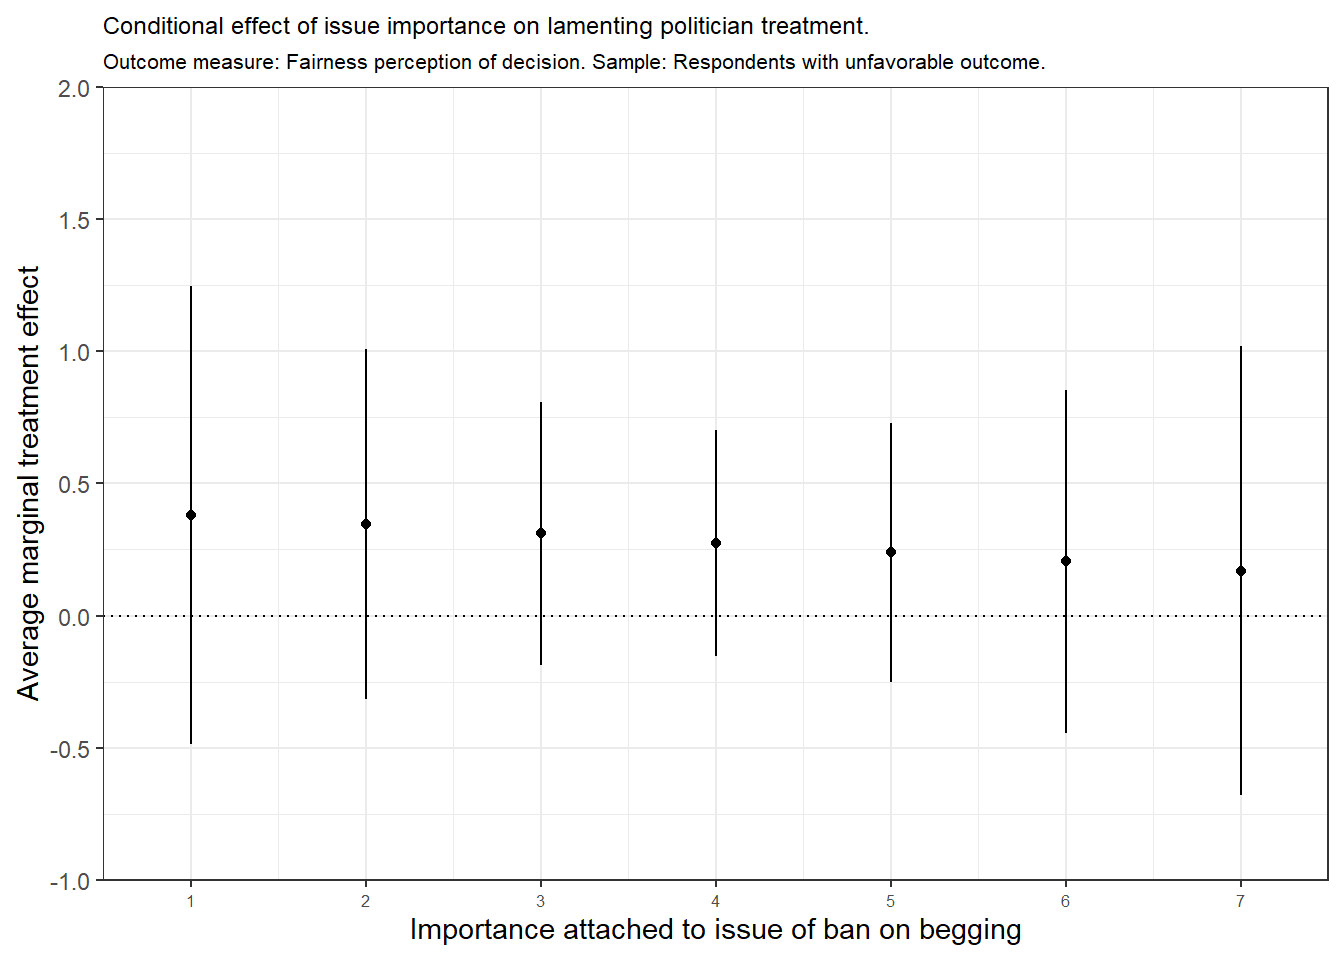
3.6 Moderating effects of issue importance on losers
Figure 5 in the manuscript:
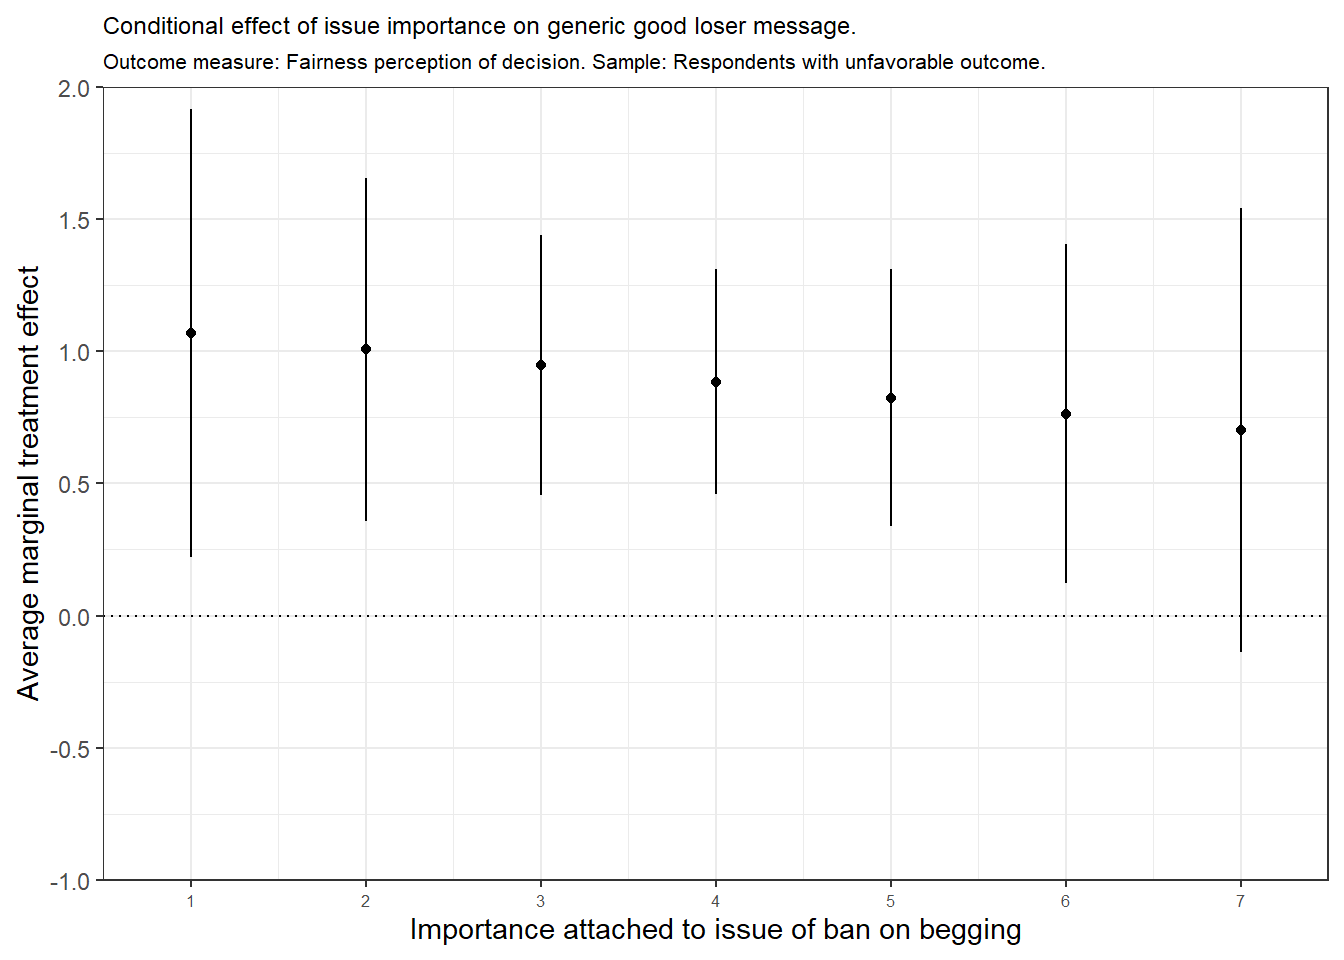
| Factor | Issue importance | AME | SE | z-statistic | p value | Lower | Upper |
|---|---|---|---|---|---|---|---|
| Generic good loser message | 1 | 1.07 | 0.42 | 2.52 | 0.01 | 0.24 | 1.90 |
| Generic good loser message | 2 | 1.01 | 0.32 | 3.10 | 0.00 | 0.37 | 1.64 |
| Generic good loser message | 3 | 0.95 | 0.25 | 3.85 | 0.00 | 0.46 | 1.43 |
| Generic good loser message | 4 | 0.89 | 0.21 | 4.17 | 0.00 | 0.47 | 1.30 |
| Generic good loser message | 5 | 0.82 | 0.24 | 3.39 | 0.00 | 0.35 | 1.30 |
| Generic good loser message | 6 | 0.76 | 0.32 | 2.38 | 0.02 | 0.13 | 1.39 |
| Generic good loser message | 7 | 0.70 | 0.42 | 1.67 | 0.09 | -0.12 | 1.52 |
| Lamenting politician | 1 | 0.38 | 0.43 | 0.88 | 0.38 | -0.47 | 1.23 |
| Lamenting politician | 2 | 0.35 | 0.33 | 1.05 | 0.30 | -0.30 | 0.99 |
| Lamenting politician | 3 | 0.31 | 0.25 | 1.24 | 0.21 | -0.18 | 0.80 |
| Lamenting politician | 4 | 0.28 | 0.21 | 1.29 | 0.20 | -0.14 | 0.69 |
| Lamenting politician | 5 | 0.24 | 0.25 | 0.98 | 0.33 | -0.24 | 0.72 |
| Lamenting politician | 6 | 0.20 | 0.32 | 0.63 | 0.53 | -0.43 | 0.84 |
| Lamenting politician | 7 | 0.17 | 0.42 | 0.40 | 0.69 | -0.66 | 1.00 |
| Note: | |||||||
| Sample: Respondents with unfavorable outcome. |
The sample size of the fitted model is 481.
| Treatment value | Estimate | Std. Error | t-statistic | p value |
|---|---|---|---|---|
| Intercept | 3.42 | 0.25 | 13.73 | 0.00 |
| Lamenting politician | 0.03 | 0.34 | 0.10 | 0.92 |
| Generic good loser message | 0.81 | 0.34 | 2.41 | 0.02 |
| Issue not important to respondent | 0.07 | 0.32 | 0.21 | 0.83 |
| Lamenting politician w/ issue not important to respondent | 0.40 | 0.44 | 0.91 | 0.37 |
| Generic good loser message w/ issue not important to respondent | 0.12 | 0.43 | 0.29 | 0.78 |
| Note: | ||||
| Sample: Respondents with unfavorable outcome. |