S.I. 6 Effects on losers
Main effects with ITT sample of respondents who receive an unfavorable outcome.
6.1 Fairness
Figure 3 in the manuscript:
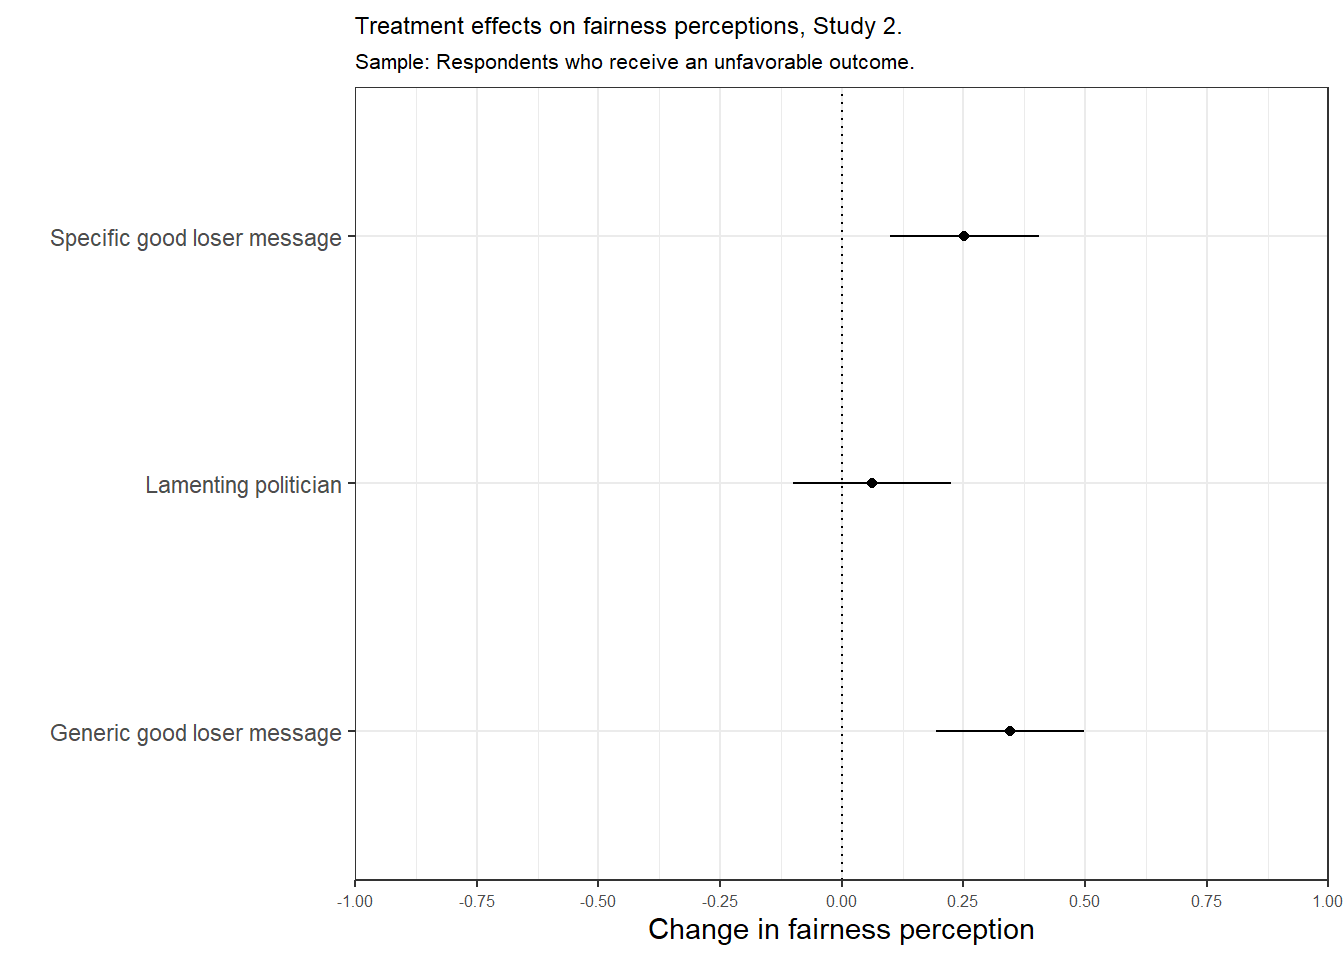
| Treatment value | Estimate | Std. Error | t-statistic | p value |
|---|---|---|---|---|
| Not shown (Intercept) | 3.74 | 0.06 | 66.58 | 0.00 |
| Lamenting politician | 0.06 | 0.08 | 0.77 | 0.44 |
| Generic good loser message | 0.35 | 0.08 | 4.54 | 0.00 |
| Specific good loser message | 0.25 | 0.08 | 3.28 | 0.00 |
6.1.1 Fairness II
Lamenting politician as reference category
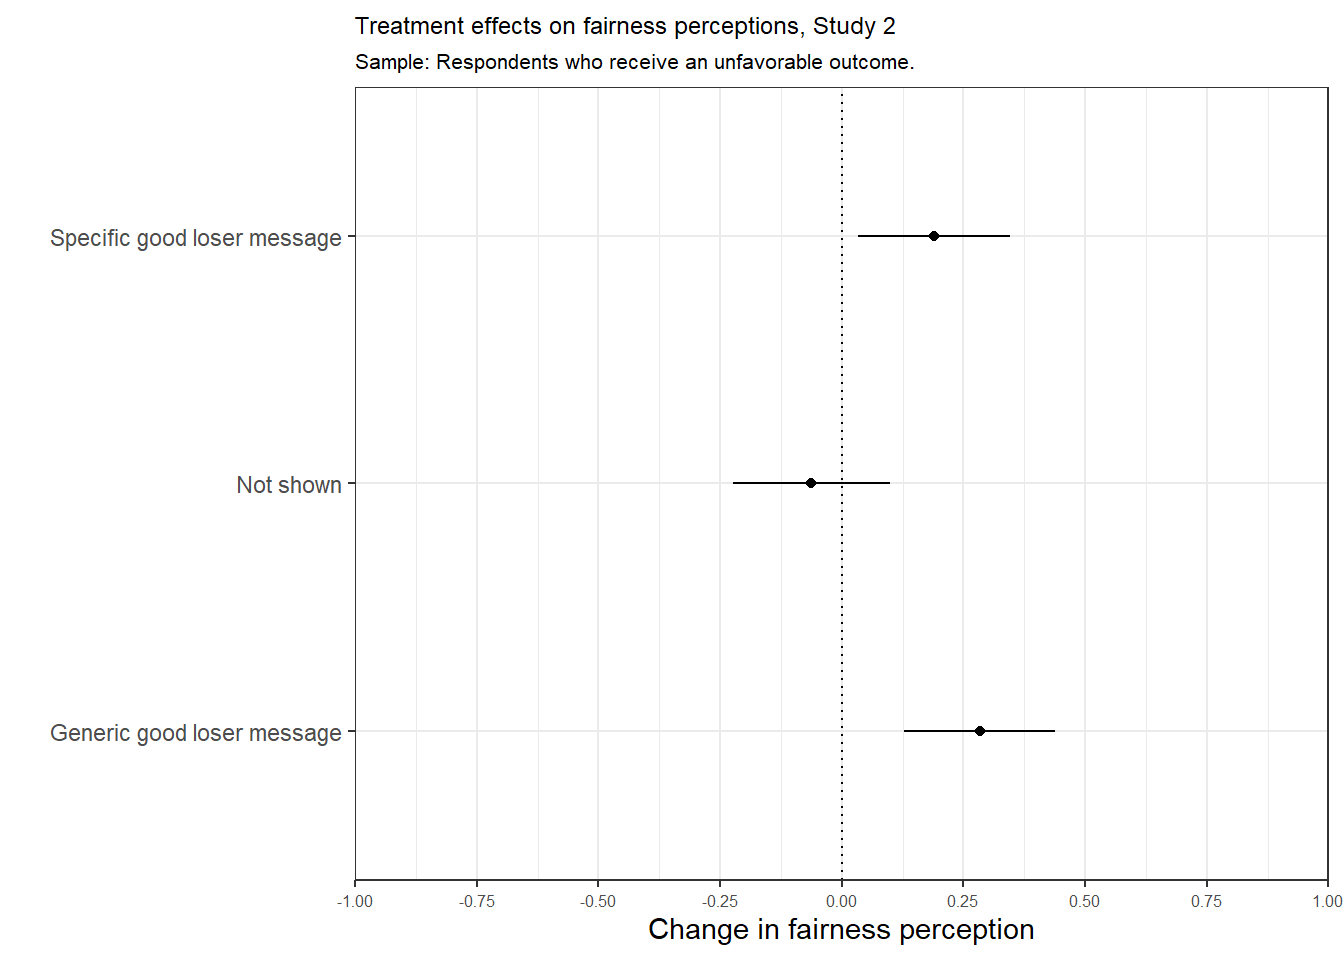
| Treatment value | Estimate | Std. Error | t-statistic | p value |
|---|---|---|---|---|
| Intercept | 3.81 | 0.06 | 65.48 | 0.00 |
| Generic good loser message | 0.28 | 0.08 | 3.65 | 0.00 |
| Not shown | -0.06 | 0.08 | -0.77 | 0.44 |
| Specific good loser message | 0.19 | 0.08 | 2.43 | 0.02 |
6.1.2 Fairness moderated by issue importance
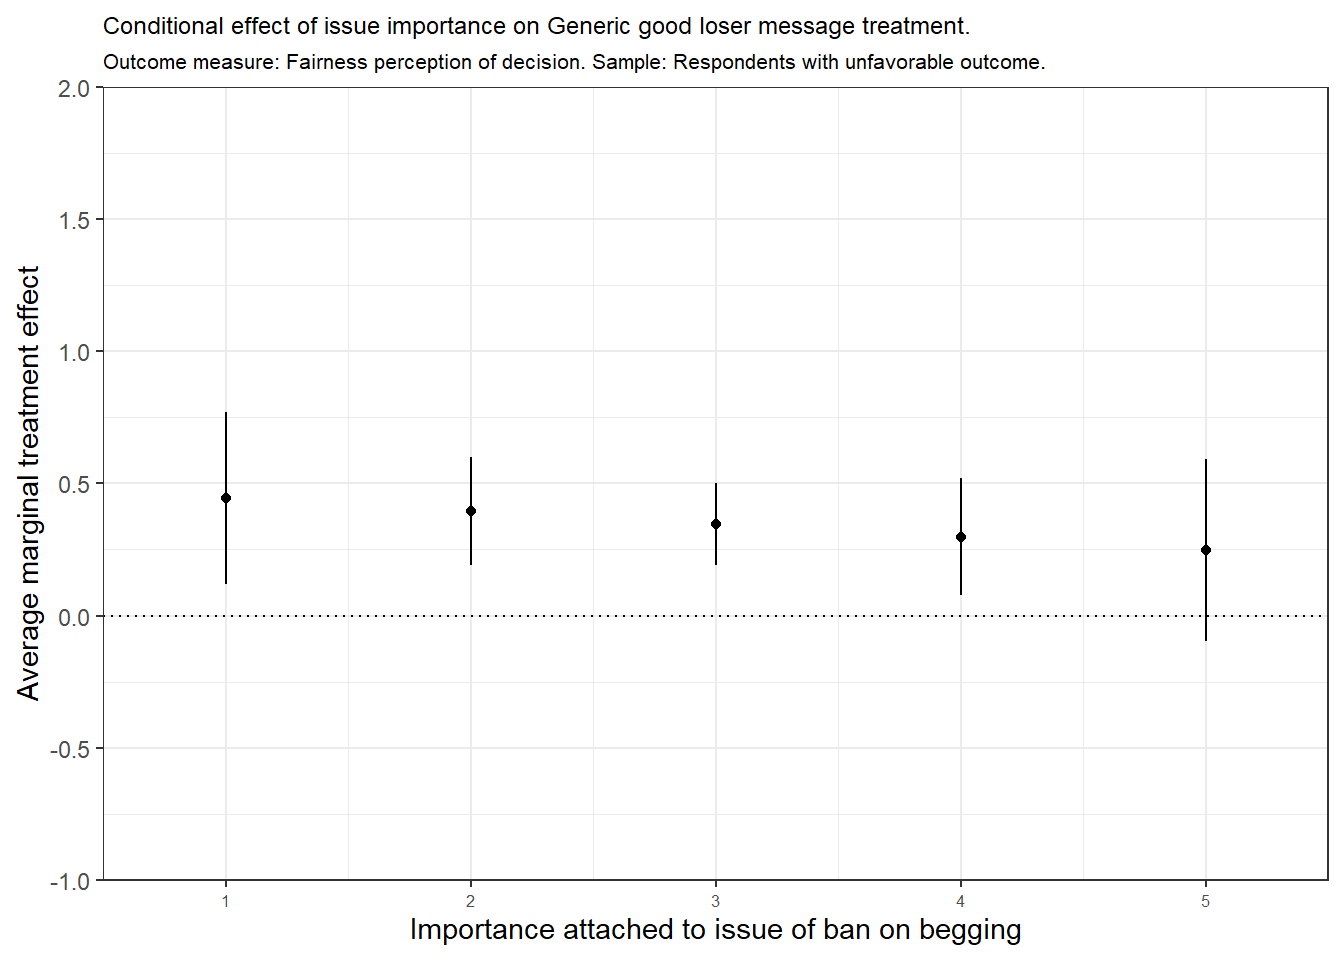
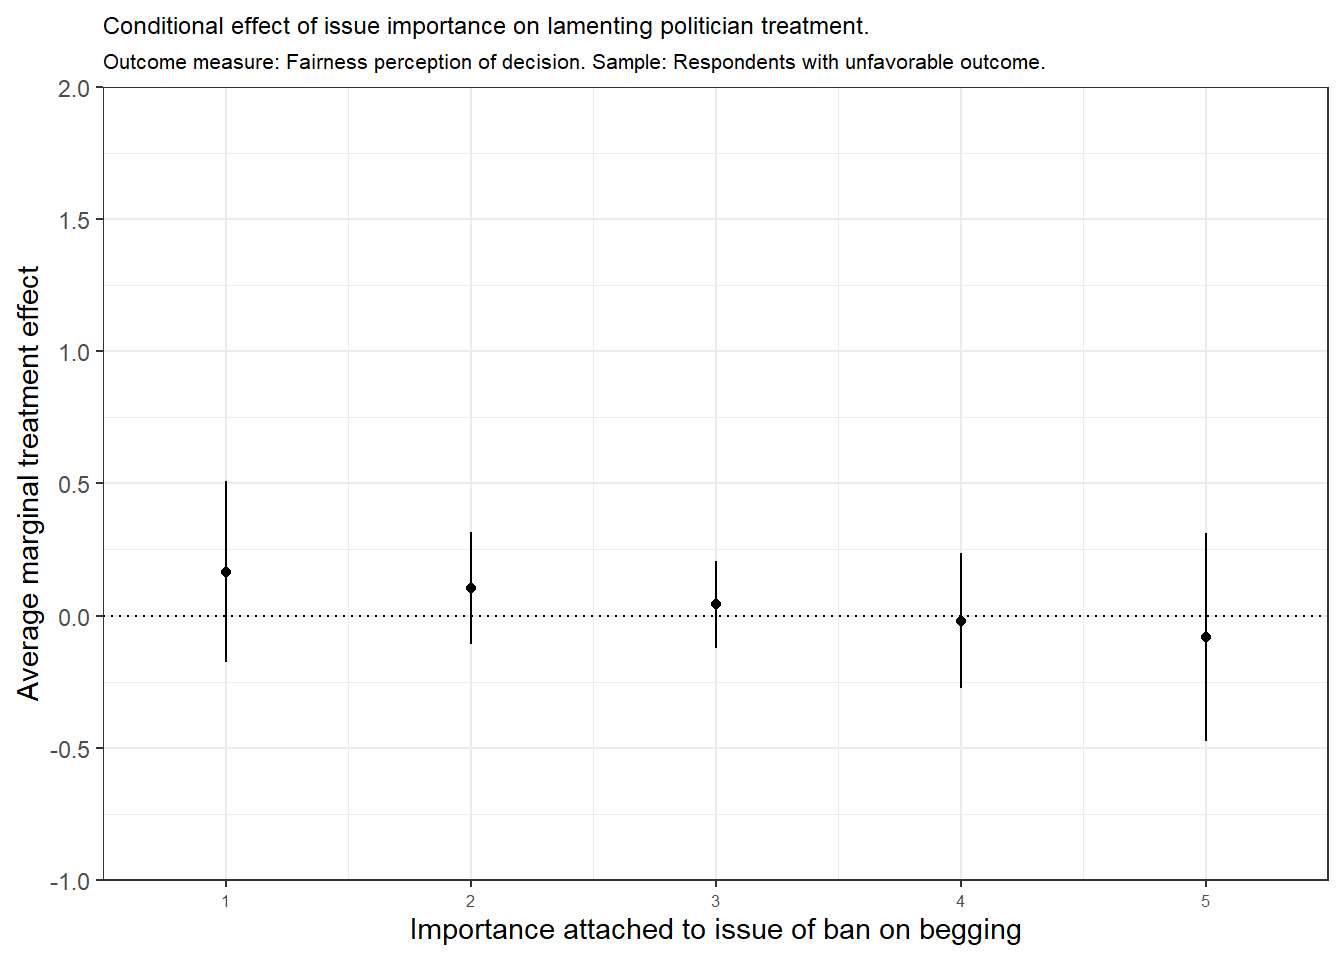
| Factor | Issue importance | AME | SE | z-statistic | p value | Lower | Upper |
|---|---|---|---|---|---|---|---|
| Generic good loser message | 1 | 0.44 | 0.16 | 2.74 | 0.01 | 0.13 | 0.76 |
| Generic good loser message | 2 | 0.40 | 0.10 | 3.85 | 0.00 | 0.19 | 0.60 |
| Generic good loser message | 3 | 0.35 | 0.08 | 4.51 | 0.00 | 0.20 | 0.50 |
| Generic good loser message | 4 | 0.30 | 0.11 | 2.69 | 0.01 | 0.08 | 0.52 |
| Generic good loser message | 5 | 0.25 | 0.17 | 1.44 | 0.15 | -0.09 | 0.59 |
| Lamenting politician | 1 | 0.17 | 0.17 | 0.97 | 0.33 | -0.17 | 0.50 |
| Lamenting politician | 2 | 0.10 | 0.11 | 0.99 | 0.32 | -0.10 | 0.31 |
| Lamenting politician | 3 | 0.04 | 0.08 | 0.52 | 0.61 | -0.12 | 0.20 |
| Lamenting politician | 4 | -0.02 | 0.13 | -0.15 | 0.88 | -0.27 | 0.23 |
| Lamenting politician | 5 | -0.08 | 0.20 | -0.41 | 0.68 | -0.47 | 0.31 |
| Note: | |||||||
| Sample: Respondents with unfavorable outcome. |
6.1.3 Fairness moderated by good loser norm
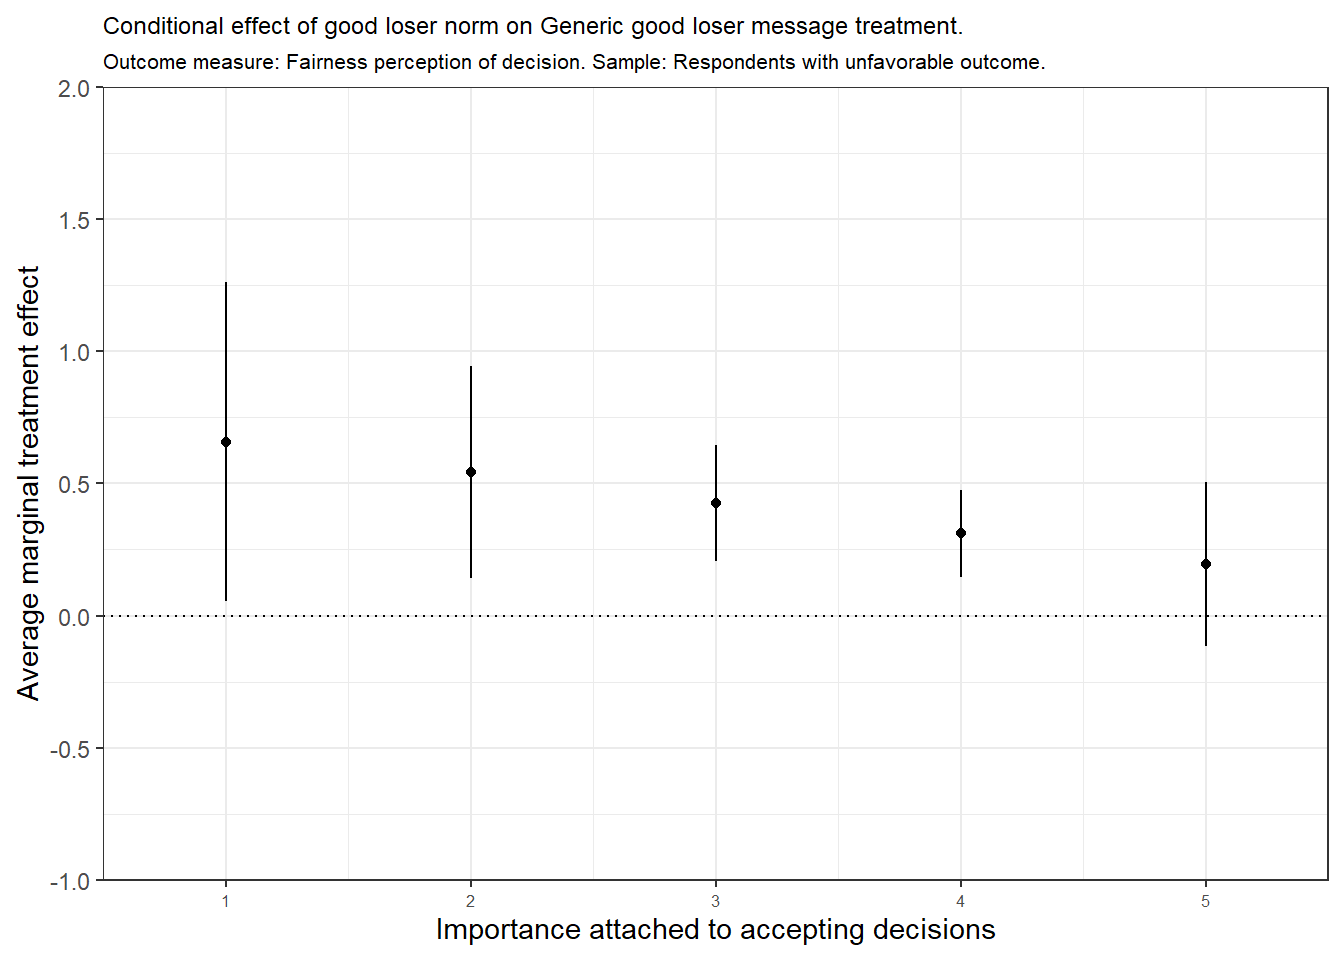
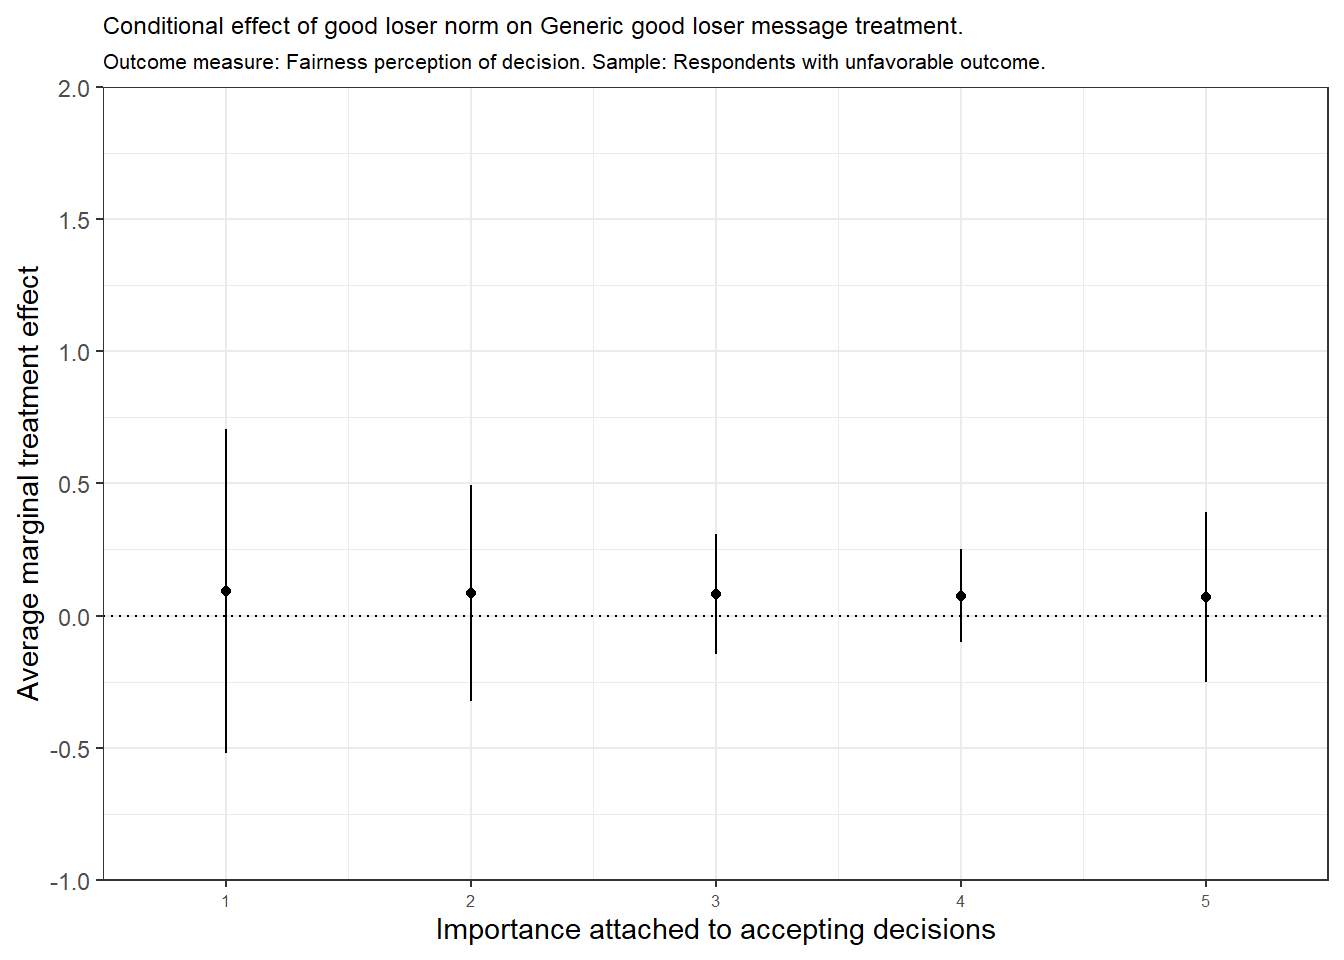
| Factor | Norm importance | AME | SE | z-statistic | p value | Lower | Upper |
|---|---|---|---|---|---|---|---|
| Generic good loser message | 1 | 0.66 | 0.30 | 2.18 | 0.03 | 0.07 | 1.25 |
| Generic good loser message | 2 | 0.54 | 0.20 | 2.70 | 0.01 | 0.15 | 0.93 |
| Generic good loser message | 3 | 0.43 | 0.11 | 3.87 | 0.00 | 0.21 | 0.64 |
| Generic good loser message | 4 | 0.31 | 0.08 | 3.79 | 0.00 | 0.15 | 0.47 |
| Generic good loser message | 5 | 0.20 | 0.15 | 1.26 | 0.21 | -0.11 | 0.50 |
| Lamenting politician | 1 | 0.09 | 0.31 | 0.30 | 0.76 | -0.51 | 0.69 |
| Lamenting politician | 2 | 0.09 | 0.20 | 0.42 | 0.67 | -0.31 | 0.49 |
| Lamenting politician | 3 | 0.08 | 0.11 | 0.71 | 0.47 | -0.14 | 0.30 |
| Lamenting politician | 4 | 0.08 | 0.09 | 0.87 | 0.39 | -0.10 | 0.25 |
| Lamenting politician | 5 | 0.07 | 0.16 | 0.44 | 0.66 | -0.24 | 0.39 |
| Note: | |||||||
| Sample: Respondents with unfavorable outcome. |
6.2 Willingnes to accept
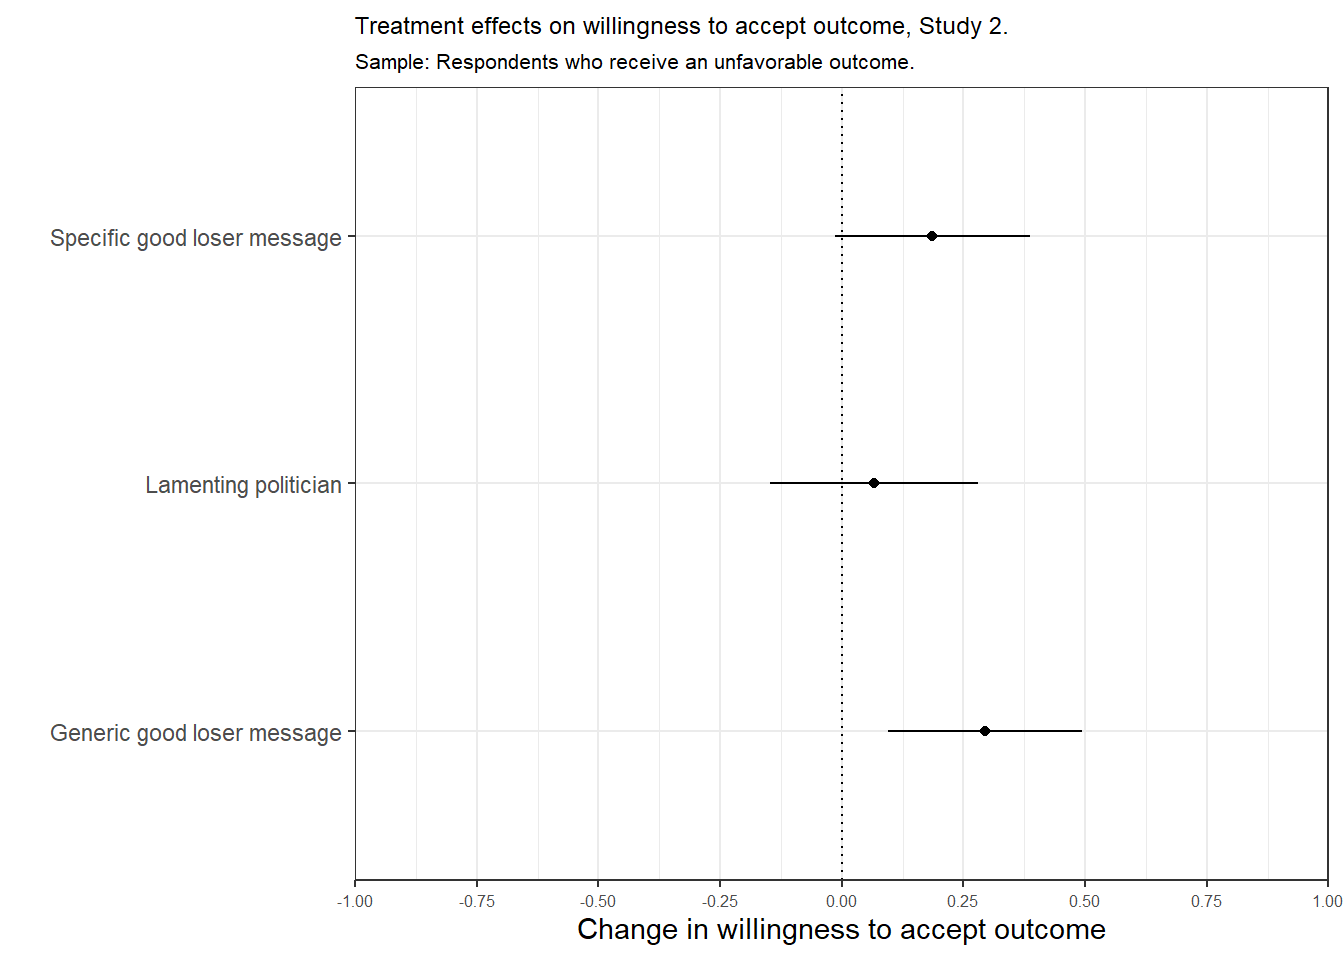
| Treatment value | Estimate | Std. Error | t-statistic | p value |
|---|---|---|---|---|
| Not shown (Intercept) | 3.52 | 0.07 | 47.64 | 0.00 |
| Lamenting politician | 0.07 | 0.11 | 0.63 | 0.53 |
| Generic good loser message | 0.29 | 0.10 | 2.96 | 0.00 |
| Specific good loser message | 0.19 | 0.10 | 1.86 | 0.06 |
6.3 Trust in politician
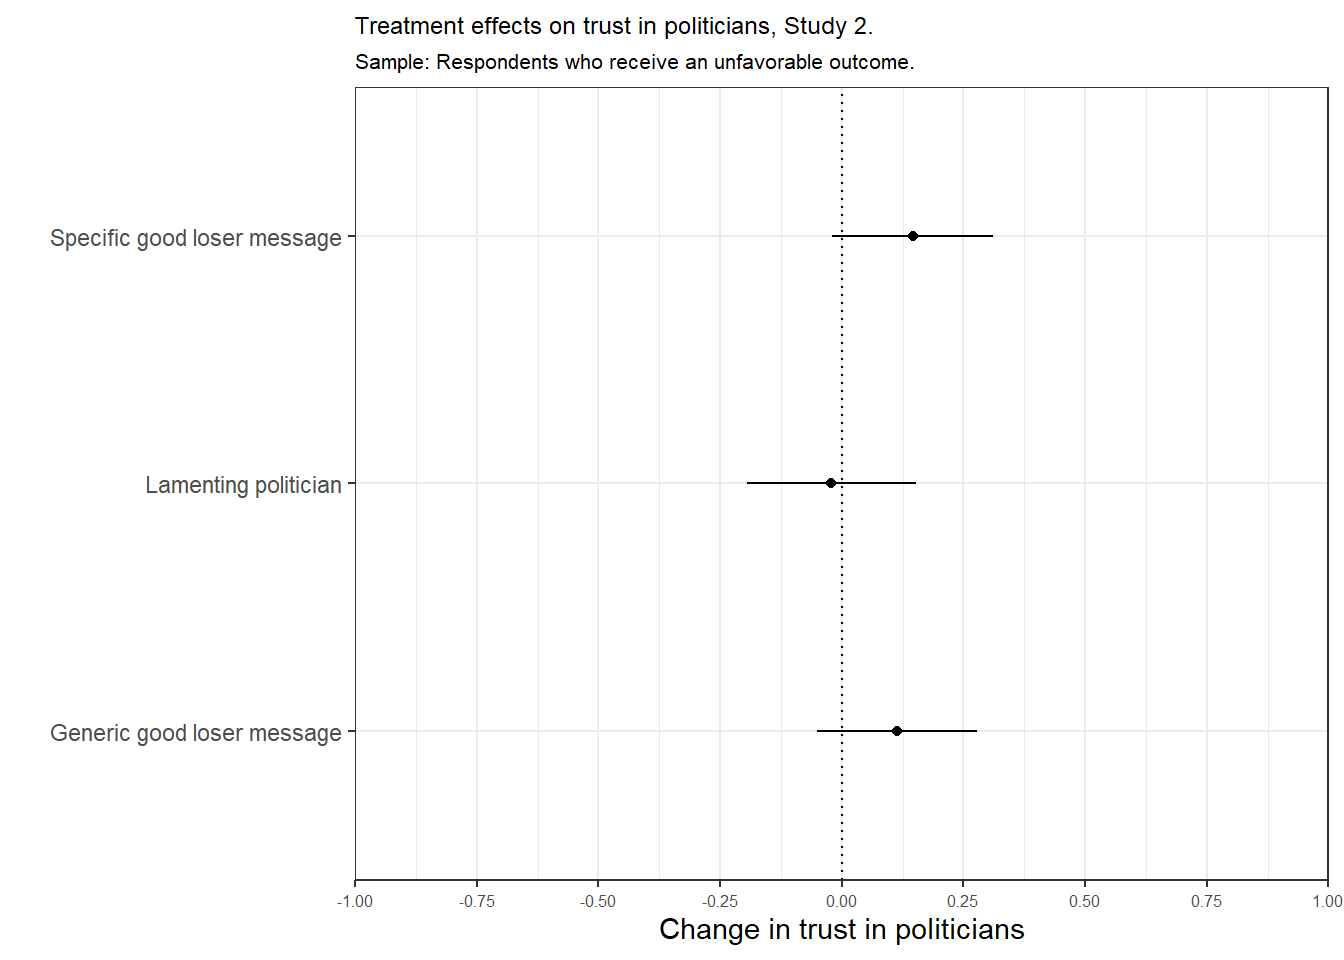
| Treatment value | Estimate | Std. Error | t-statistic | p value |
|---|---|---|---|---|
| Not shown (Intercept) | 3.23 | 0.06 | 53.21 | 0.00 |
| Lamenting politician | -0.02 | 0.09 | -0.24 | 0.81 |
| Generic good loser message | 0.11 | 0.08 | 1.39 | 0.17 |
| Specific good loser message | 0.15 | 0.08 | 1.77 | 0.08 |
6.4 Main effects with reduced sample
Main effects with sample that excludes respondents who fail manipulation check
6.4.1 Fairness
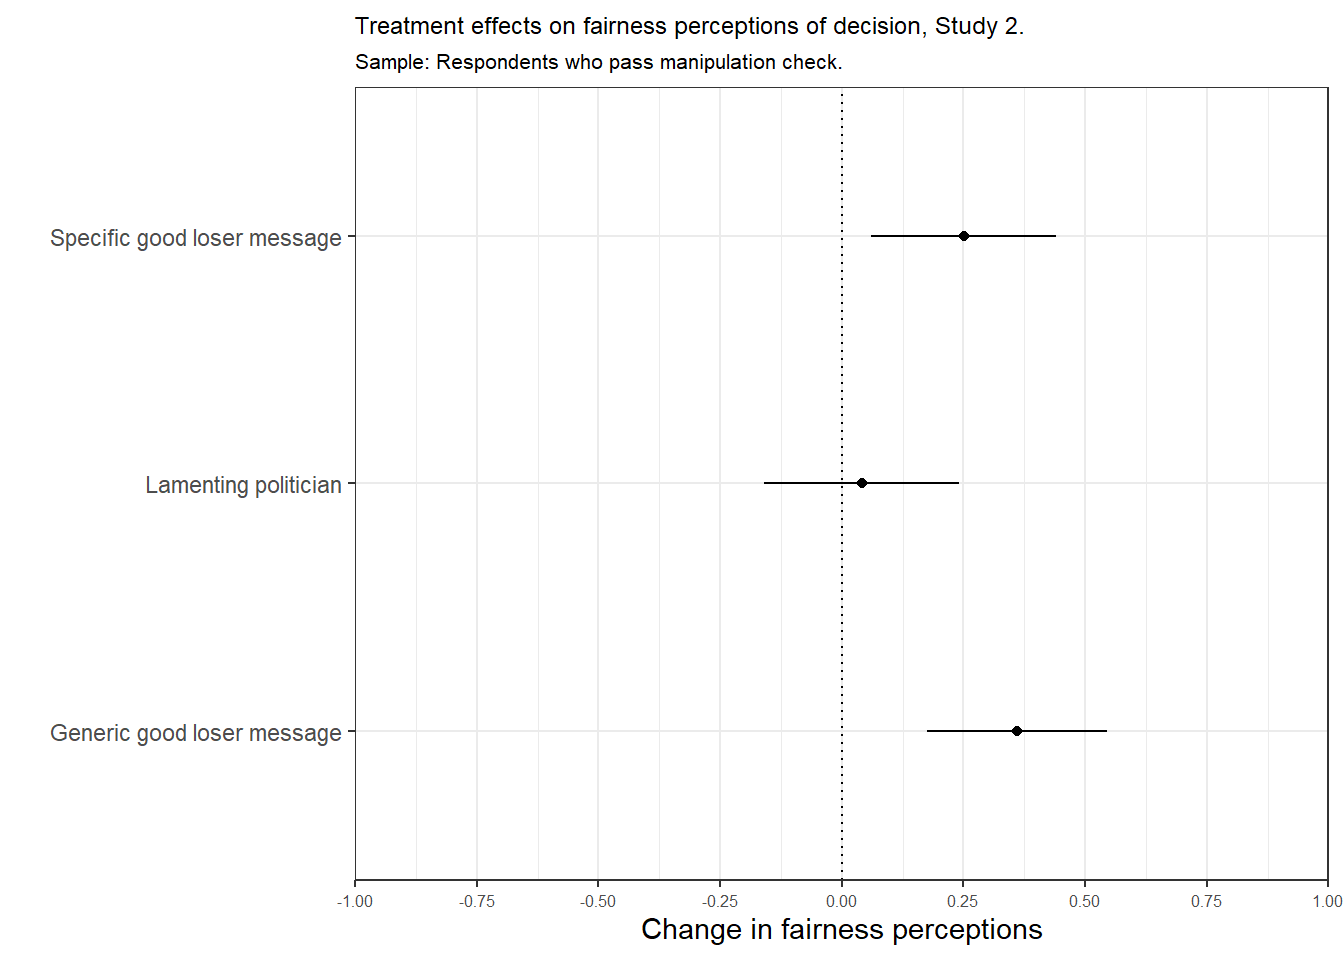
| Treatment value | Estimate | Std. Error | t-statistic | p value |
|---|---|---|---|---|
| Not shown (Intercept) | 3.76 | 0.07 | 53.77 | 0.00 |
| Lamenting politician | 0.04 | 0.10 | 0.41 | 0.68 |
| NA | 0.36 | 0.09 | 3.89 | 0.00 |
| Specific good loser message | 0.25 | 0.09 | 2.64 | 0.01 |
6.4.2 Willingnes to accept
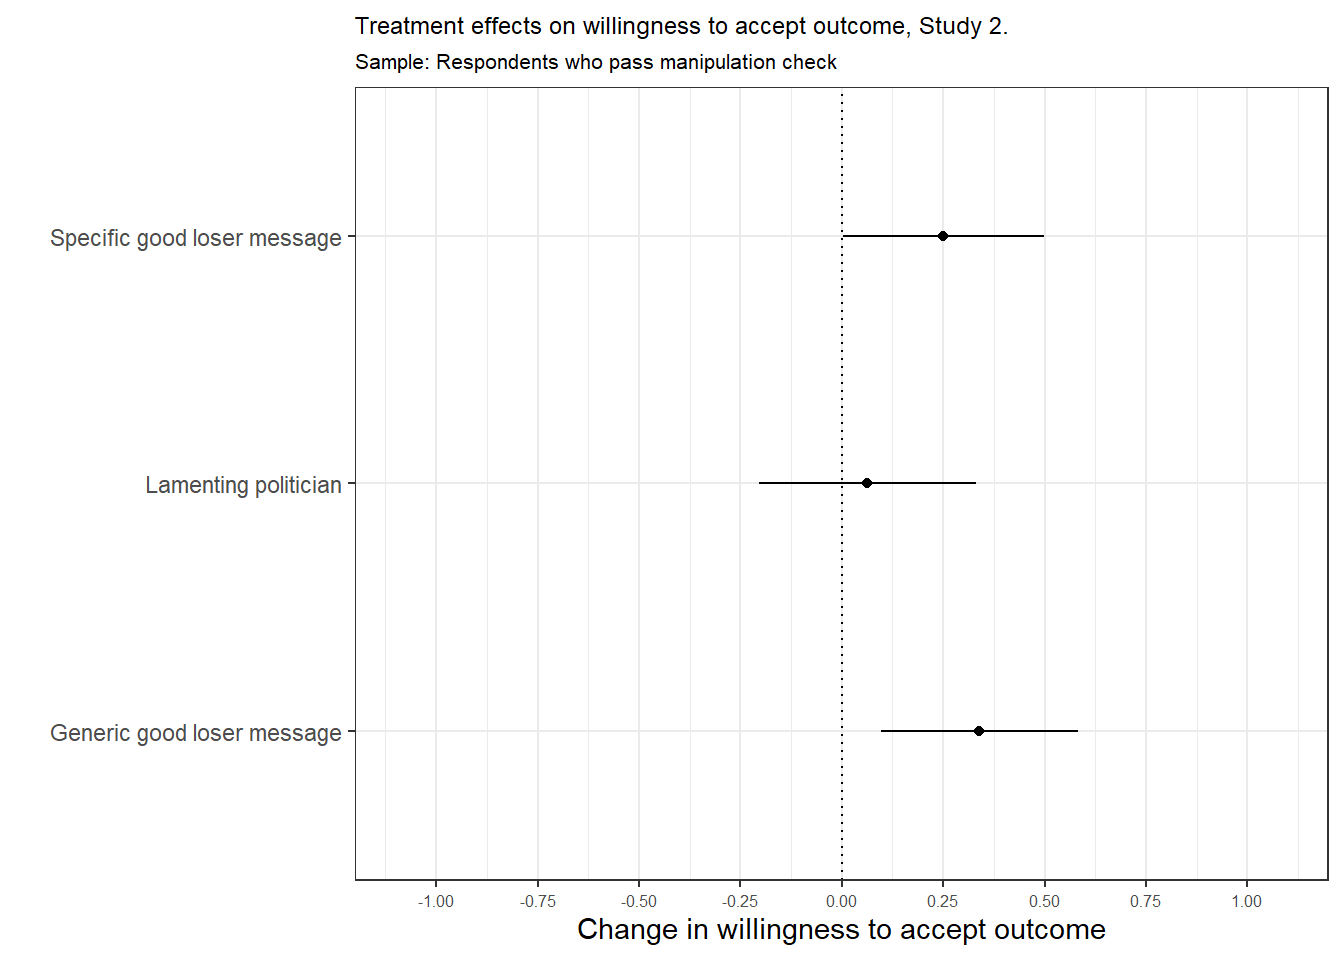
| Treatment value | Estimate | Std. Error | t-statistic | p value |
|---|---|---|---|---|
| Not shown (Intercept) | 3.45 | 0.09 | 37.95 | 0.00 |
| Lamenting politician | 0.06 | 0.13 | 0.47 | 0.64 |
| Generic good loser message | 0.34 | 0.12 | 2.80 | 0.01 |
| Specific good loser message | 0.25 | 0.12 | 2.03 | 0.04 |
6.4.3 Trust in politician
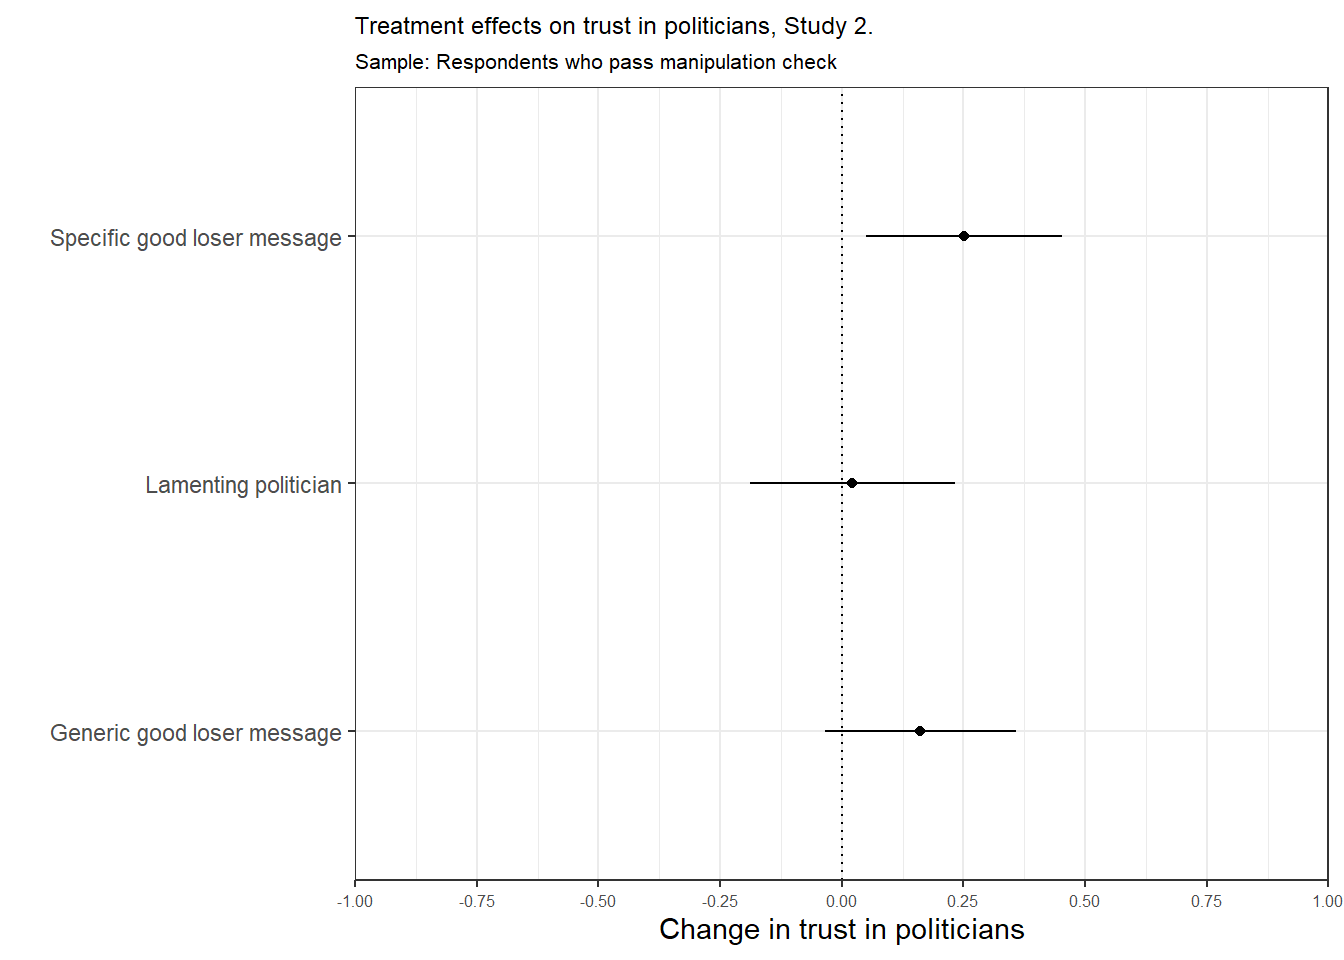
| Treatment value | Estimate | Std. Error | t-statistic | p value |
|---|---|---|---|---|
| Not shown (Intercept) | 3.17 | 0.07 | 42.71 | 0.00 |
| Lamenting politician | 0.02 | 0.11 | 0.21 | 0.83 |
| Generic good loser message | 0.16 | 0.10 | 1.65 | 0.10 |
| Specific good loser message | 0.25 | 0.10 | 2.49 | 0.01 |