Chapter 7 Main effects
The focus of this experiment is the respondents with an unfavorable outcome (‘losers’). For reference, we here show the estimated effects on all respondents, winners and losers alike.
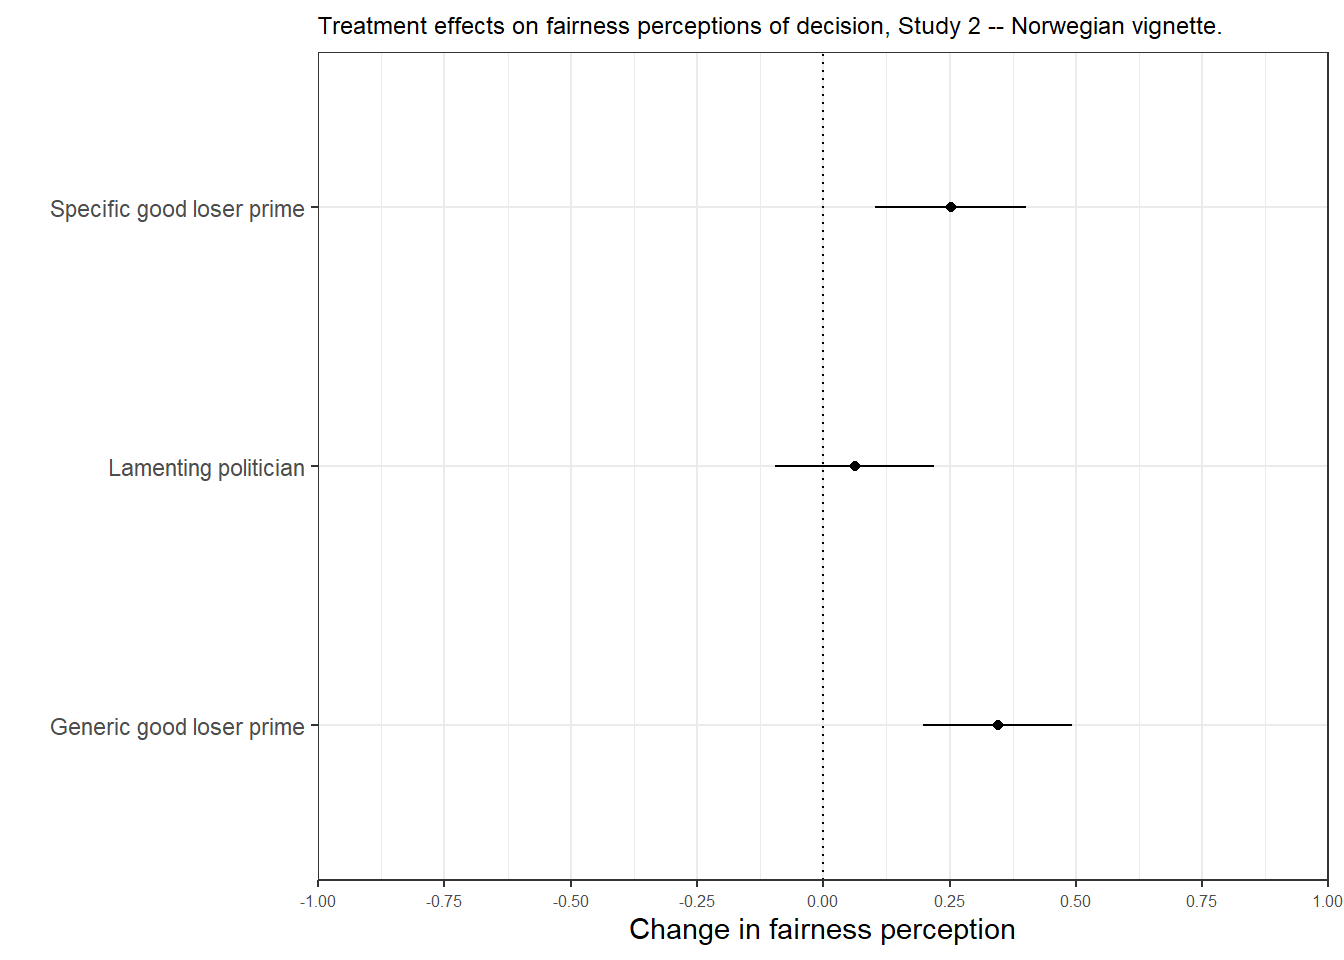
7.1 Fairness
| Treatment value | Estimate | Std. Error | t-statistic | p value |
|---|---|---|---|---|
| Not shown (Intercept) | 3.74 | 0.05 | 68.62 | 0.00 |
| Lamenting politician | 0.06 | 0.08 | 0.80 | 0.43 |
| Generic good loser prime | 0.35 | 0.07 | 4.68 | 0.00 |
| Specific good loser prime | 0.25 | 0.07 | 3.38 | 0.00 |
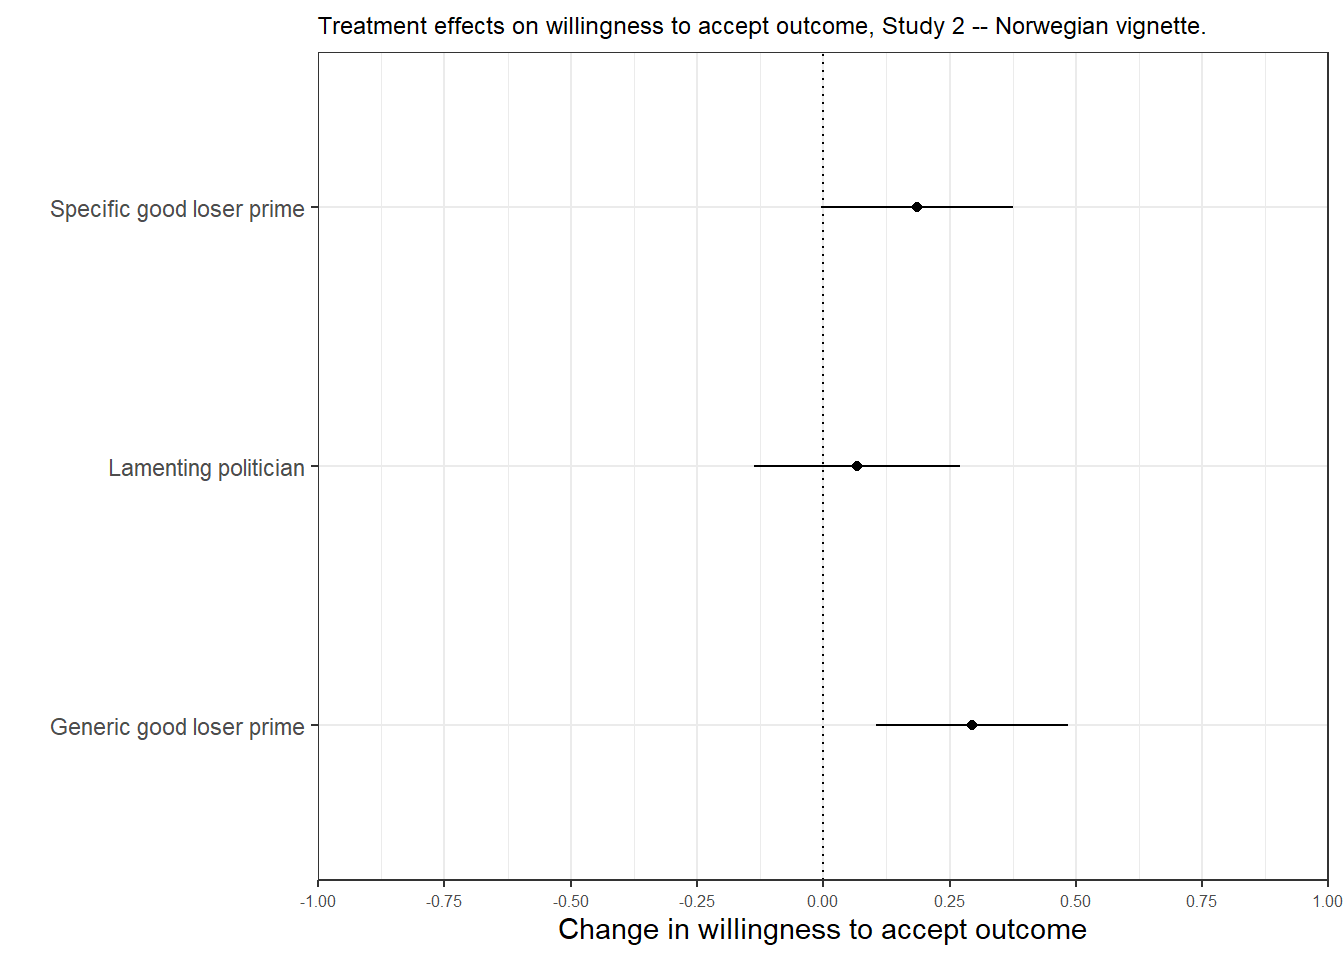
7.2 Willingnes to accept
| Treatment value | Estimate | Std. Error | t-statistic | p value |
|---|---|---|---|---|
| Not shown (Intercept) | 3.52 | 0.07 | 50.01 | 0.00 |
| Lamenting politician | 0.07 | 0.10 | 0.66 | 0.51 |
| Generic good loser prime | 0.29 | 0.09 | 3.10 | 0.00 |
| Specific good loser prime | 0.19 | 0.10 | 1.95 | 0.05 |
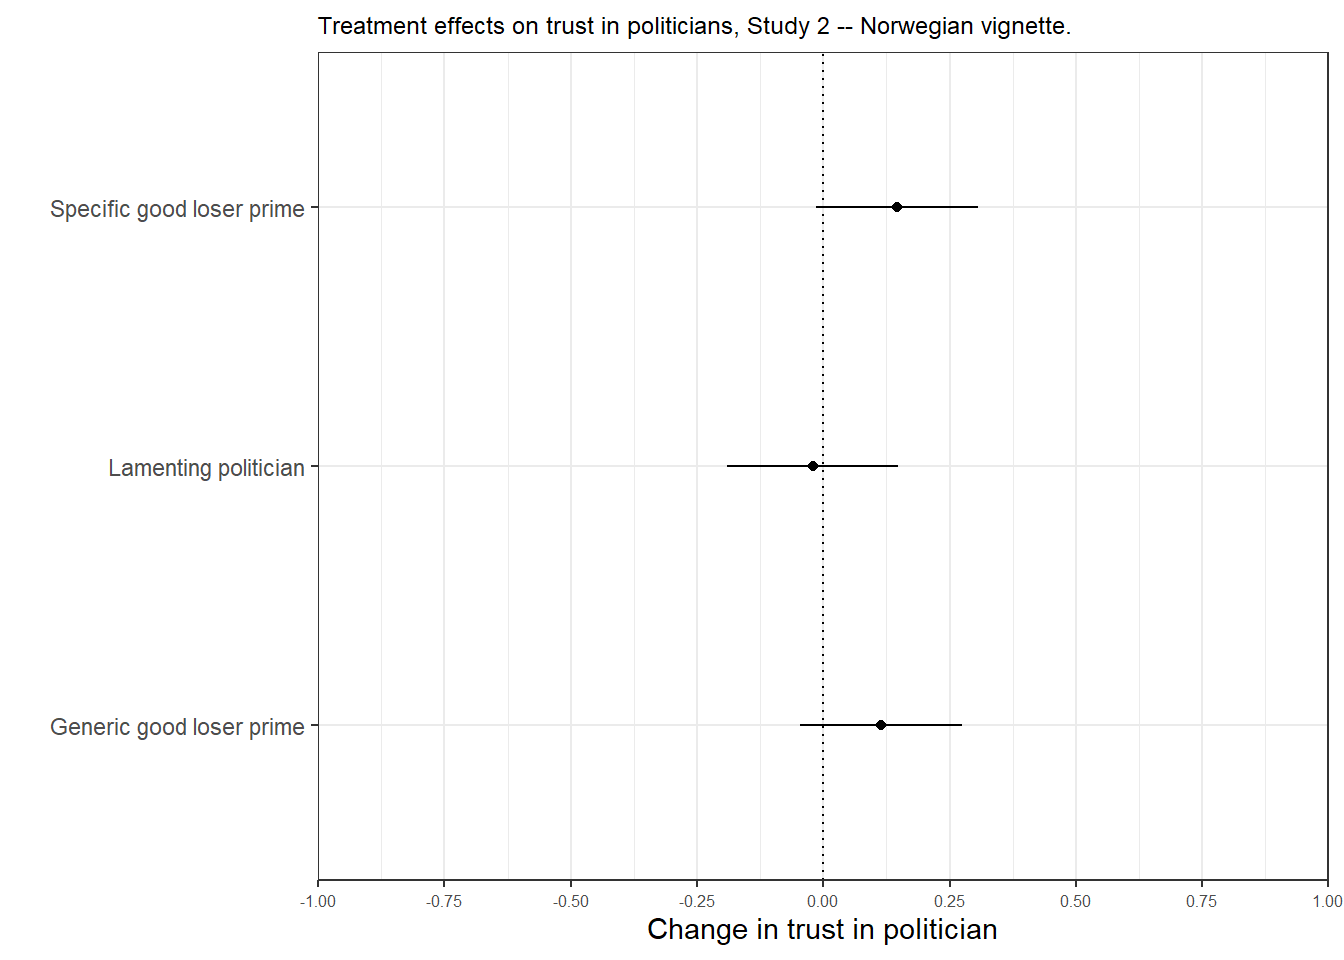
7.3 Trust in politician
| Treatment value | Estimate | Std. Error | t-statistic | p value |
|---|---|---|---|---|
| Not shown (Intercept) | 3.23 | 0.06 | 54.50 | 0.00 |
| Lamenting politician | -0.02 | 0.08 | -0.25 | 0.80 |
| Generic good loser prime | 0.11 | 0.08 | 1.42 | 0.16 |
| Specific good loser prime | 0.15 | 0.08 | 1.81 | 0.07 |
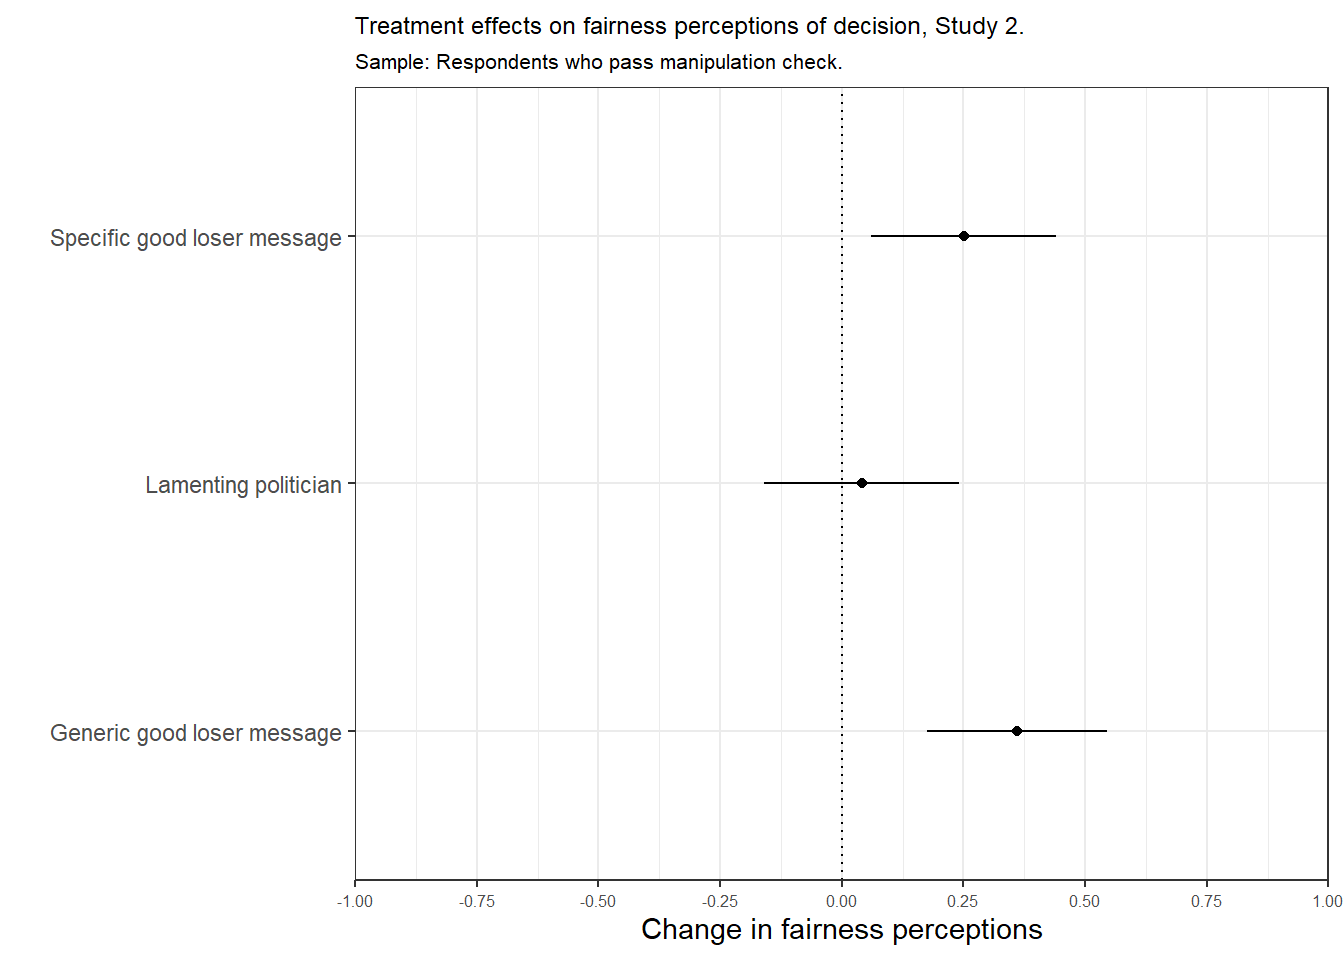
7.4 Main effects with reduced sample
Main effects with sample that excludes respondents who fail manipulation check
7.4.1 Fairness
| Treatment value | Estimate | Std. Error | t-statistic | p value |
|---|---|---|---|---|
| Not shown (Intercept) | 3.76 | 0.07 | 56.49 | 0.00 |
| Lamenting politician | 0.04 | 0.10 | 0.43 | 0.67 |
| NA | 0.36 | 0.09 | 4.09 | 0.00 |
| Specific good loser prime | 0.25 | 0.09 | 2.78 | 0.01 |
7.4.2 Willingnes to accept
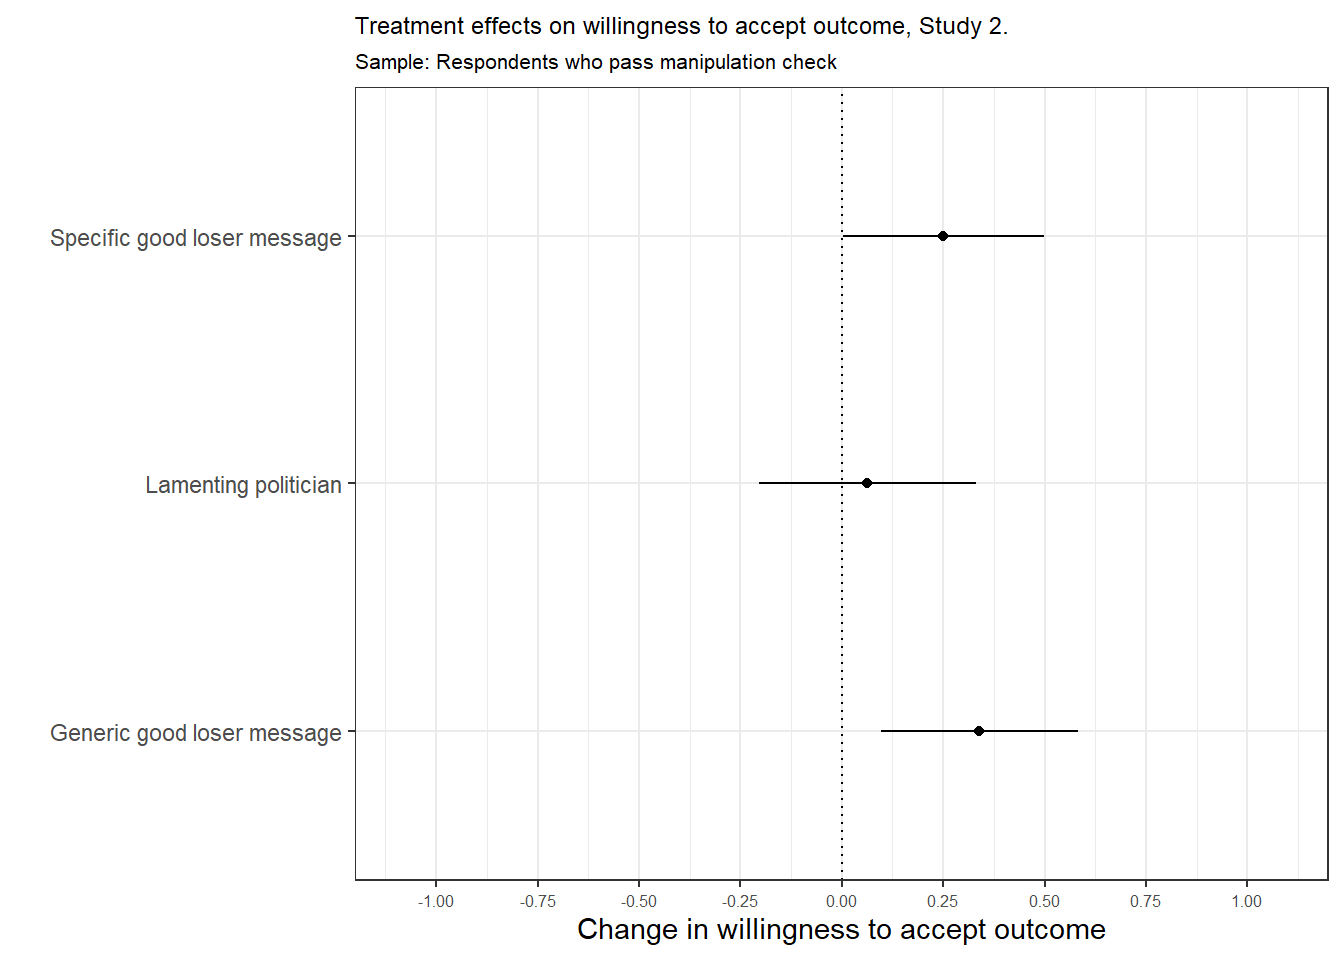
| Treatment value | Estimate | Std. Error | t-statistic | p value |
|---|---|---|---|---|
| Not shown (Intercept) | 3.45 | 0.08 | 41.16 | 0.00 |
| Lamenting politician | 0.06 | 0.12 | 0.51 | 0.61 |
| Generic good loser prime | 0.34 | 0.11 | 3.03 | 0.00 |
| Specific good loser prime | 0.25 | 0.11 | 2.20 | 0.03 |
7.4.3 Trust in politician
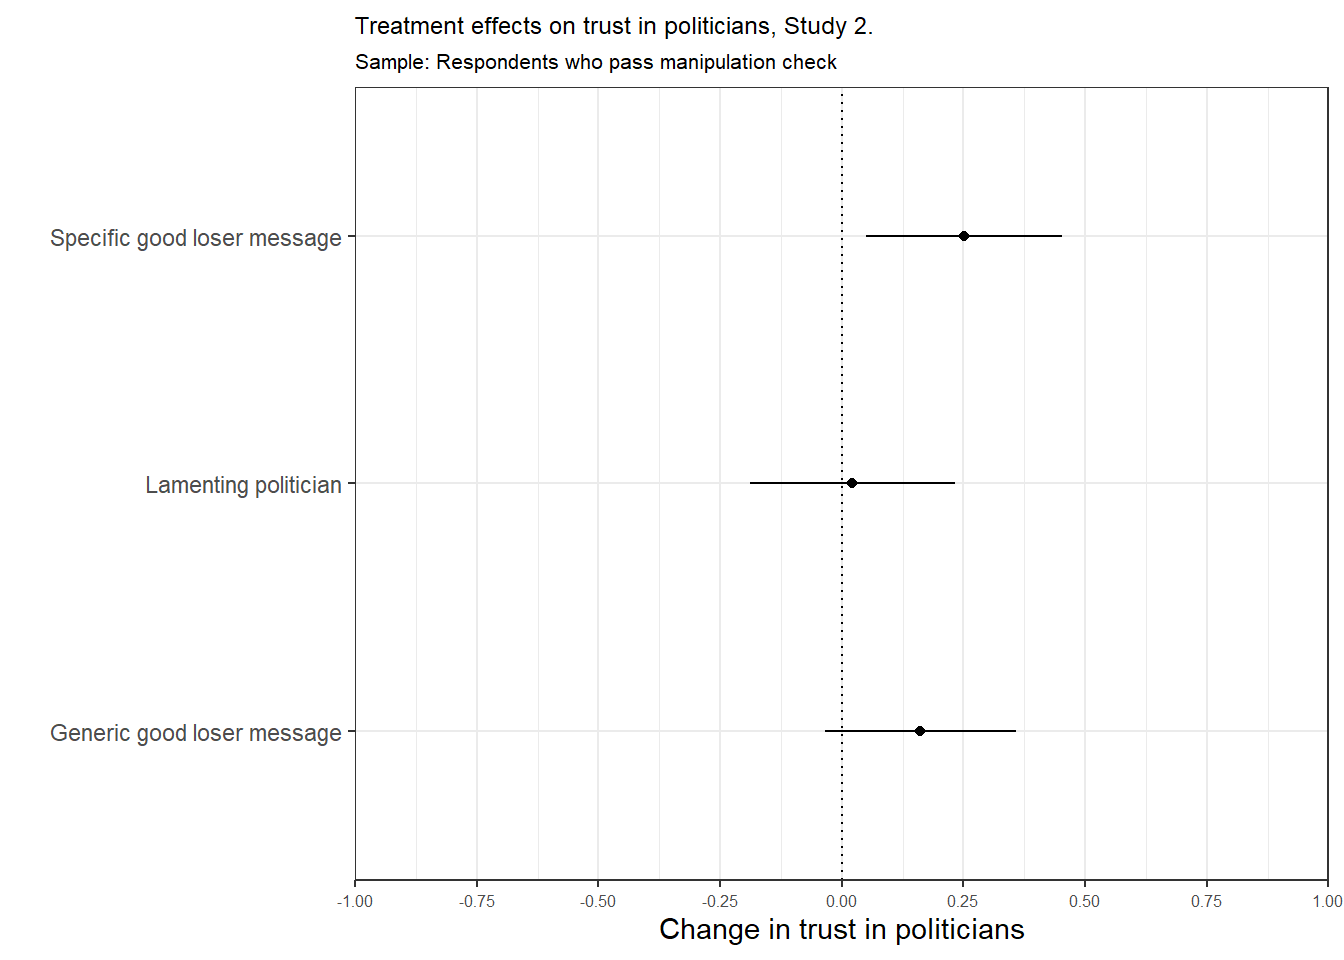
| Treatment value | Estimate | Std. Error | t-statistic | p value |
|---|---|---|---|---|
| Not shown (Intercept) | 3.17 | 0.07 | 44.36 | 0.00 |
| Lamenting politician | 0.02 | 0.10 | 0.22 | 0.83 |
| Generic good loser prime | 0.16 | 0.09 | 1.71 | 0.09 |
| Specific good loser prime | 0.25 | 0.10 | 2.59 | 0.01 |
7.5 Main effects with full ITT sample
7.5.1 Fairness
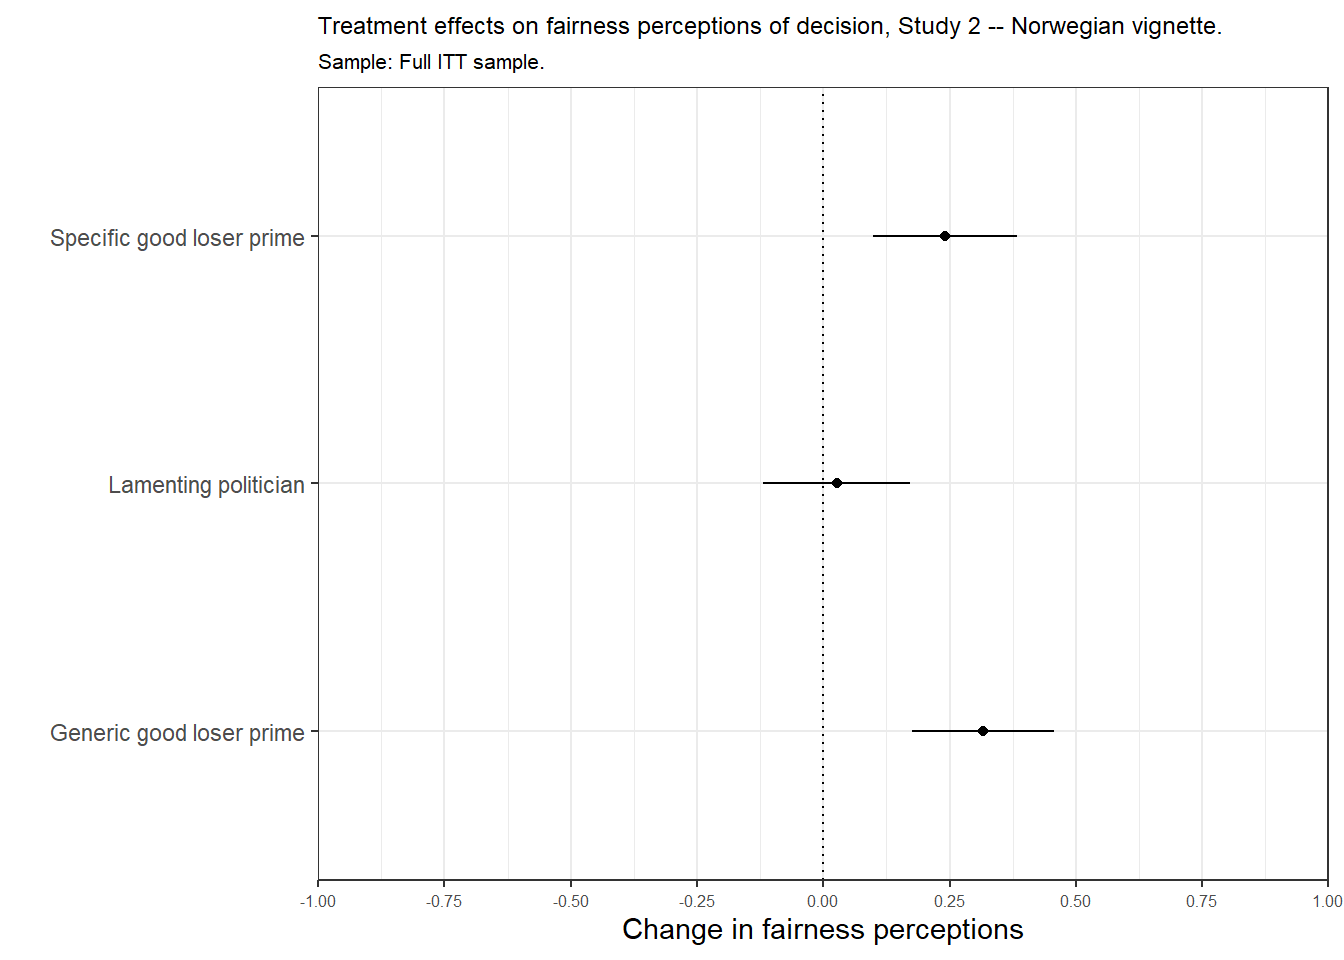
| Treatment value | Estimate | Std. Error | t-statistic | p value |
|---|---|---|---|---|
| Not shown (Intercept) | 3.74 | 0.05 | 72.52 | 0.00 |
| Lamenting politician | 0.03 | 0.07 | 0.36 | 0.72 |
| Generic good loser prime | 0.32 | 0.07 | 4.51 | 0.00 |
| Specific good loser prime | 0.24 | 0.07 | 3.39 | 0.00 |
7.5.2 Willingnes to accept
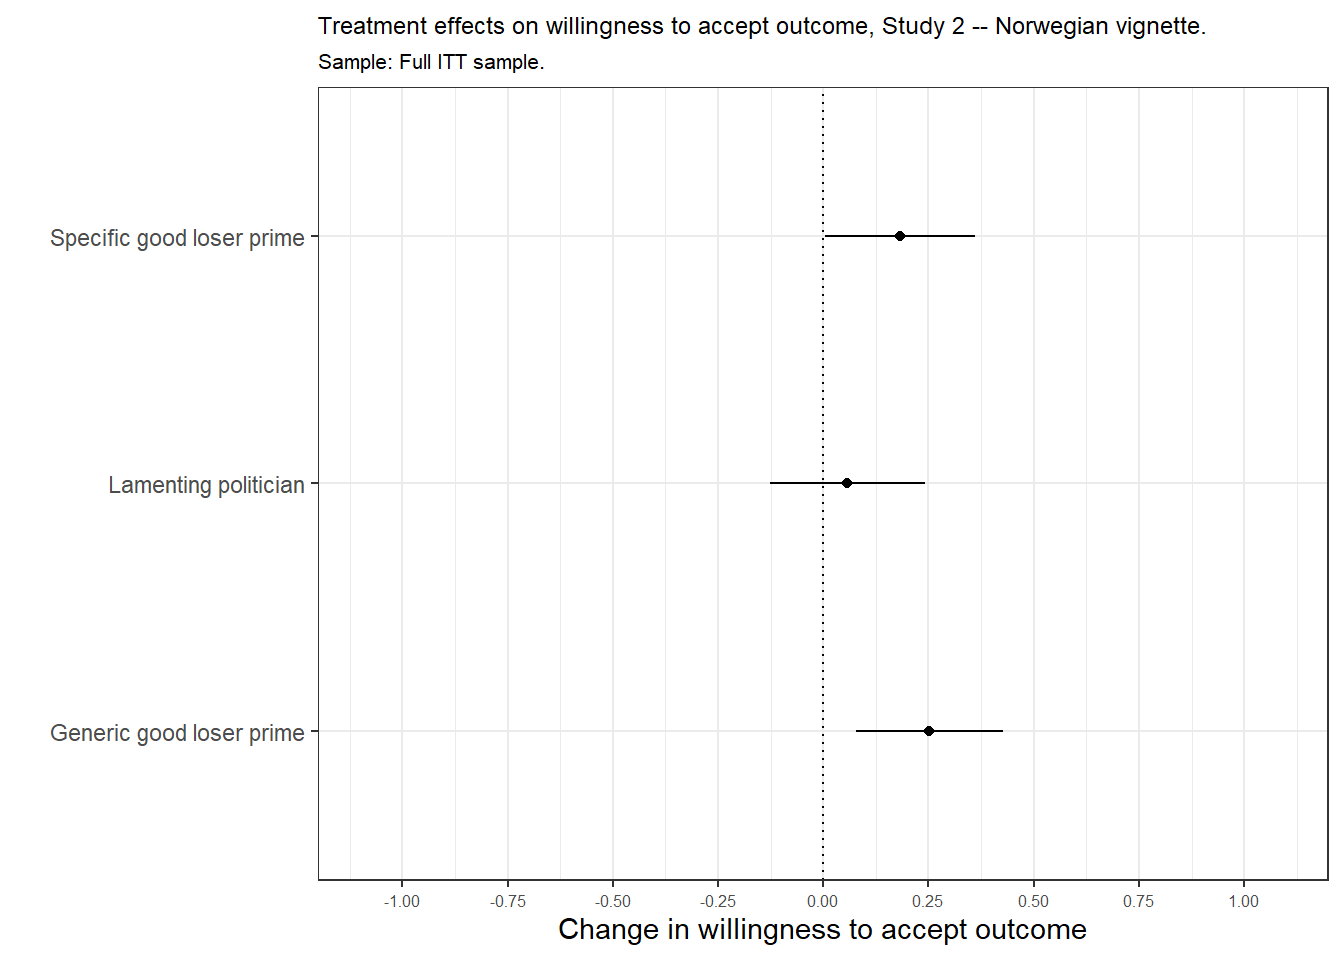
| Treatment value | Estimate | Std. Error | t-statistic | p value |
|---|---|---|---|---|
| Not shown (Intercept) | 3.53 | 0.06 | 54.45 | 0.00 |
| Lamenting politician | 0.06 | 0.09 | 0.62 | 0.53 |
| Generic good loser prime | 0.25 | 0.09 | 2.88 | 0.00 |
| Specific good loser prime | 0.18 | 0.09 | 2.06 | 0.04 |
7.5.3 Trust in politician
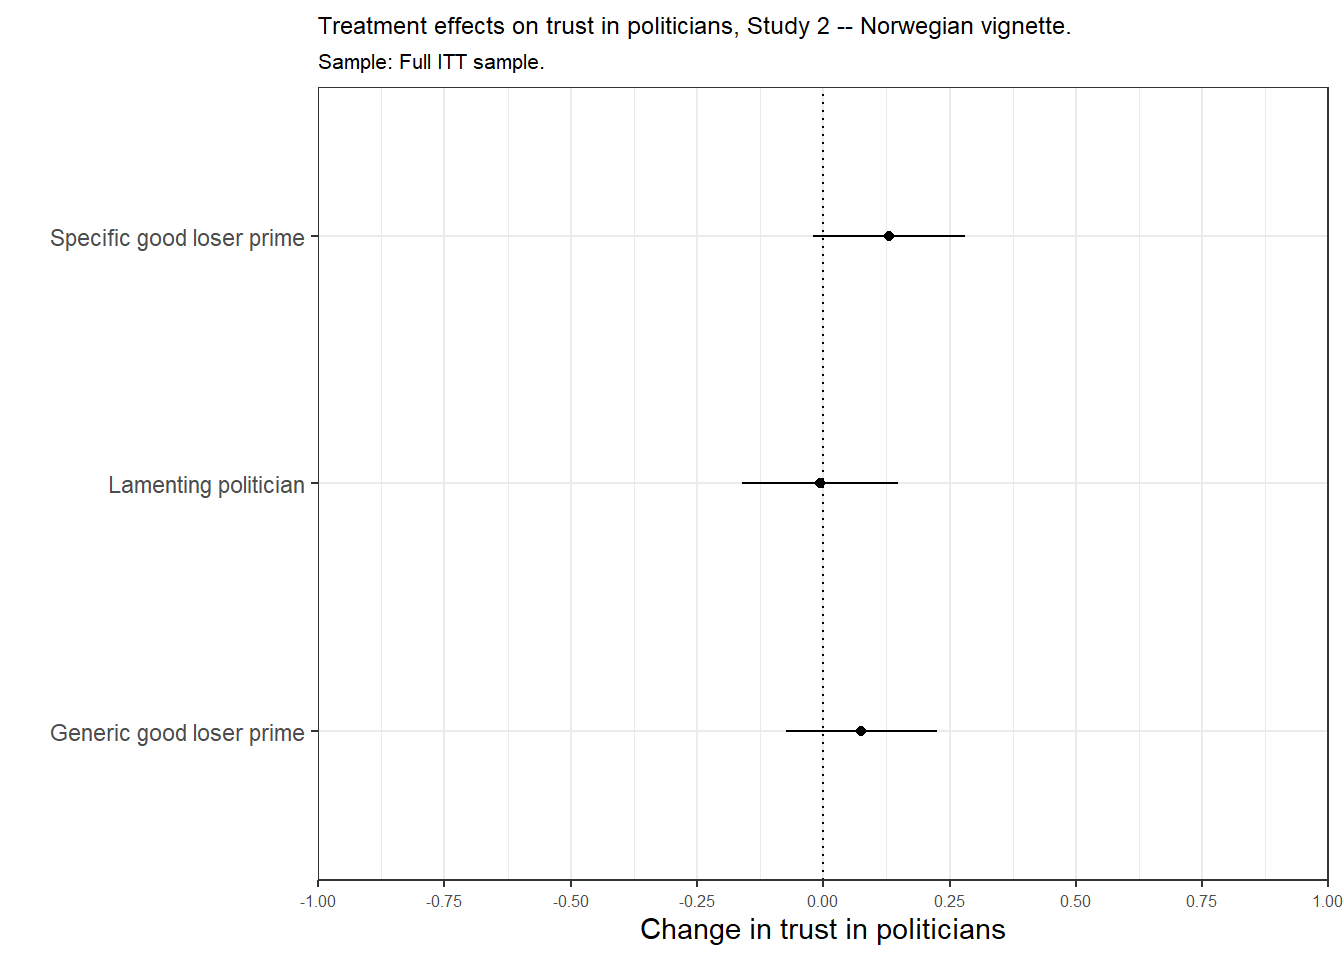
| Treatment value | Estimate | Std. Error | t-statistic | p value |
|---|---|---|---|---|
| Not shown (Intercept) | 3.22 | 0.05 | 58.83 | 0.00 |
| Lamenting politician | -0.01 | 0.08 | -0.08 | 0.94 |
| Generic good loser prime | 0.08 | 0.07 | 1.02 | 0.31 |
| Specific good loser prime | 0.13 | 0.08 | 1.72 | 0.09 |