3.3 Analysis
Remember that this data set is available from the textbook as B12-Long in Appendix A
Once the data are entered, we can begin analysis:
- Use the menu: select Analyses> Frequencies> Independent samples (\(\chi^2\) test of association)
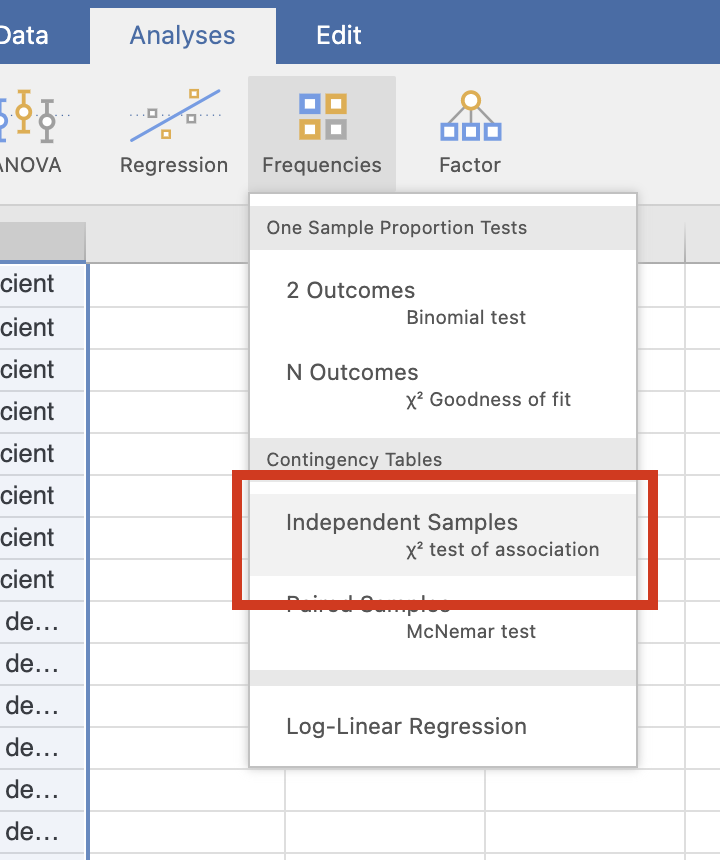
FIGURE 3.2: Select the correct test
- Select the variables: dragging them from the left panel to the Rows and Columns areas as appropriate. In Table 3.1, Diet is in the rows of the table, for example.
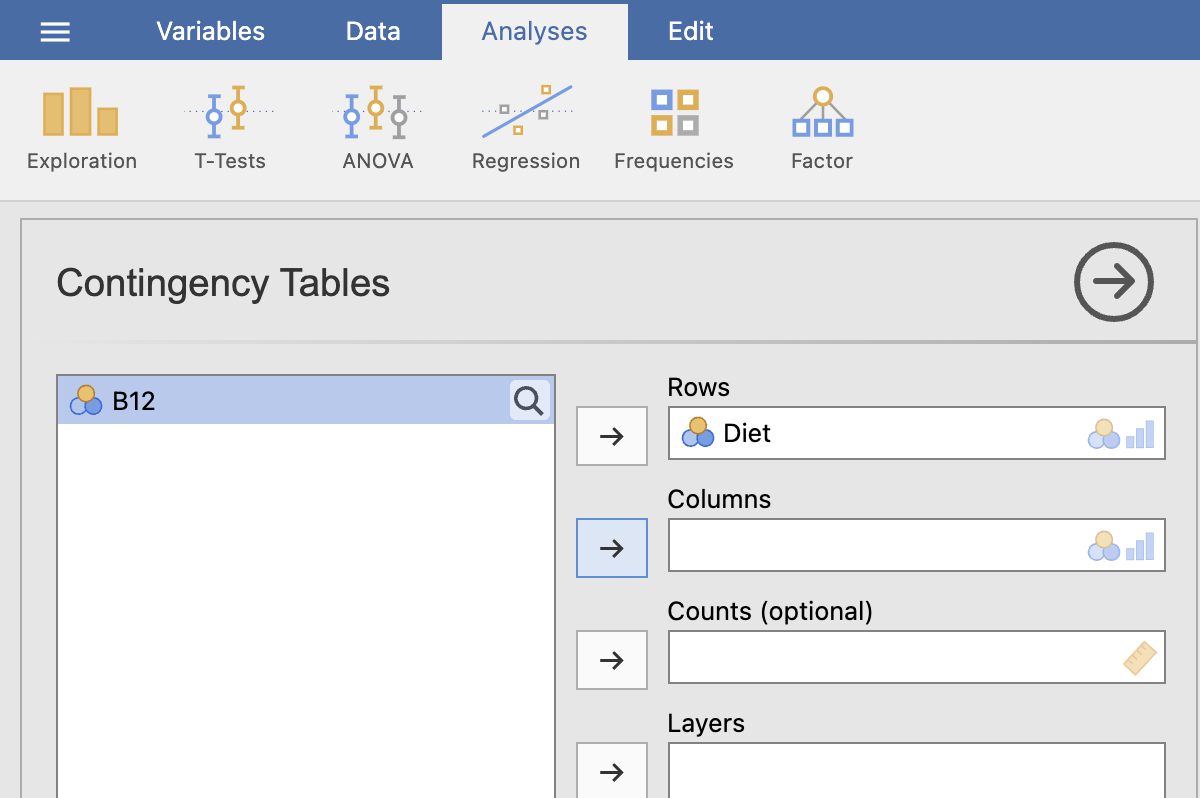
FIGURE 3.3: Enter the variables
- Select the analysis options: Under the area where you entered the variables, select the right-pointing arrow beside Statistics, and then:
- Select
X2: this conducts the \(\chi^2\) hypothesis test for comparing odds. - Select
z test for difference in 2 proportions: this conducts the \(z\)-test to compare proportions. - Select
Odds ratio: this shows the value of the odds ratio. - Select
Difference in proportions: this shows the difference between the two proportions. - Select
Confidence intervals: this shows the CI for the odds ratio, and for the difference between the proportions.
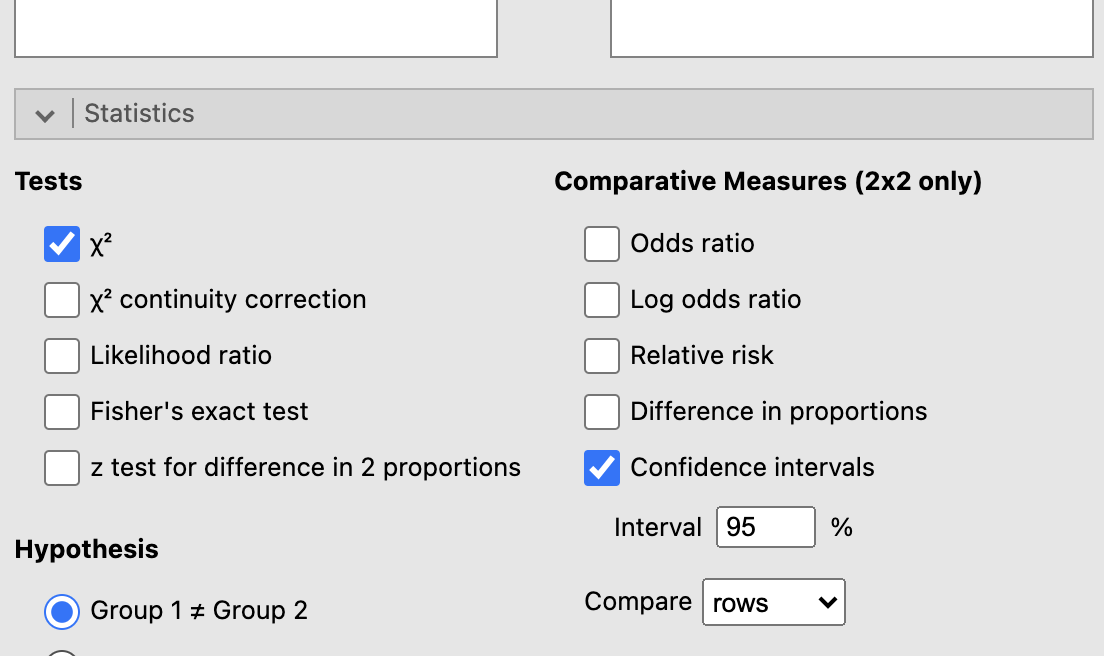
FIGURE 3.4: Check the correct options
- You will have your output in the jamovi Output window on the right.