2 jamovi: general information
Topics covered in this chapter:
- Tips for working with jamovi.
Before starting analysis with jamovi (The jamovi Project, n.d.), here are some general tips:
- jamovi is a very new package (built on R (R Core Team 2025)), and currently lacks some desirable features. These will no doubt arrive in due time.
- jamovi is free to download, from the jamovi webpage.
- Except for graphs, jamovi output should not be presented in reports or presentations.
Instead, the information from jamovi output should be used to construct proper tables, or to produce proper conclusions. - The information about the variables must be correctly set up before analysis.
- In jamovi (as with most statistical software), each row represents one unit of analysis.
- In jamovi (as with most statistical software), each column represents one variable.
- At the top of each column (but not in Row 1!) is the name of the variable; double click on the variable name and set information about the variables there (Fig. 2.1). Then you can tell jamovi information about the variables, such as whether the data are nominal, ordinal or ‘continuous’ (which is what jamovi calls all quantitative variables…), and the levels of the nominal and ordinal variables (Fig. 2.2).
- You can get help with using jamovi by:
- Watching software screencasts on Canvas.
- Using jamovi resources.
- Using LinkedIn Learning.
- Watching videos.
- Asking SCI110 staff in tutorials, or in the Canvas Discussions.
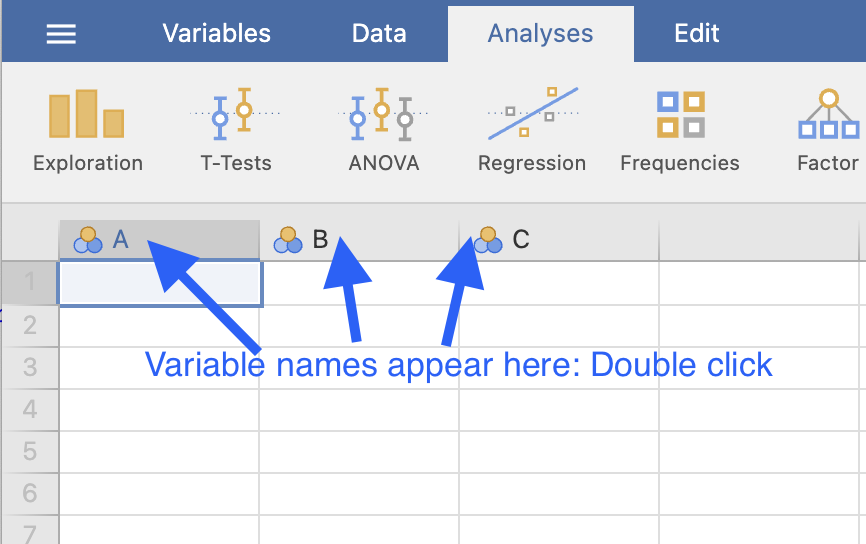
FIGURE 2.1: Click on the column headers to describe the variables
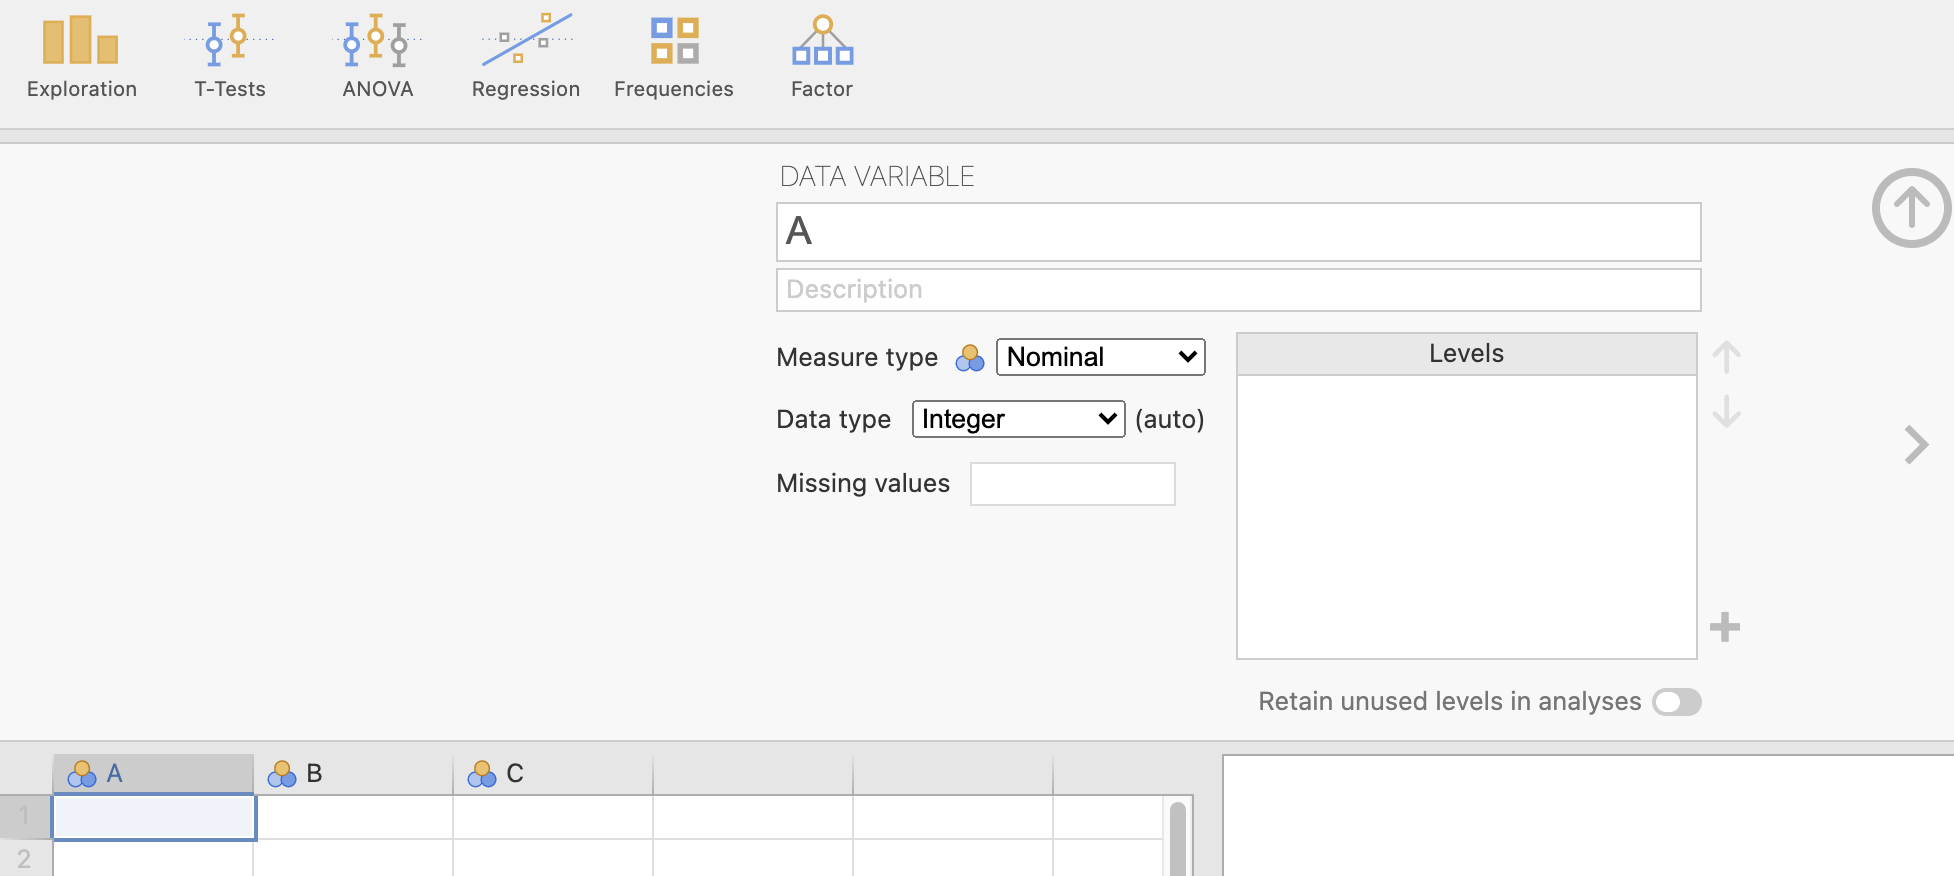
FIGURE 2.2: The information to fill in for each variable
References
R Core Team. 2025. R: A Language and Environment for Statistical Computing. Vienna, Austria: R Foundation for Statistical Computing. https://www.R-project.org/.
The jamovi Project. n.d. jamovi (Version 2.5) [Computer Software]. https://www.jamovi.org.