9 SPSS: graphs
Topics covered in this tutorial:
- Creating graphs in SPSS.
The data files used in this section can be downloaded in Sect. 10.
You can download the data, and follow the instructions.Graphs in SPSS are generally produced using the Graphs menu, and then selecting Chart Builder…
After making this selection, you usually get a warning (Fig. 9.1)). It is reminding you that it is really important that your have declared the Measure correctly for each variable in the Variable View (that is, correctly declared each variable as Nominal, Ordinal or Scale); see Sect. 6.
Provided you have done so, you can press OK.
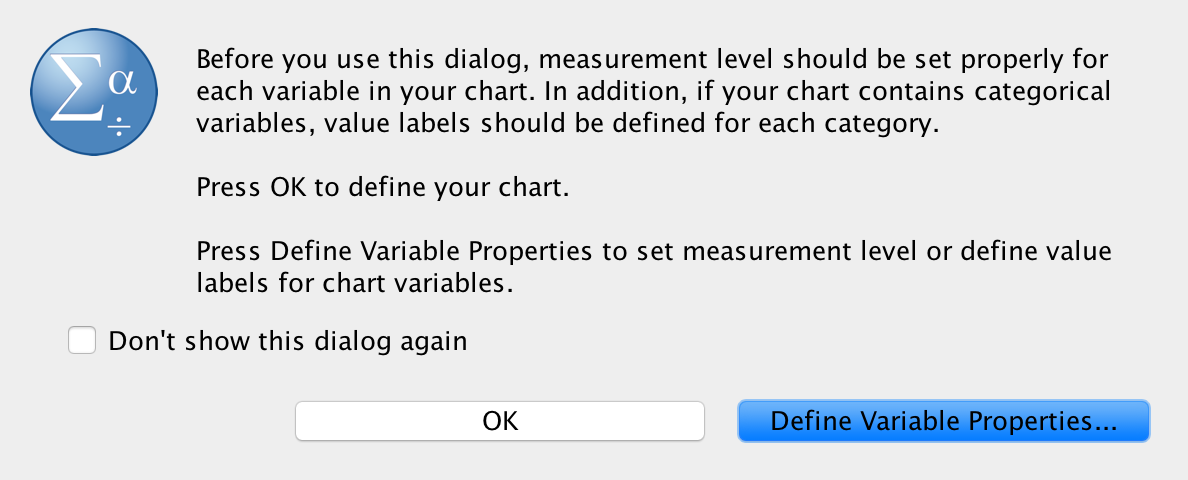
FIGURE 9.1: The warning after selecting Graphs
When graphs are created in SPSS using the Chart Builder, the window shown in Fig. 9.2 initially appears. Select the Options item from the right-hand side of this window.
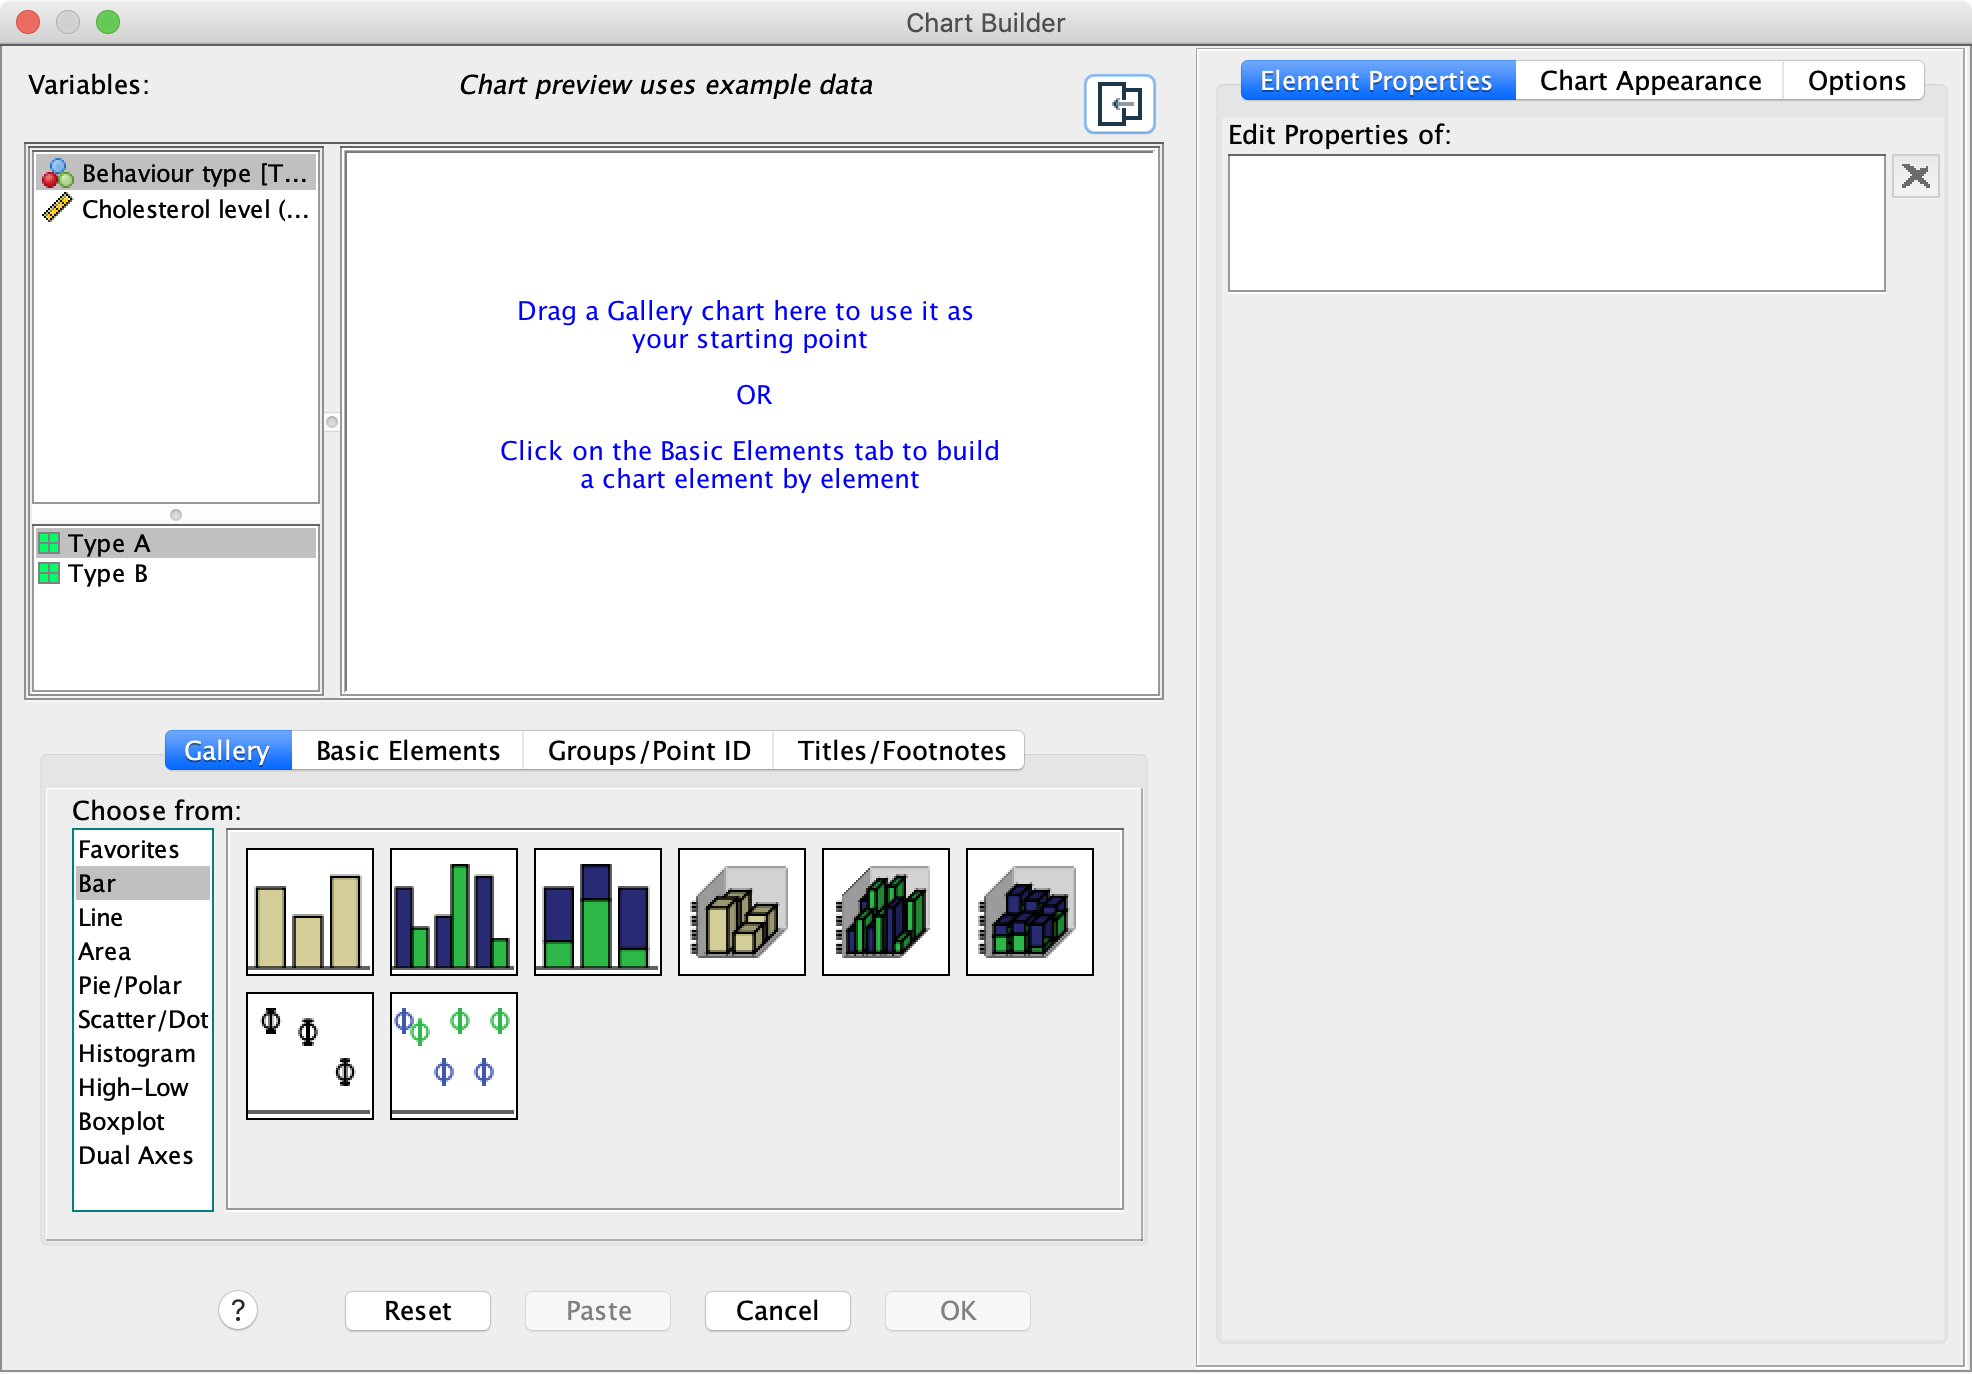
FIGURE 9.2: The Chart Builder window
Then, change the Chart size to (say) 60% or a similar value (Fig. 9.3). Now, when you copy-and-paste the graph, the sizing will be more appropriate.
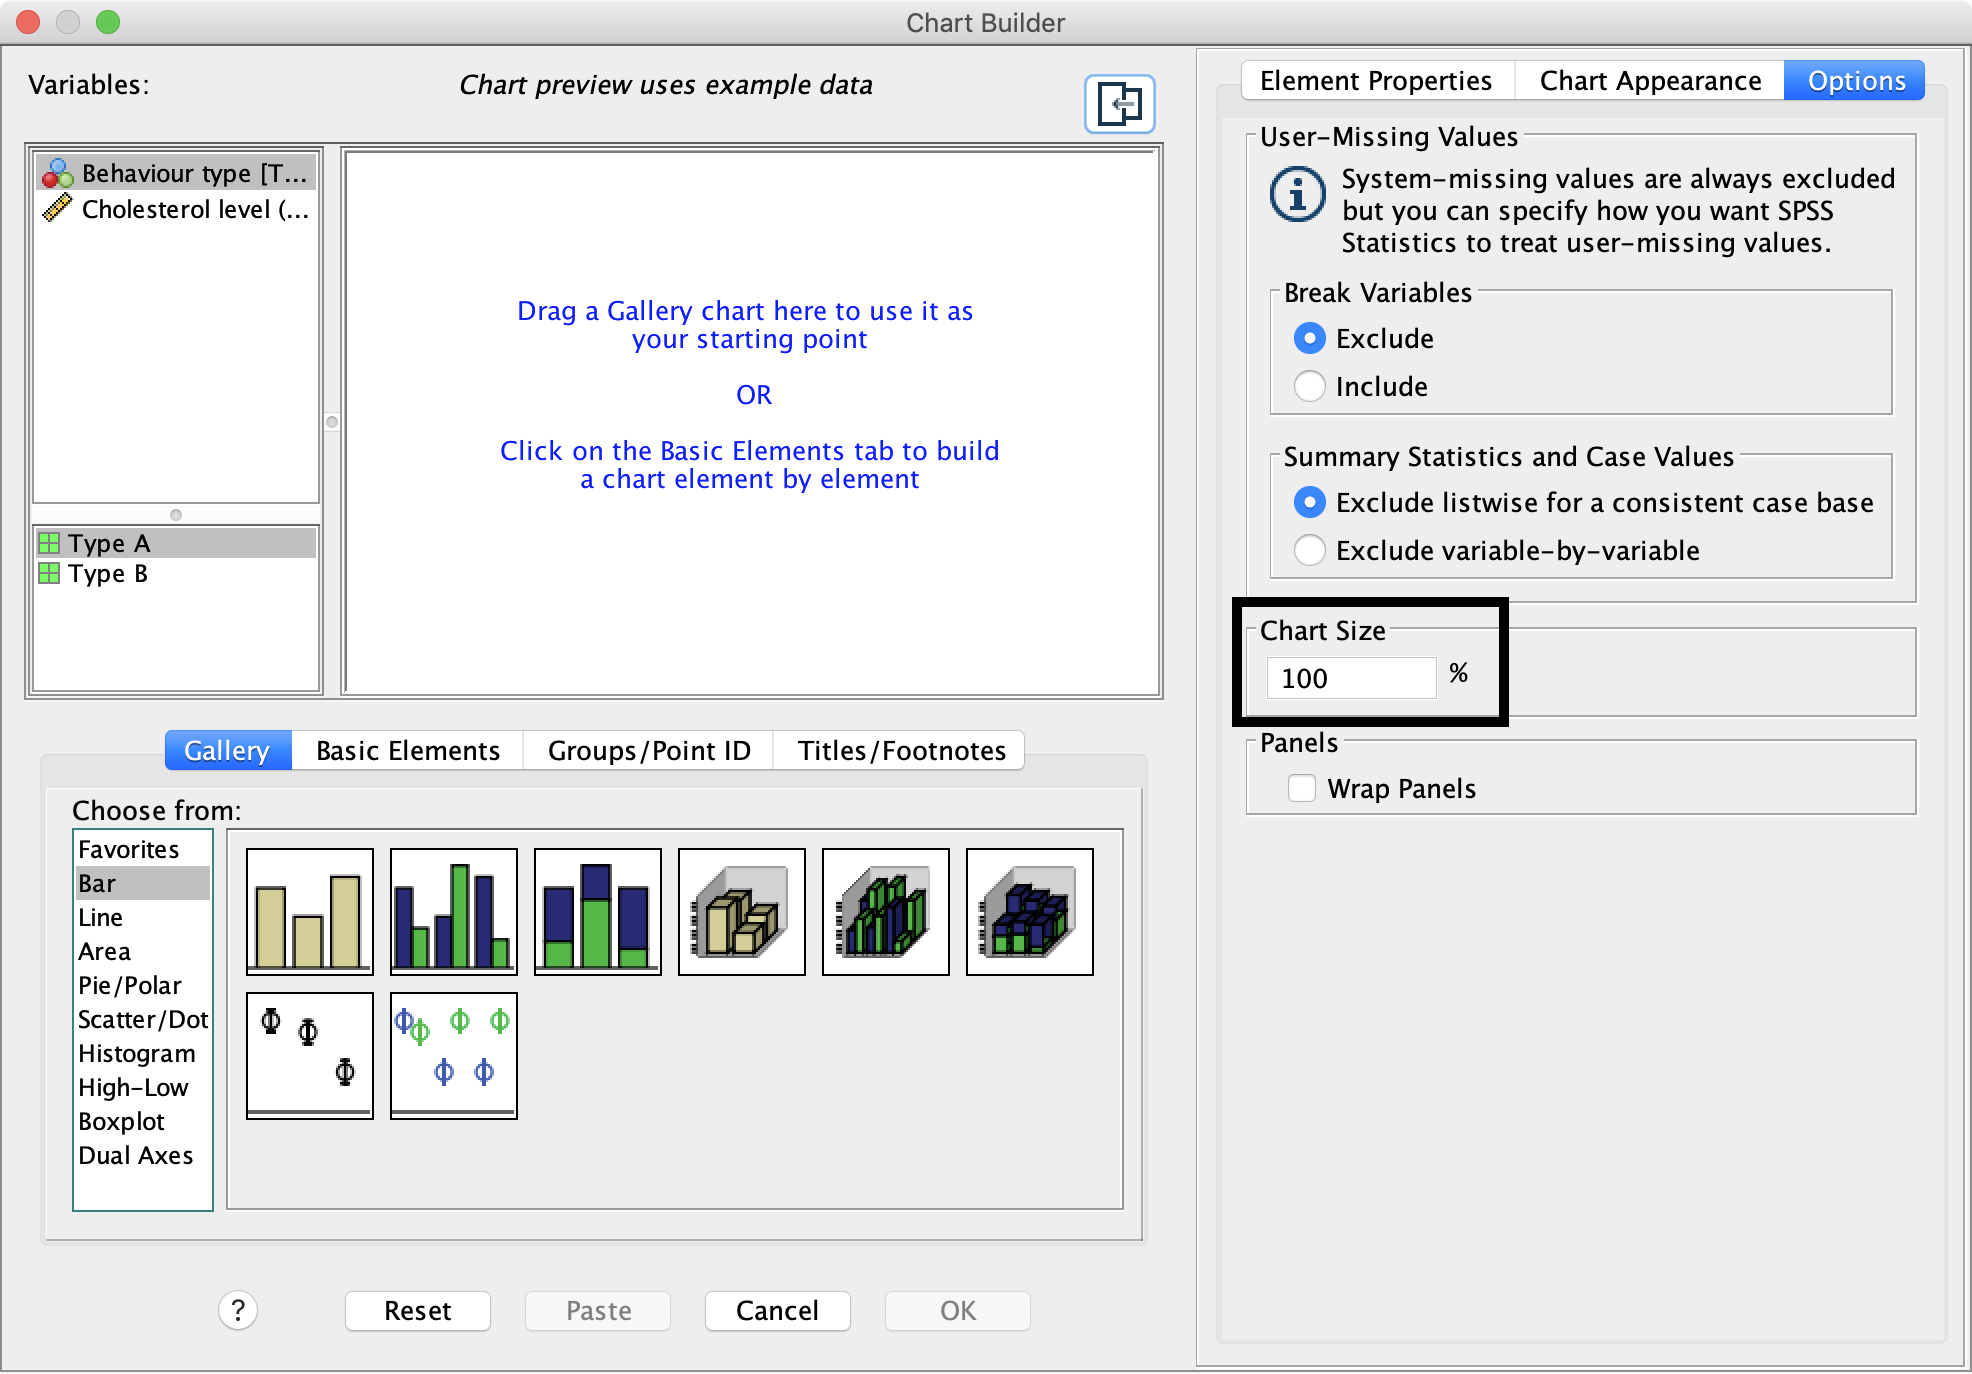
FIGURE 9.3: The warning after selecting Graphs