8.2 Data entry
In the Data View, each row represents a unit of analysis (in this case, a person), as is usual in SPSS.
Each unit of analysis gets two variables recorded on it: one is quantitative (LeanAngle), and one is qualitative (Group).
So there are two columns in the Data View, one for each variable.
The order doesn’t matter, but here the quantitative variable is listed first (the lean-forward angle), and then the qualitative variable (the age group).
The Variable View needs to be set up correctly too (Fig. 8.1).
For example, all variables should be given a descriptive label.
The quantitative variable (here, LeanAngle) should be declared as Scale in the Measure column.
The qualitative variable (here, Group) should be declared as Nominal in the Measure column (Fig. 8.2).
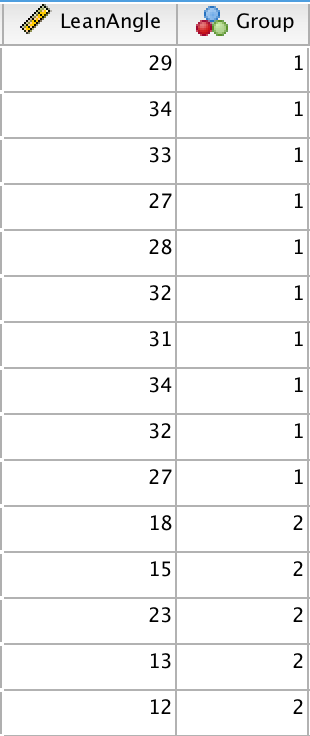
FIGURE 8.1: The data in the Data View

FIGURE 8.2: The Variable View
The two age groups are defined so that a 1 represents younger women, and a 2 represents older women.
Since this is arbitrary, we tell SPSS this by setting the Values in the Variable View (Fig. 8.3).
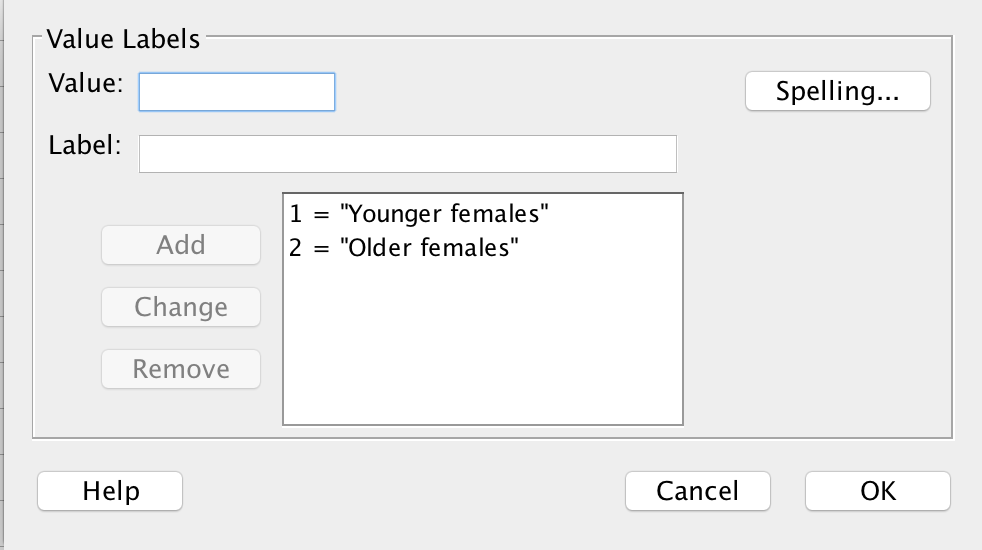
FIGURE 8.3: Defining the levels (Values) for the age group, in the Variable View