4.2 Data entry
In the Data area, each row represents a unit of analysis (in this case, a person), as is usual in jamovi (Fig. 4.1).
Each unit of analysis gets two variables recorded: one is quantitative (Lean angle (in degrees)), and one is qualitative (Age group). So there are two columns in the data, one for each variable.
The order of the variables doesn’t matter, but here the quantitative variable is listed first (the lean-forward angle), and then the qualitative variable (the age group).
The variables need to be properly set up (by double-clicking on the variable names); see Figs. 4.2 and 4.3.
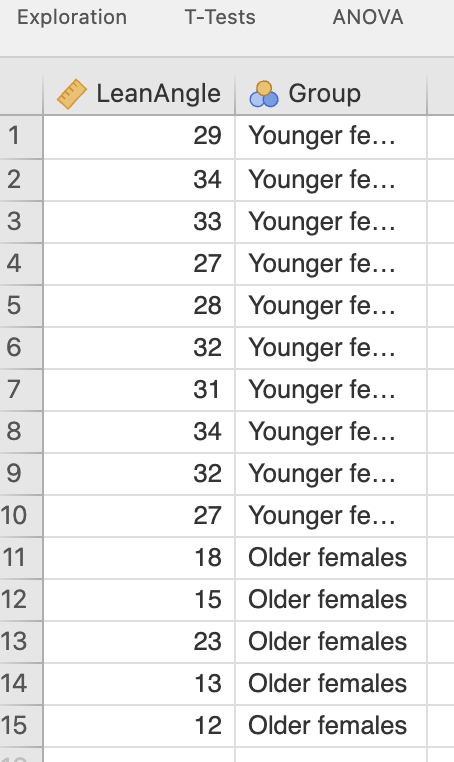
FIGURE 4.1: The data entered in jamovi
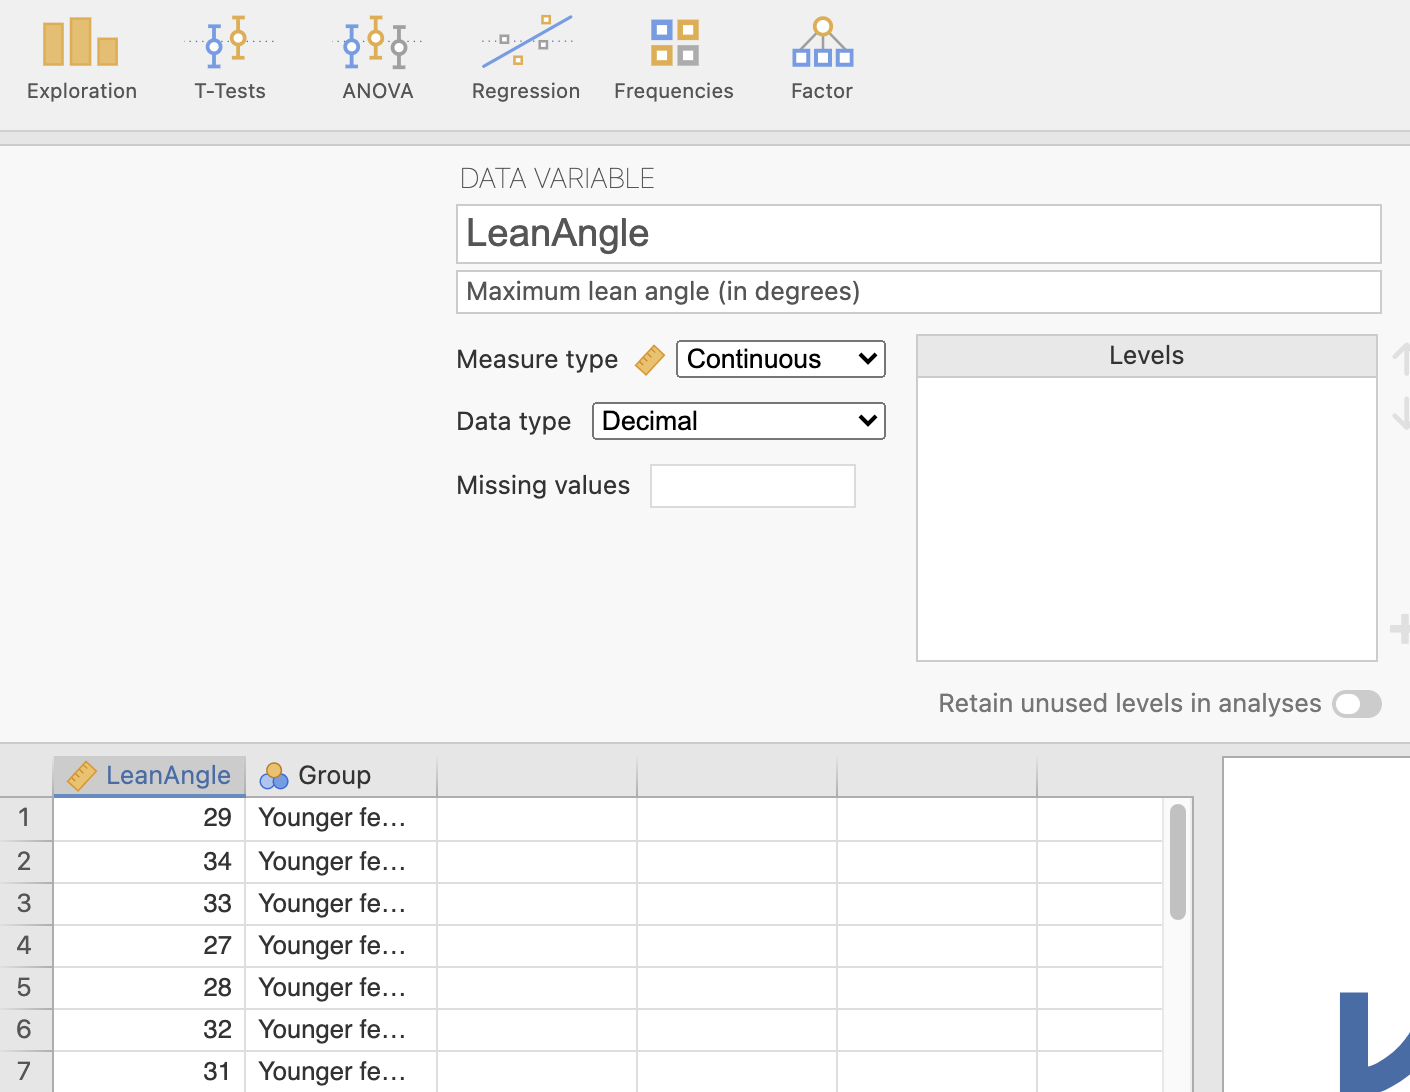
FIGURE 4.2: Describing the quantitative variable
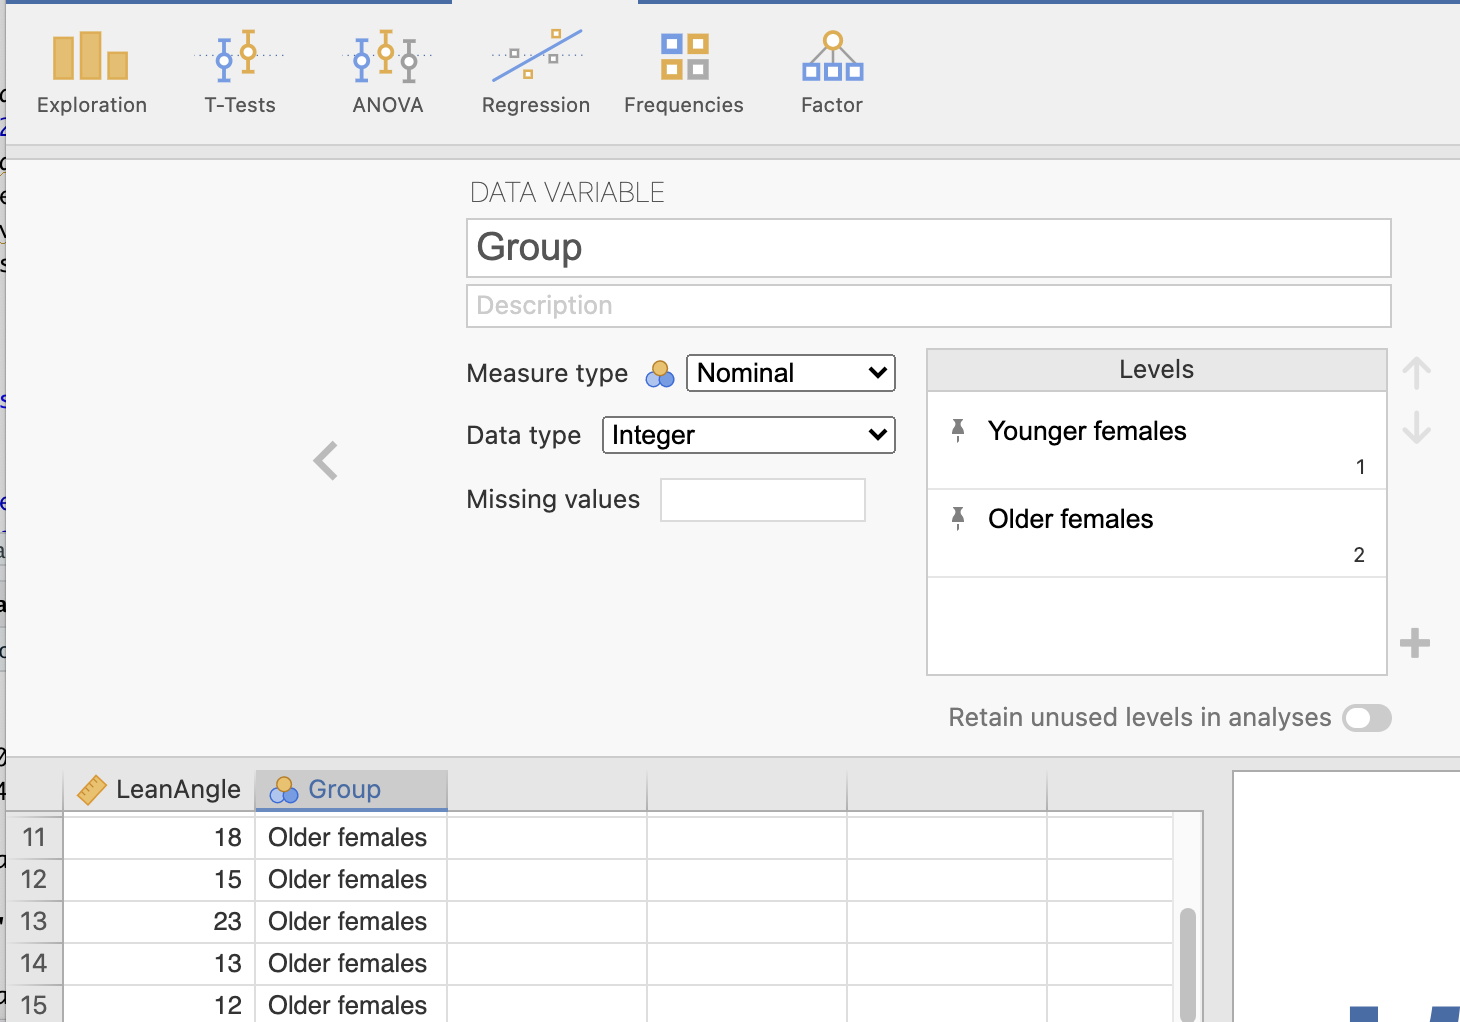
FIGURE 4.3: Describing the qualitative variable
The two age groups are defined so that a 1 represents younger women, and a 2 represents older women.
In the jamovi worksheet, the values 1 and 2 were entered, but jamovi shows what these mean in the worksheet when these values are defined.