7.3 Analysis
Once the data are entered, we can begin analysis:
Use the menu: select Analyze> Descriptive Statistics> Crosstabs…
Select the variables, dragging them from the left panel to the Row(s) and Column(s) areas as appropriate. In Table 7.1, Diet is in the rows of the table, for example. See Fig. 7.3.
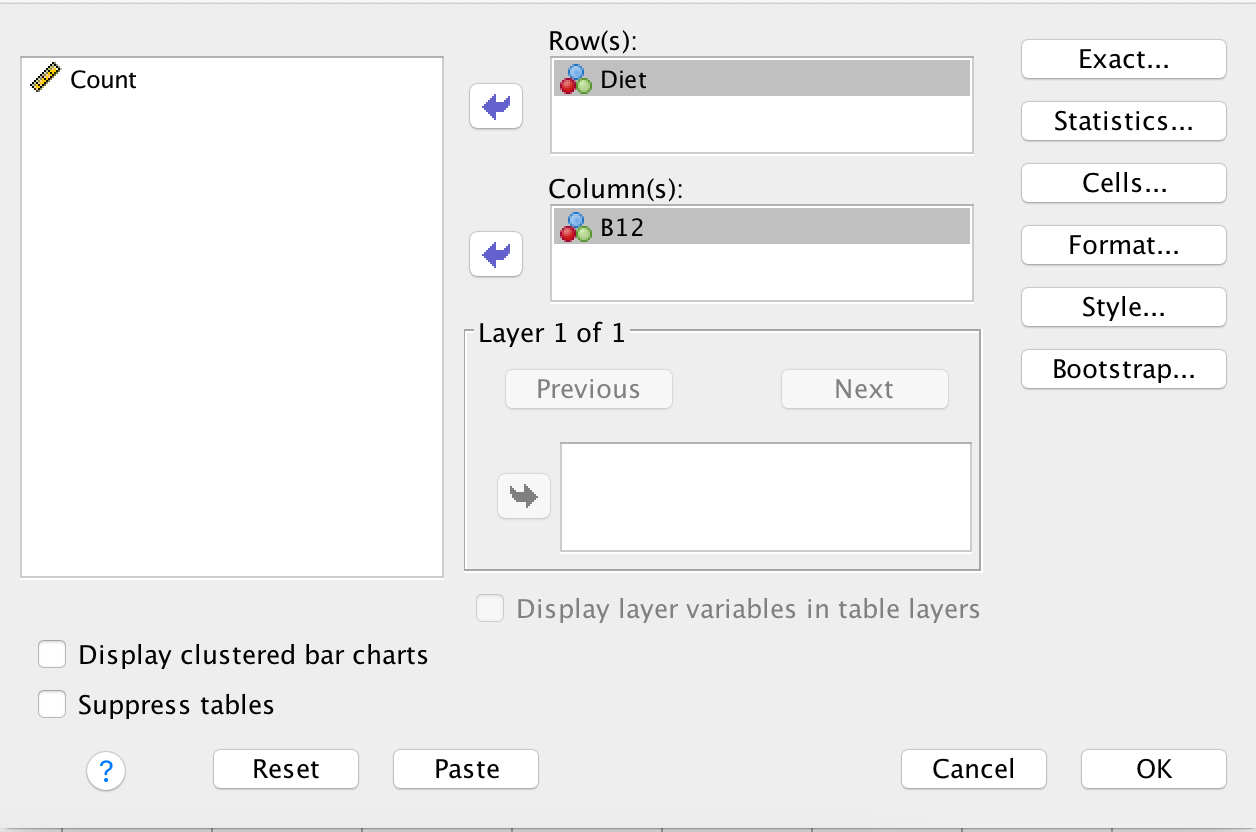
FIGURE 7.3: Add the variables
- Select the analysis options.
Click the Statistics… button, and then (Fig. 7.4):
- Select the Chi-square: to produce information for the hypothesis test.
- Select the Risk option: to produce a CI for the odds ratio.
- Press Continue, and then press OK. You will have your output in the SPSS Output window.
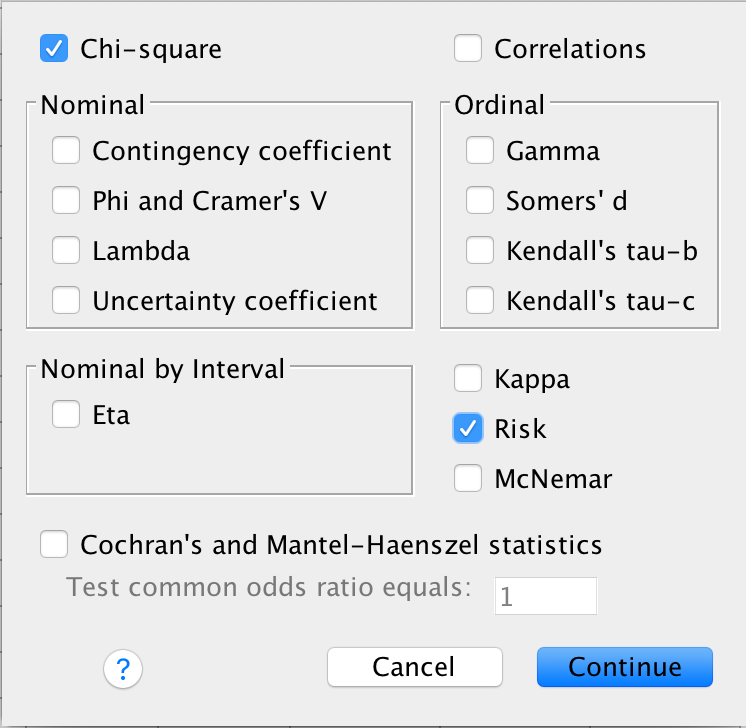
FIGURE 7.4: Select the options