3.3 Determining the number of factors
There are several methods for determining how many factors to retain. Researchers generally rely on the eigenvalues, scree plot or parallel analysis to determine how many factors to retain. These tools provide good results, but the researcher must ensure that these results are in sync with their research goals because the number of factors to retain can be affected by so many factors including the research questions and the theoretical framework.
3.3.1 Eigenvalues
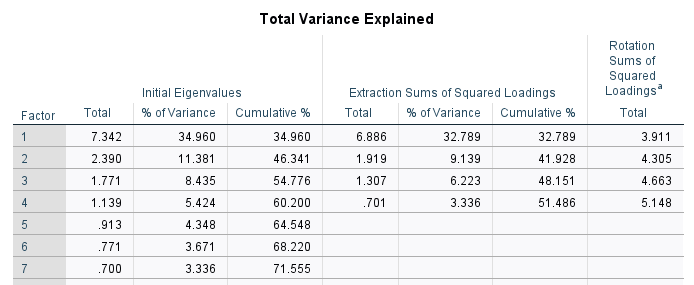
In factor analysis, eigenvalue refers to the amount of variance explained by a factor. It can be used to determine the number of factors to retain in a data set. In the literature, factors with eigenvalues greater than 1.0 should be retained (Zwick and Velicer 1986). In the figure below, the first 4 factors have eigenvalues greater than 1.0, so the researchers may decide to retain 6 factors.

3.3.2 Scree Plot
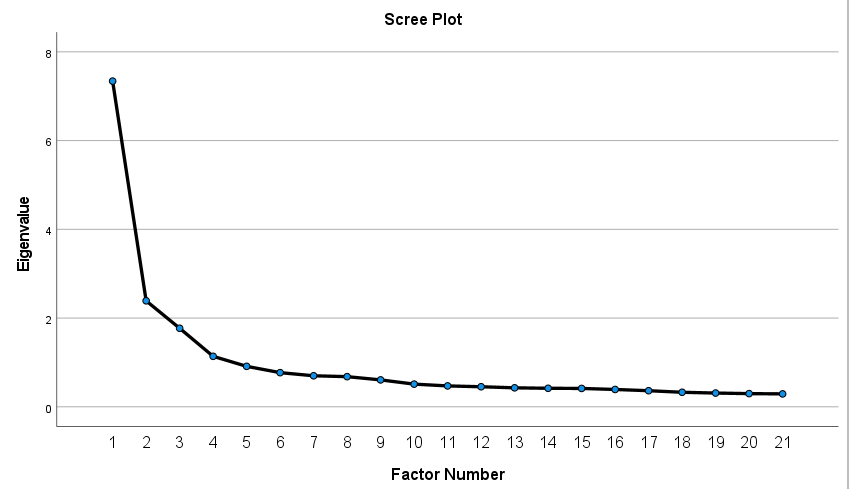
A Scree plot is a line plot of eigenvalues of factors (Cattell 1966). The plot displays the eigenvalues on the y-axis and the number of factors on the x-axis. To determine the number of factors to retain, look out for the point where the eigenvalue declines steeply and then levels off. The scree plot also confirms the number of factors we need to retain.

3.3.3 Parallel Analysis
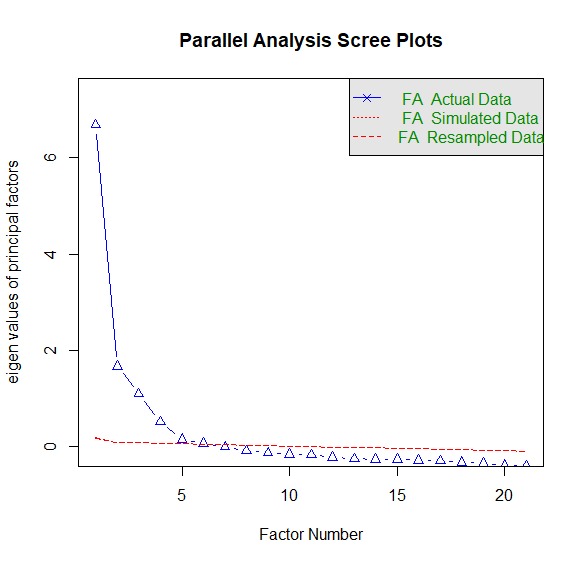
Parallel analysis is a simulation based method used to generate random data with characteristics similar to the observed data. Followed by comparing the eigenvalues extracted from the observed data to the simulated data; and retain factors with eigenvalues higher than the simulated data.
