5.10 Determining the number of factors
5.10.1 Eigenvalue extraction
In the code below, we extract the number of factors and the look out for eigenvalues greater than 1.0. This represents the number of factors to retain. The result suggests that the first four factors explained a variance of 7.342, 2.390, 1.771 and 1.139. That is, there are potentially four factors extracted.
##  [1] 7.3416040 2.3900377 1.7713990 1.1390345 0.9130607 0.7709799 0.7004687 0.6807159
##  [9] 0.6074946 0.5123275 0.4719282 0.4530524 0.4289491 0.4184769 0.4149503 0.3918409
## [17] 0.3637817 0.3284838 0.3110213 0.2983275 0.2920656
5.10.2 Scree Plot
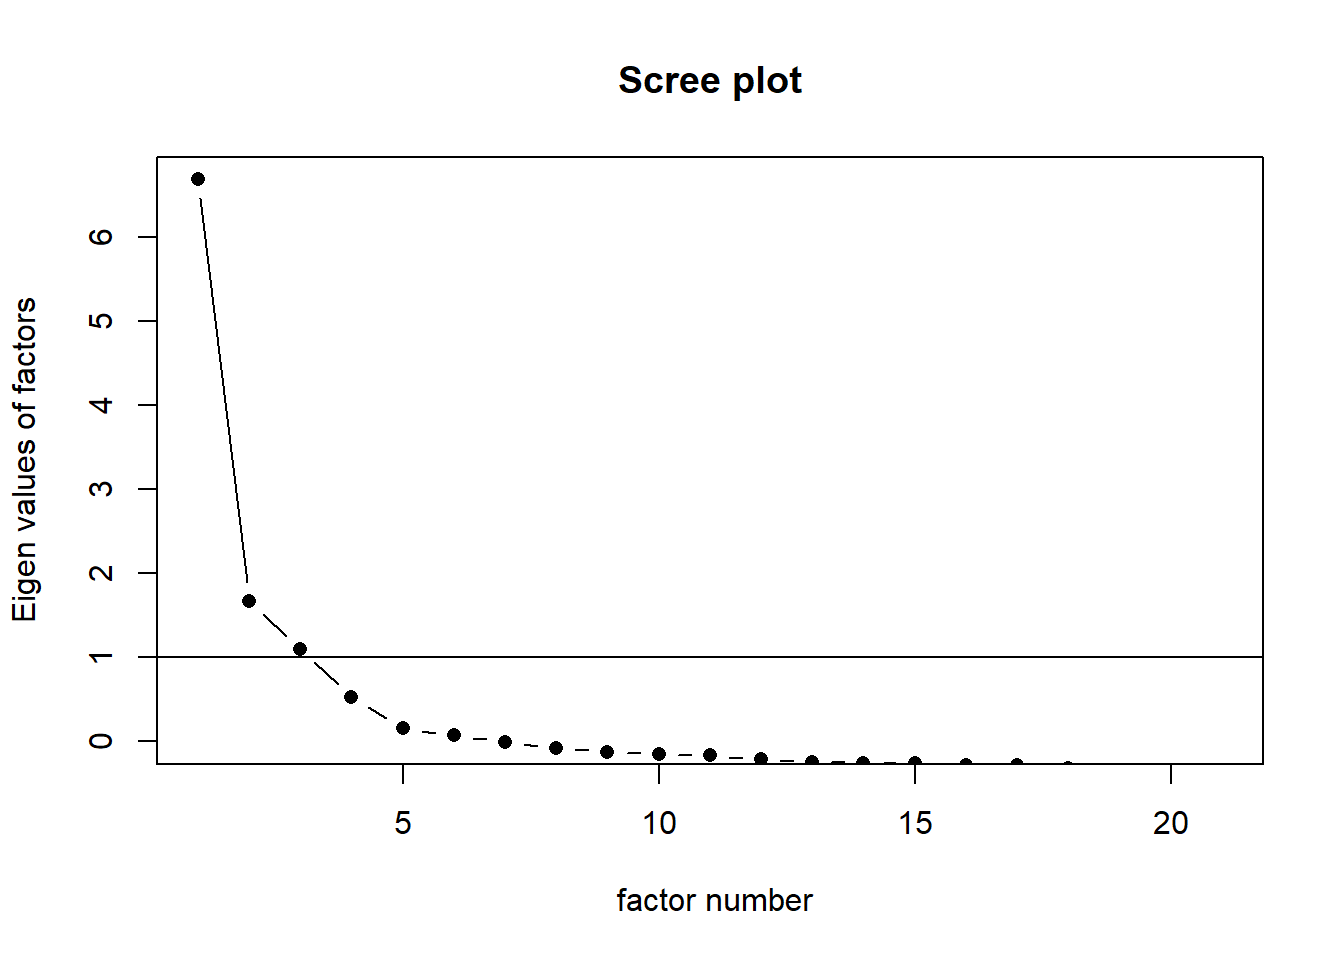
We can use the scree plot to further confirm the number of factors to retain. For the scree plot, look out for the point where the eigenvalue decline steeply and then levels off. From the scree plot, you will noticed that if we consider eigenvalue of 1.0, only three factors will be retained. However, if we consider the point where the eigenvalue levels off, four factors can be retained.