12 Match the unmatched
12.0.1 Introduction
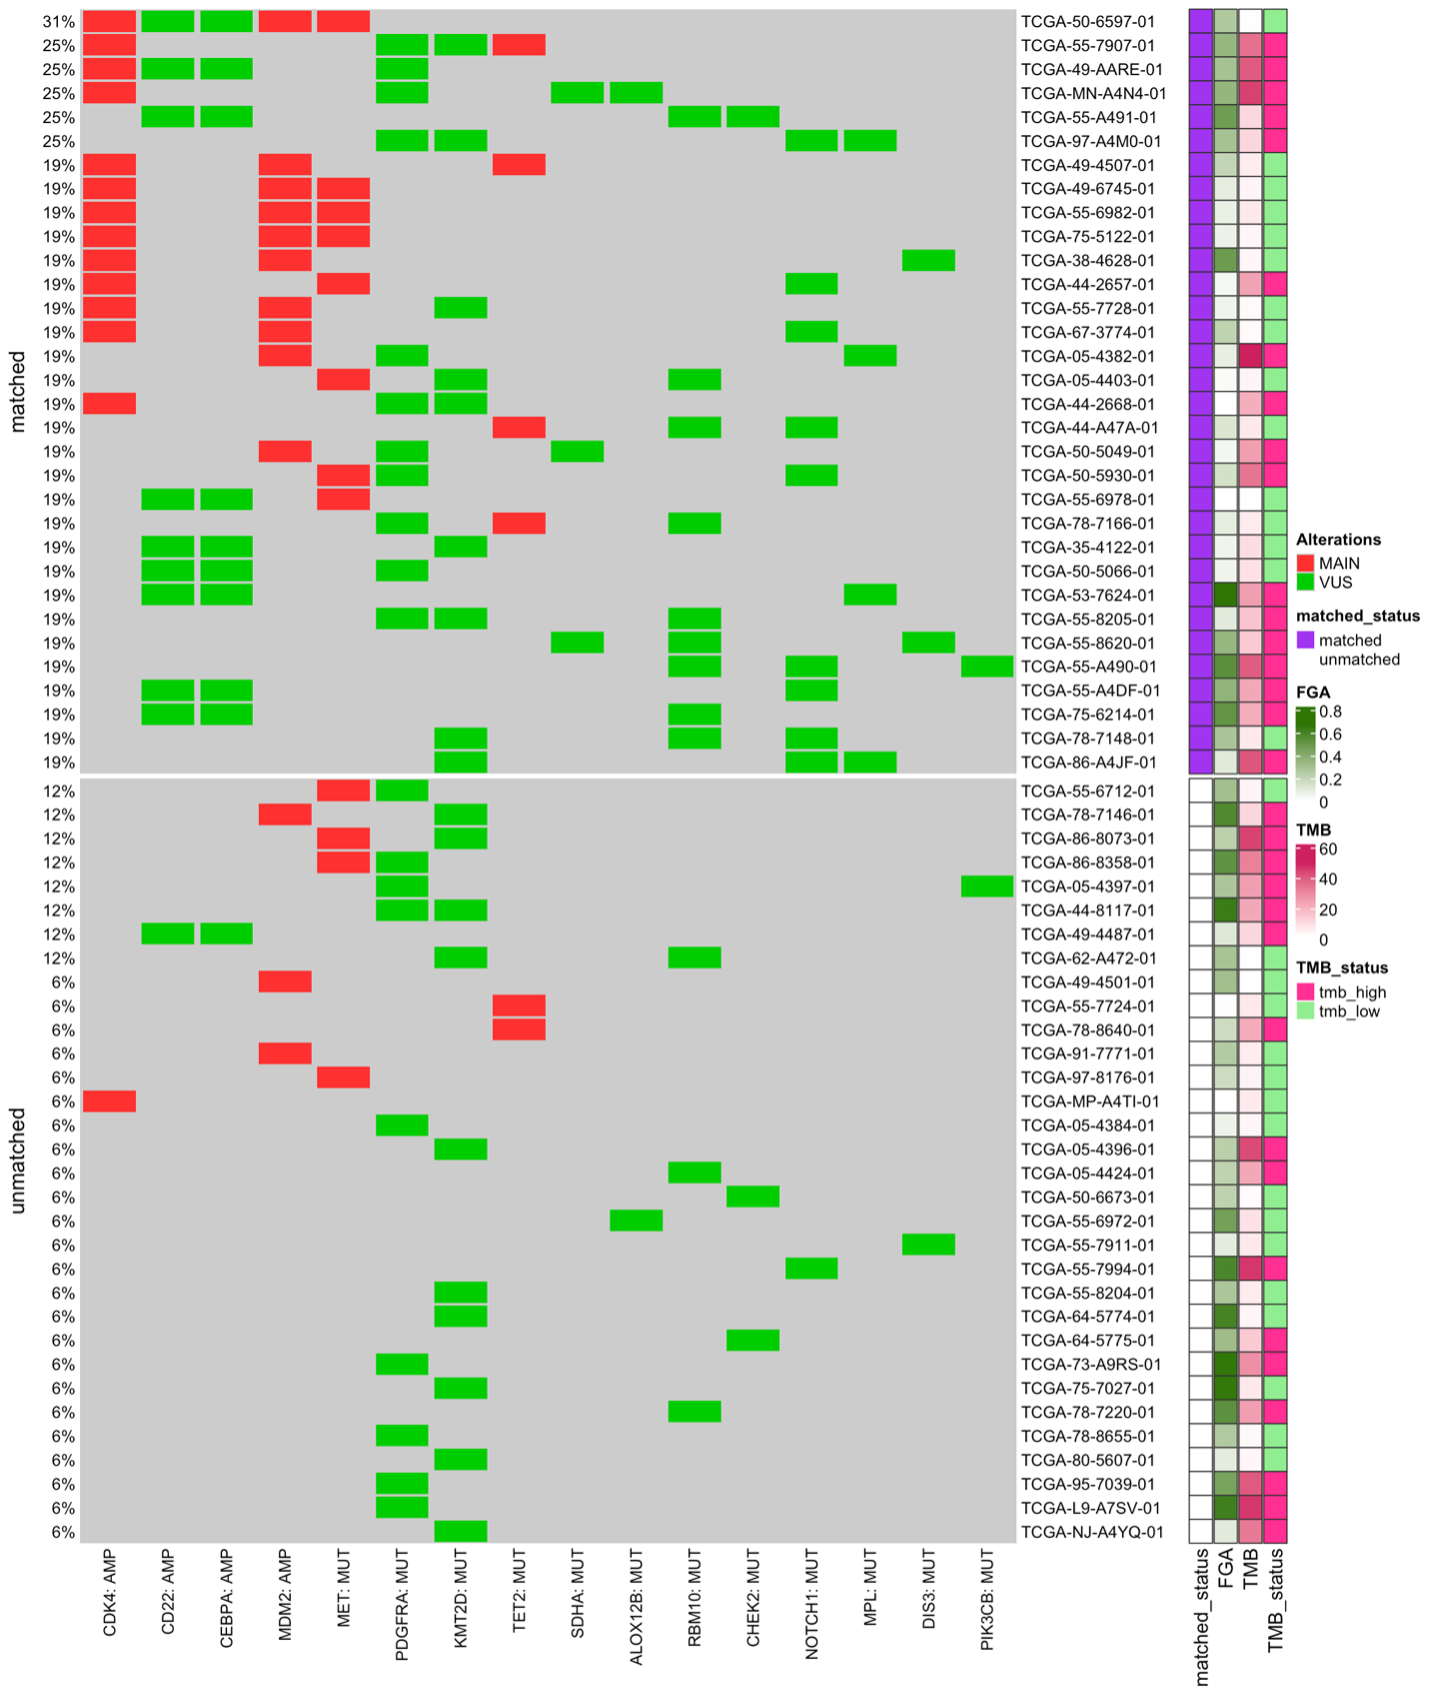
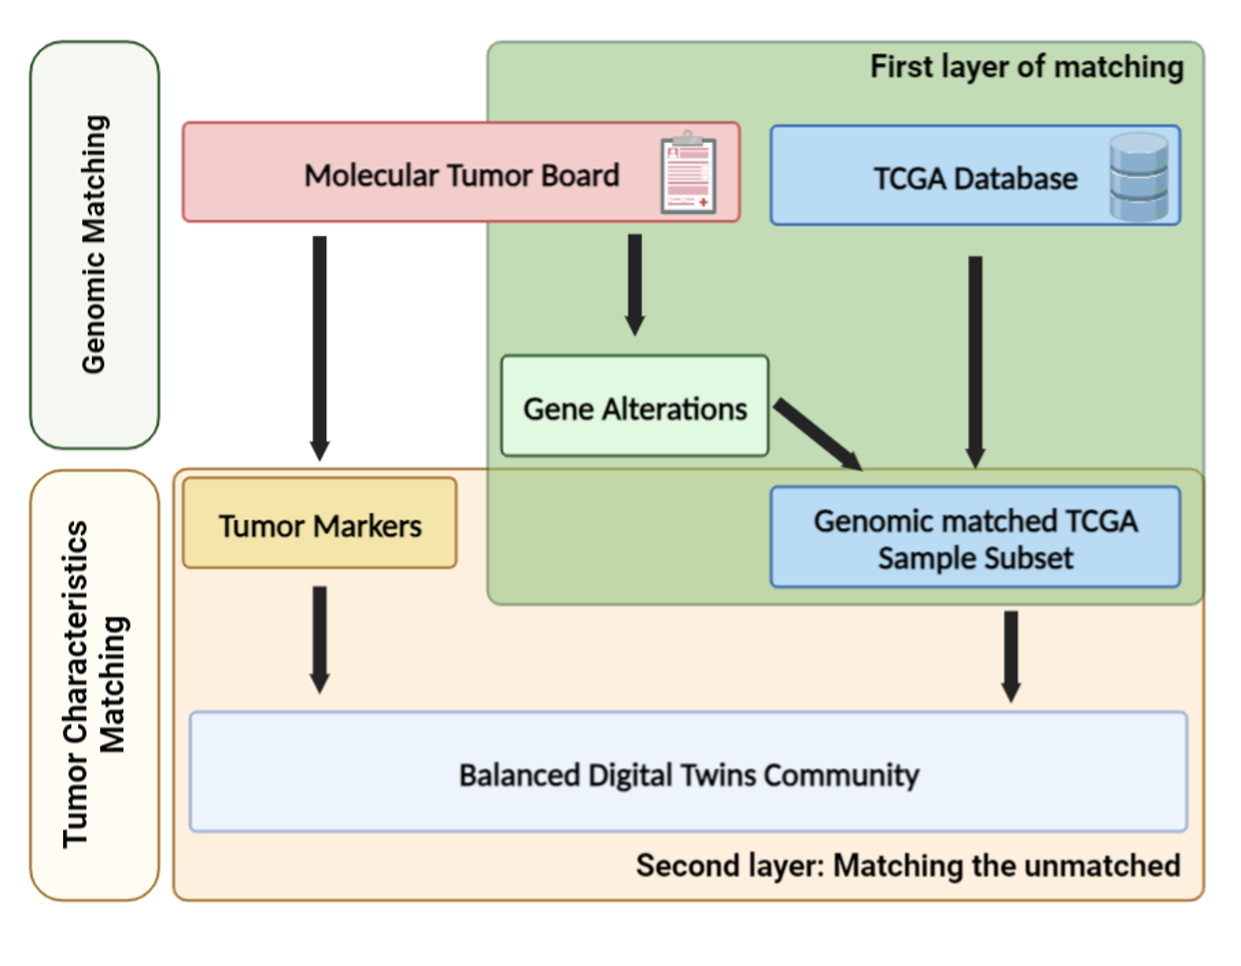
The matching model has two layers. The first separates the sample into “the matched” and “the unmatched” group. The second layer further subsets samples from the “unmatched” that have similar tumor characteristic to “the matched”.
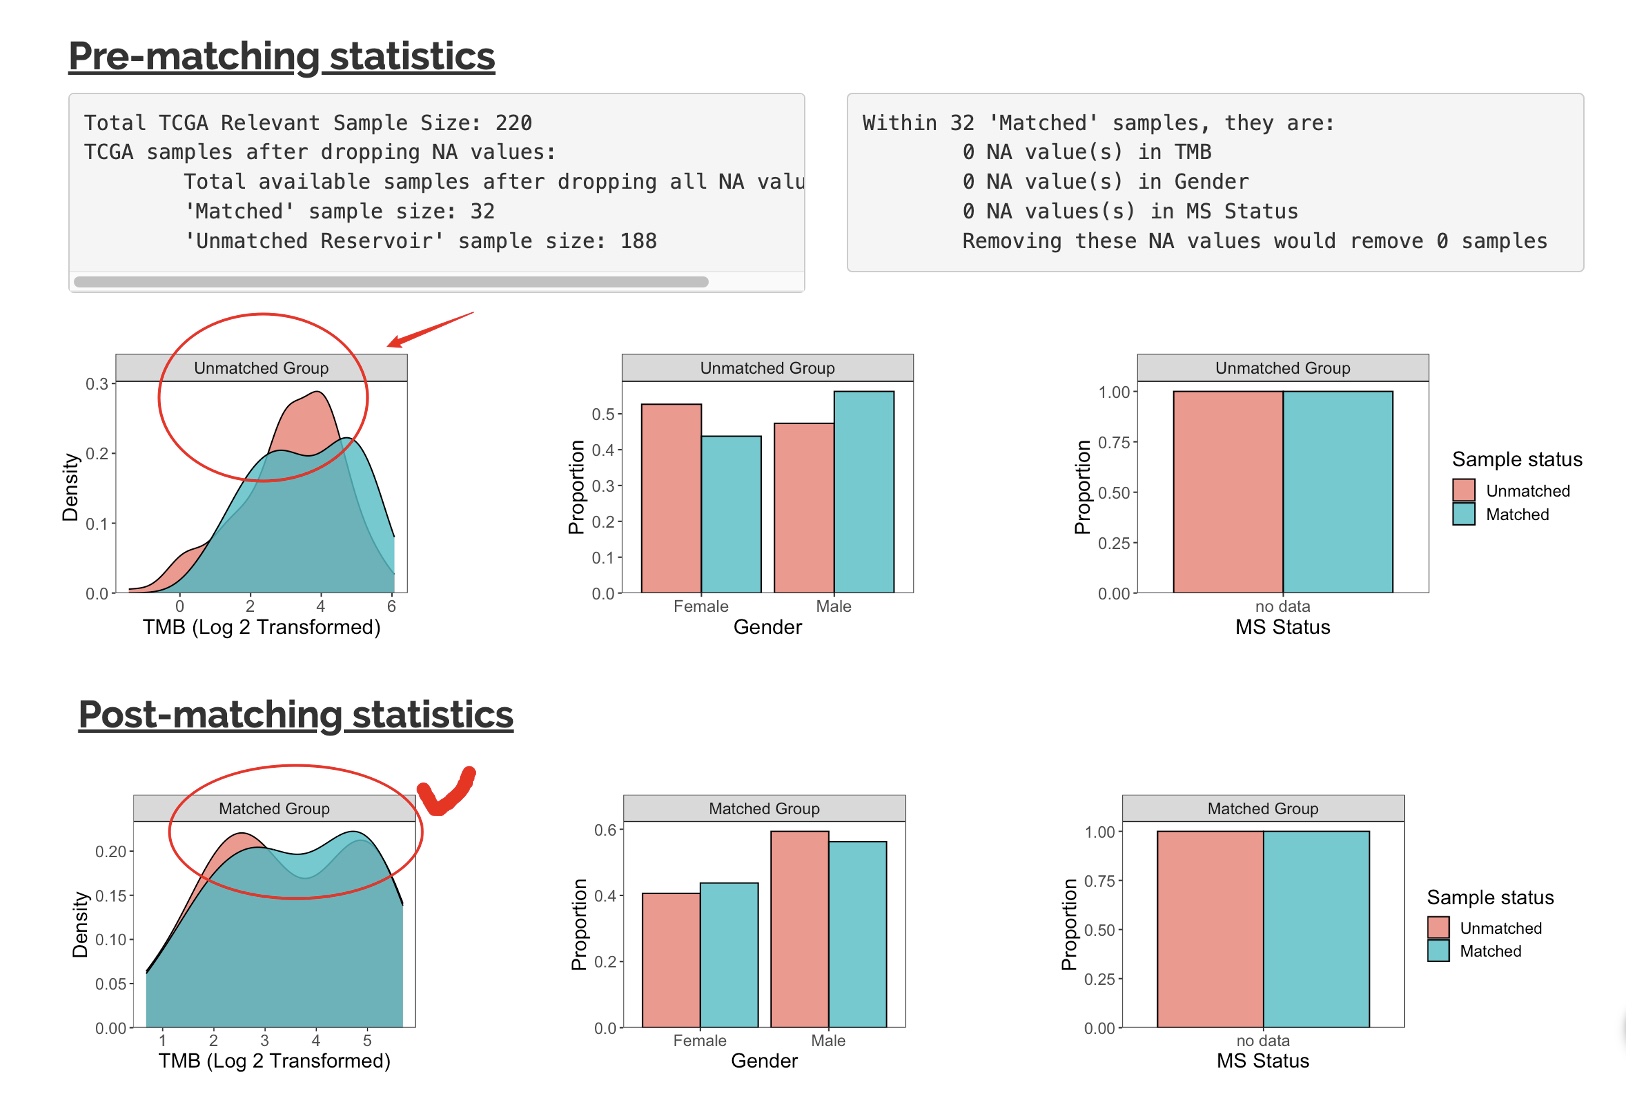
We performed Propensity Score Matching to select the “unmatched” patients from the patient dataset that best match to the “matched” group. Users can choose to perform this analysis based on Gender, Microsatellite status, and Tumor Mutational Burden (TMB). We use logistic regression to calculate propensity score with the optimal matching method.
12.0.2 How to start
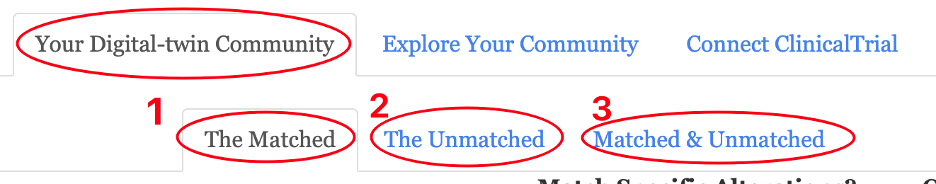
Under the “Your Digital-twin community” tab, it includes three sub tabs: - The matched: Matched digital twin - The Unmatched: Match the unmatched samples with the matched samples so they have similar number and feature distribution. - Match and Unmatched: The summary total samples involved in matching.