10 Explore your community
10.1 TCGA Specific
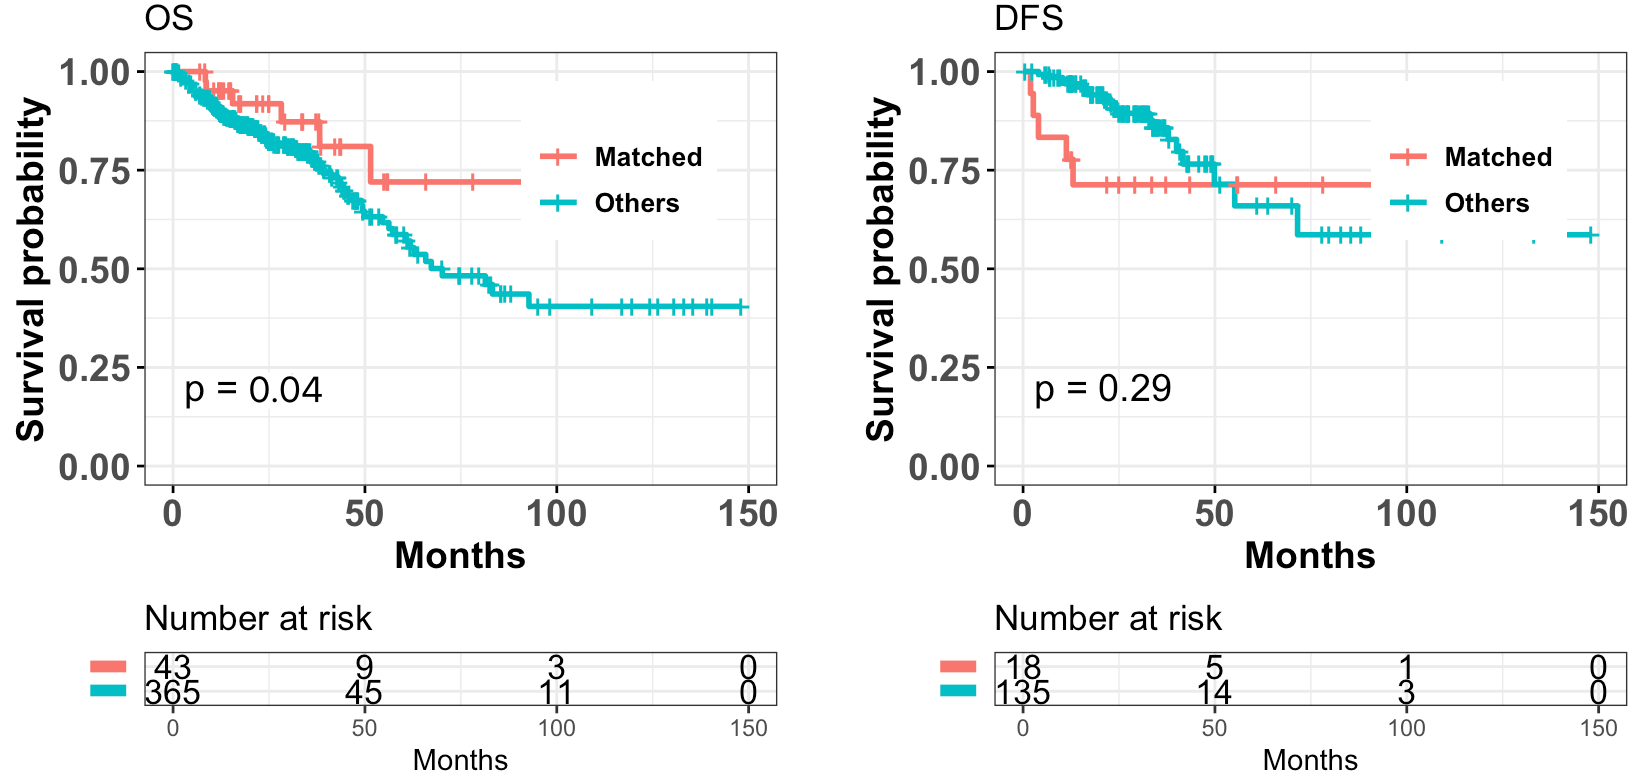
10.1.1 Survival
The survival data includes:
Overall Survival (OS)
Disease-free Survival (DFS)
Example:
10.1.2 TME
This module compares immune abundance between “matched” and “unmatched” groups. It provides two data sources:
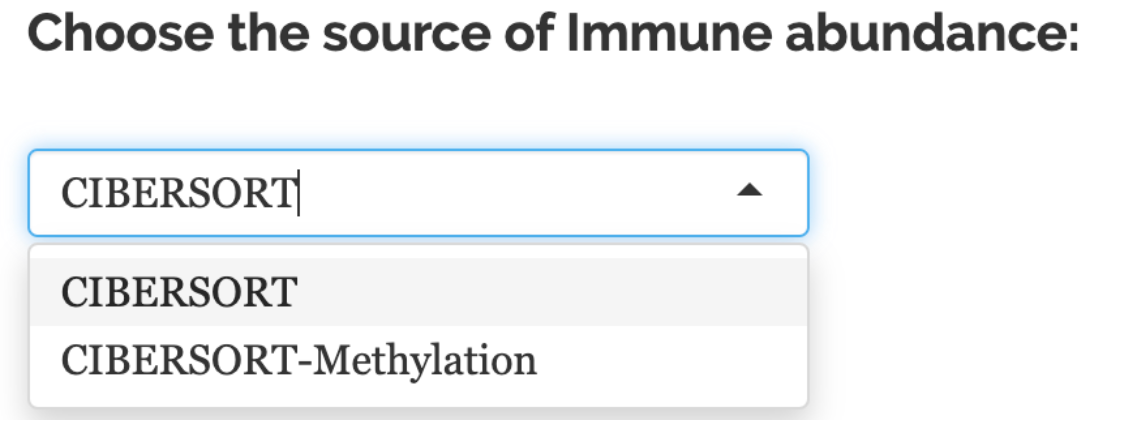
DNA methylation-based deconvolution (methylCIBERSORT, (Chakravarthy et al. 2018)): 9 cell types
Expression-based Immune abundance (CIBERSORT, (Thorsson et al. 2018)): 22 cell types
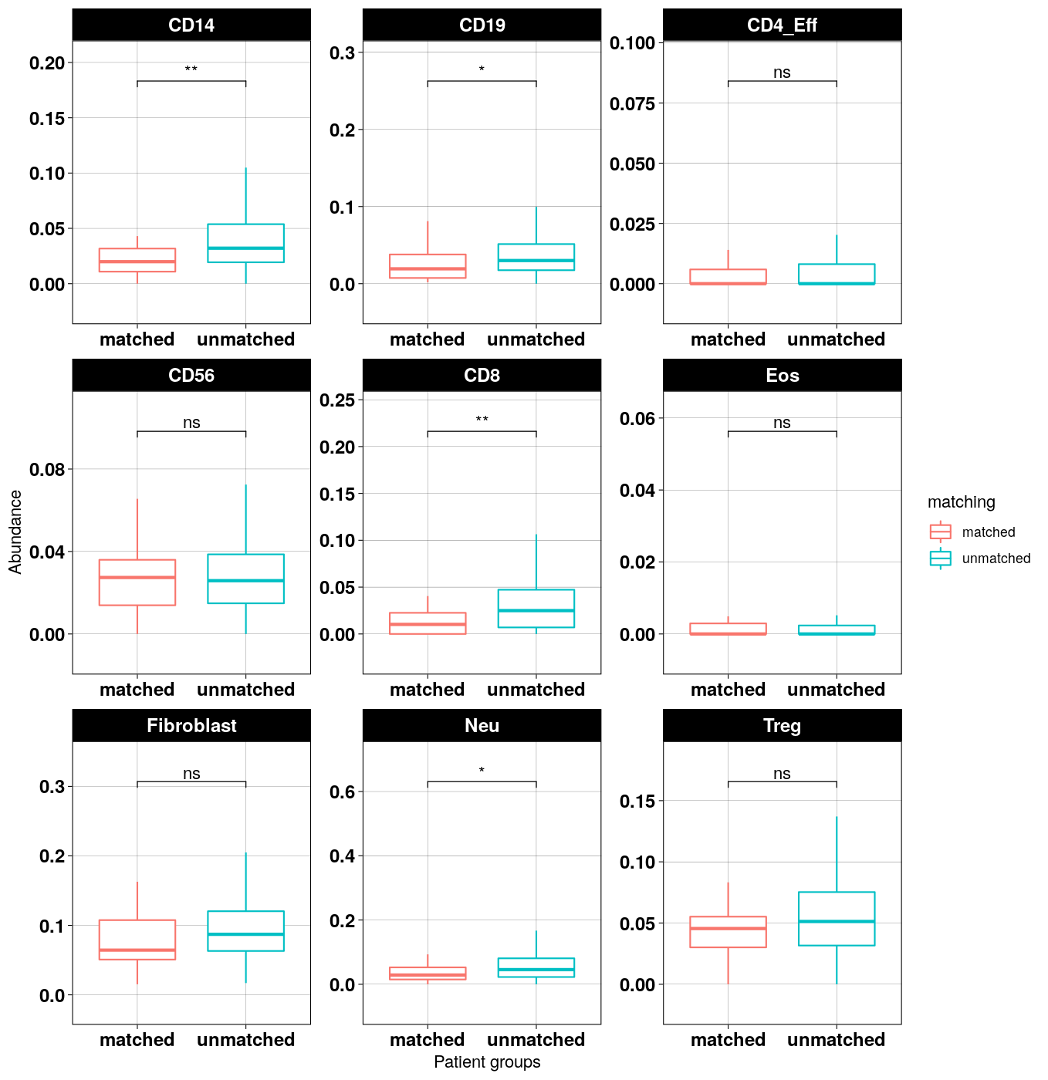
Note:
Matched: samples with high percent matched profiles in "Profile connecting" module; (thresholds can be set by users)Unmatched: samples with low percent matched profiles.
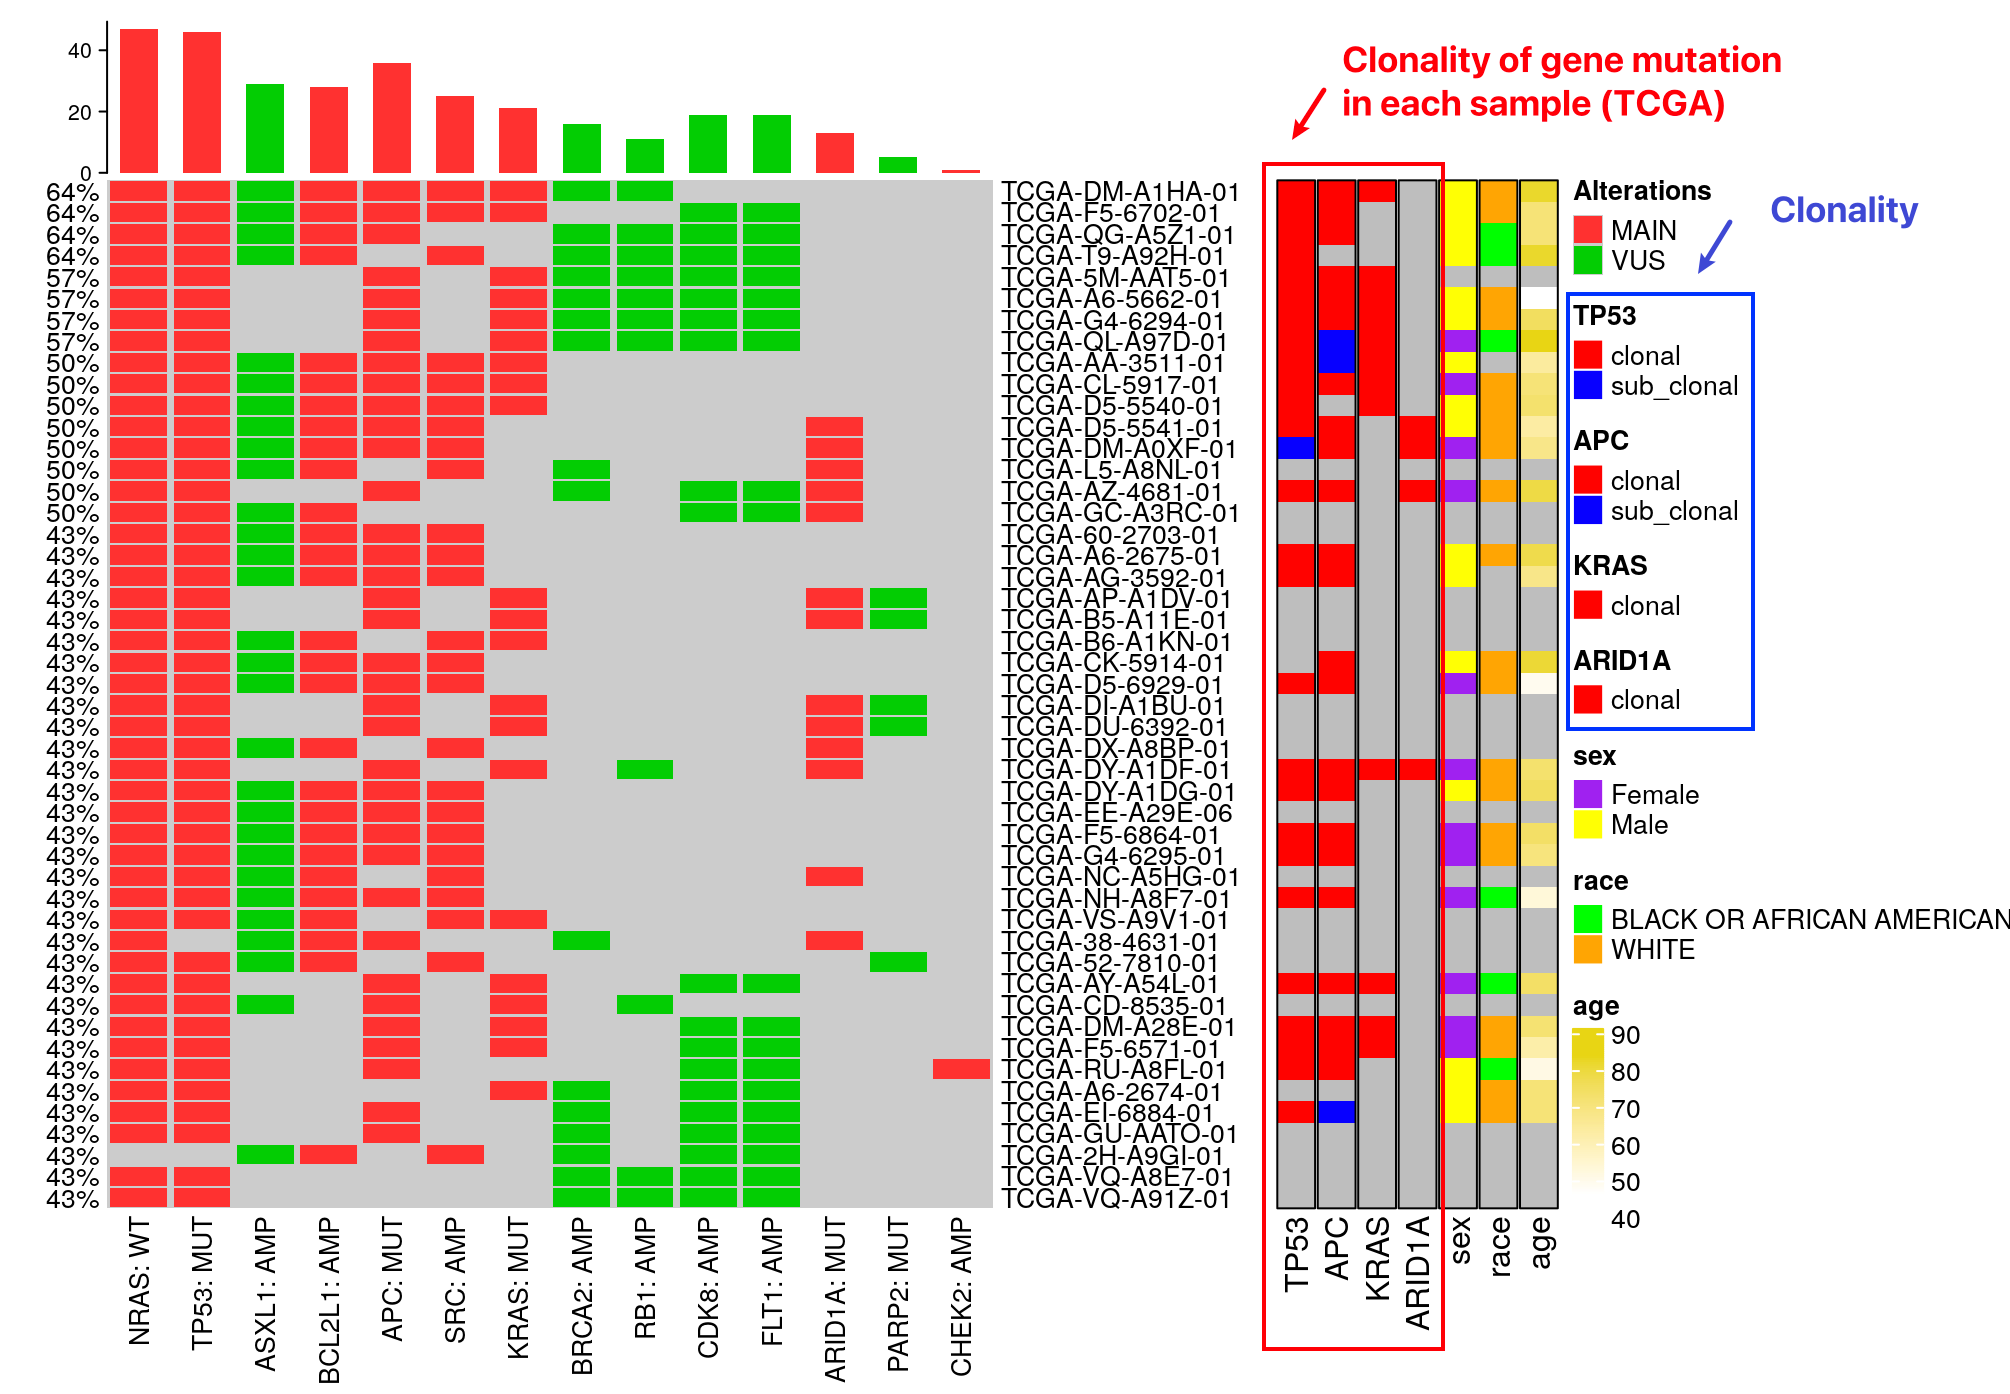
10.1.3 Mutation methylation burden
The mutation methylation (MM) clonality (Kowalski et al. 2022) workflow for gene mutation assignment as clonal versus subclonal is developed by the Kowalski lab. It’s a methylation-based method integrating with variant read counts from mutation data.
The introduction of a methylation-based mutation clonality marker could prove invaluable when used in combination with methylation-based circulating tumor DNA assays for patient and treatment selection and clinical trial monitoring of tumor responses.
Kowalski, J., Xu, Q., Chao, H.P., Gandhi, H., Aung, K.L. and Matsui, W.H., 2022. KRAS mutation methylation clonality in early-stage pancreatic cancer.
Among those top-connected samples, this module provides methylation-based clonality predictions of altered genes in each TCGA sample.
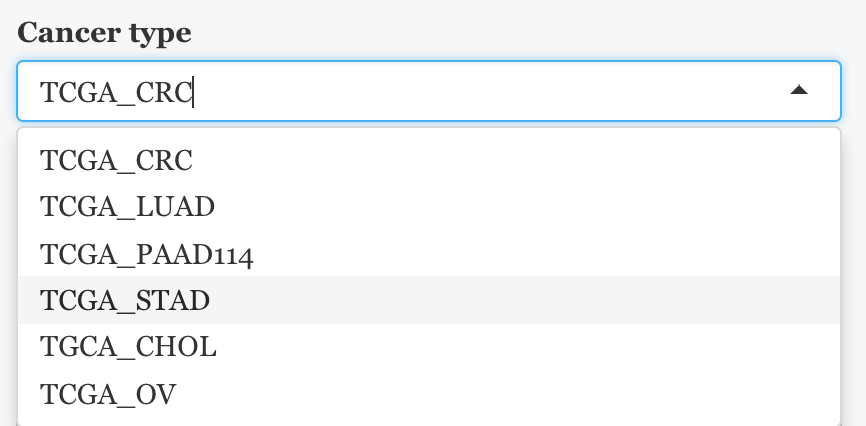
10.1.3.1 Cancer types
Currently, this workflow has been implemented on six cancer sites of origin (colorectal, lung, pancreatic, stomach, Cholangiocarcinoma, and ovarian).
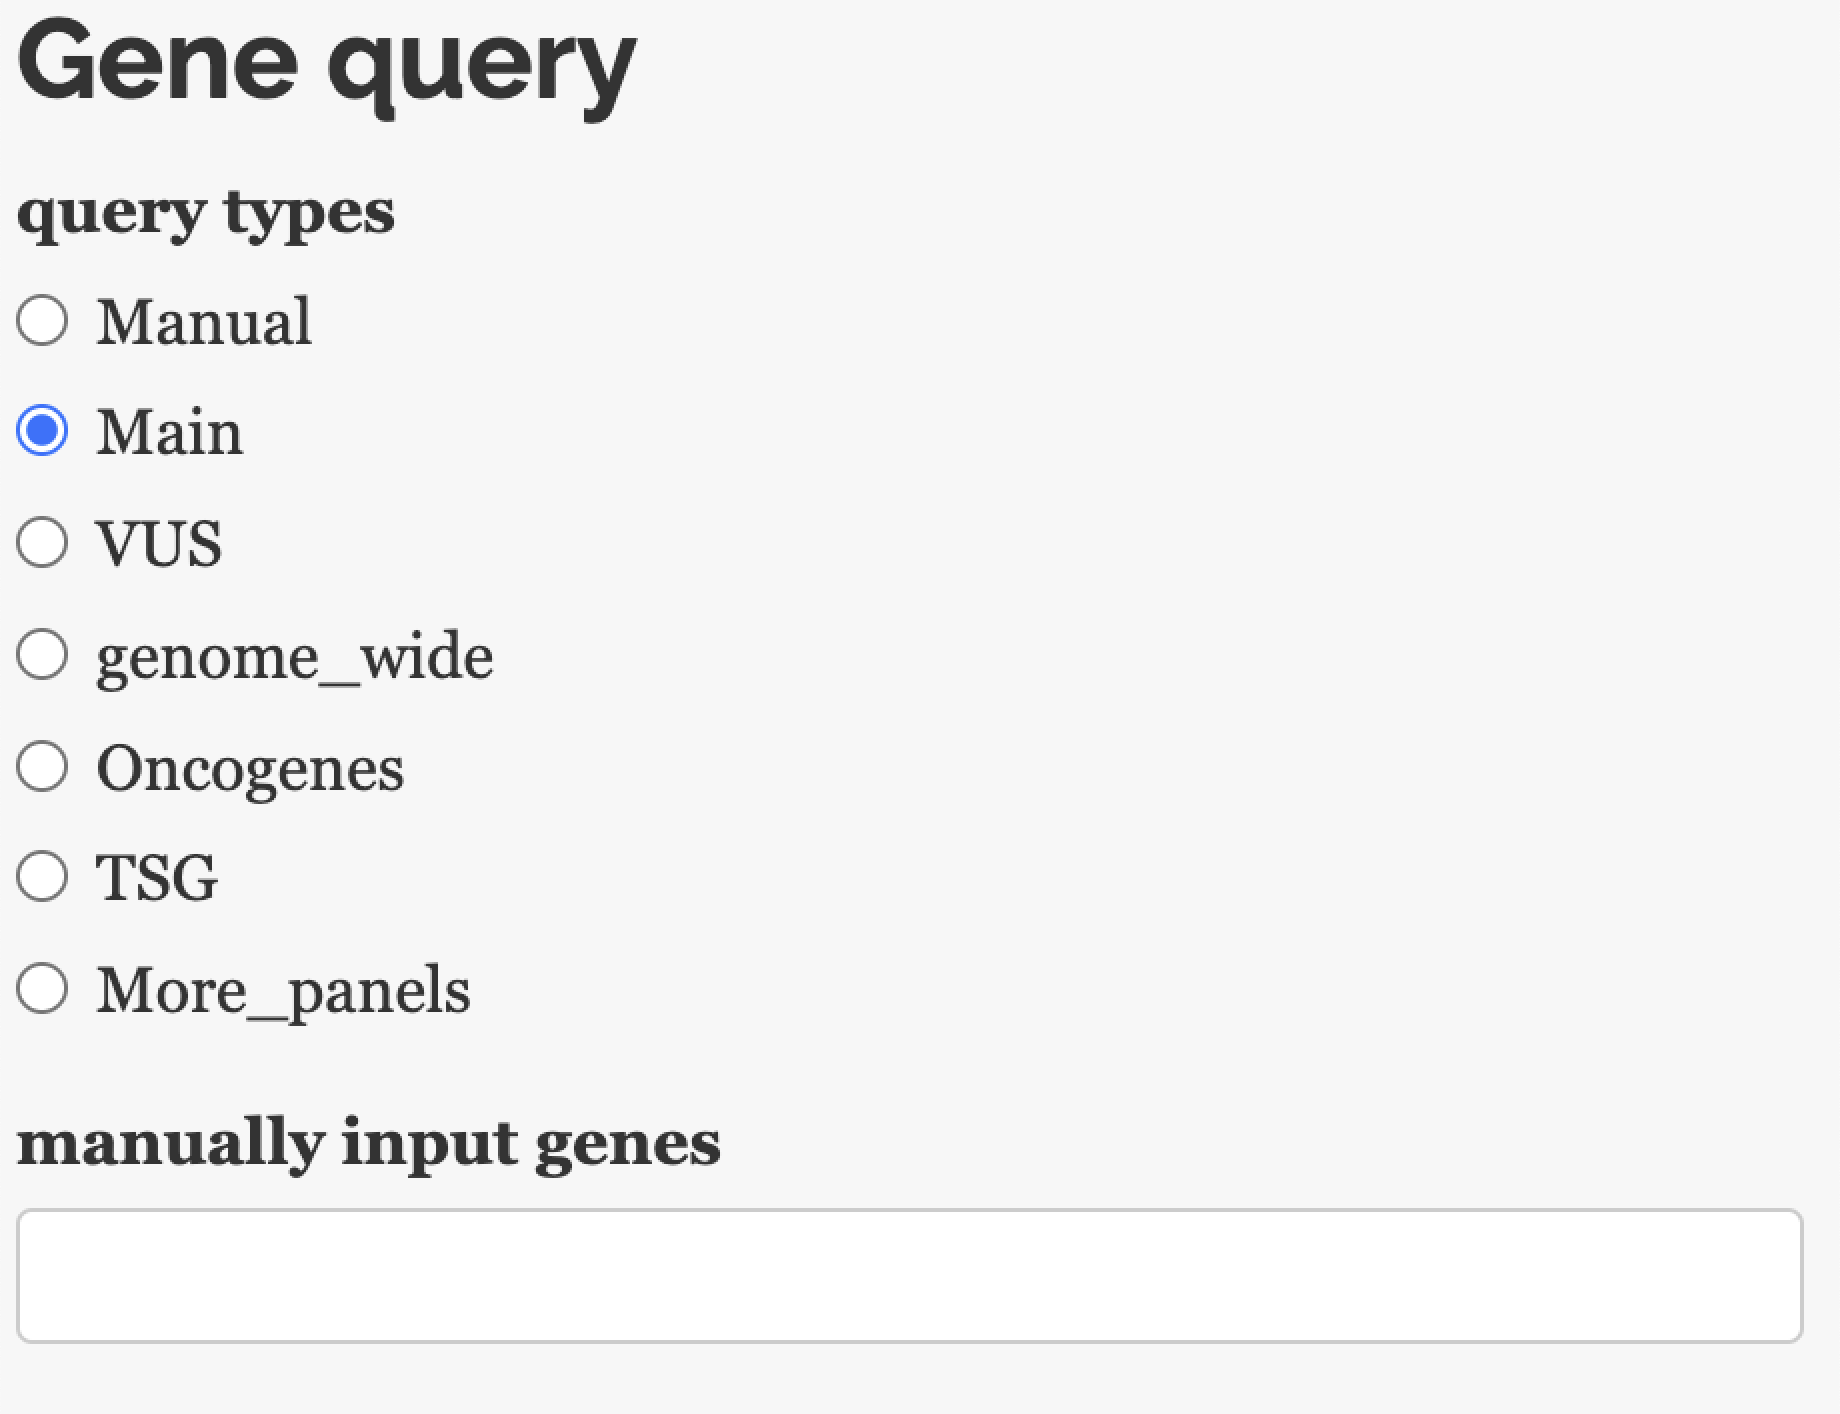
10.1.3.2 Manually query genes
Since it’s impossible to list clonality for all genes in one heatmap, users can query for any interested genes manually. We also provide several options for easy selection under typical circumstances.
For query genes, there are several options:
Main/VUS gene from the report
Genome-wide
Gene panel (pre-loaded or uploaded by user)
Manually input genes name for a query.
Note: Users can choose to show Top N clonal or sub-clonal genes among the gene set they query for clonality.
When there are too many genes as inputs, the app allows visualization of genes only with high-prevalence clonality or sub-clonality.
10.2 CCLE Specific
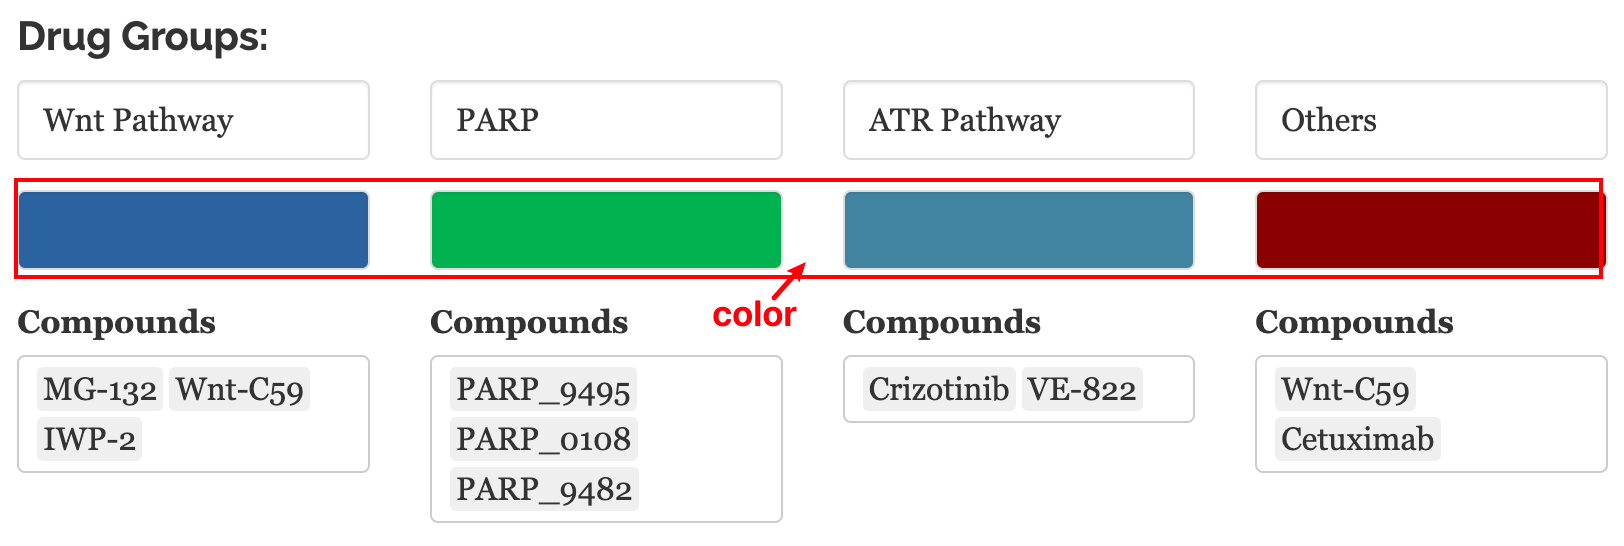
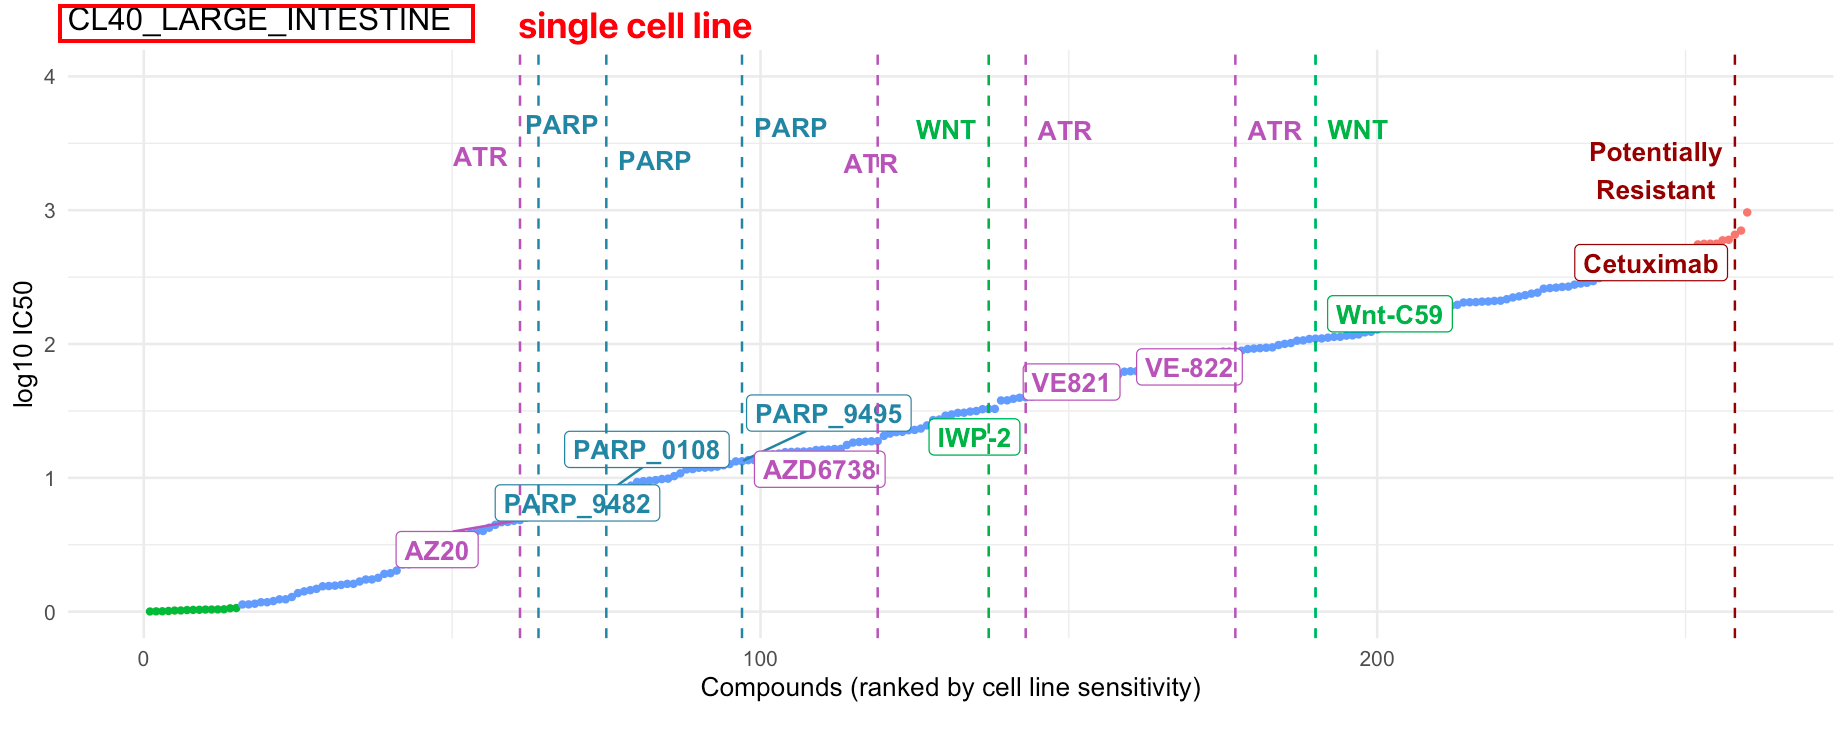
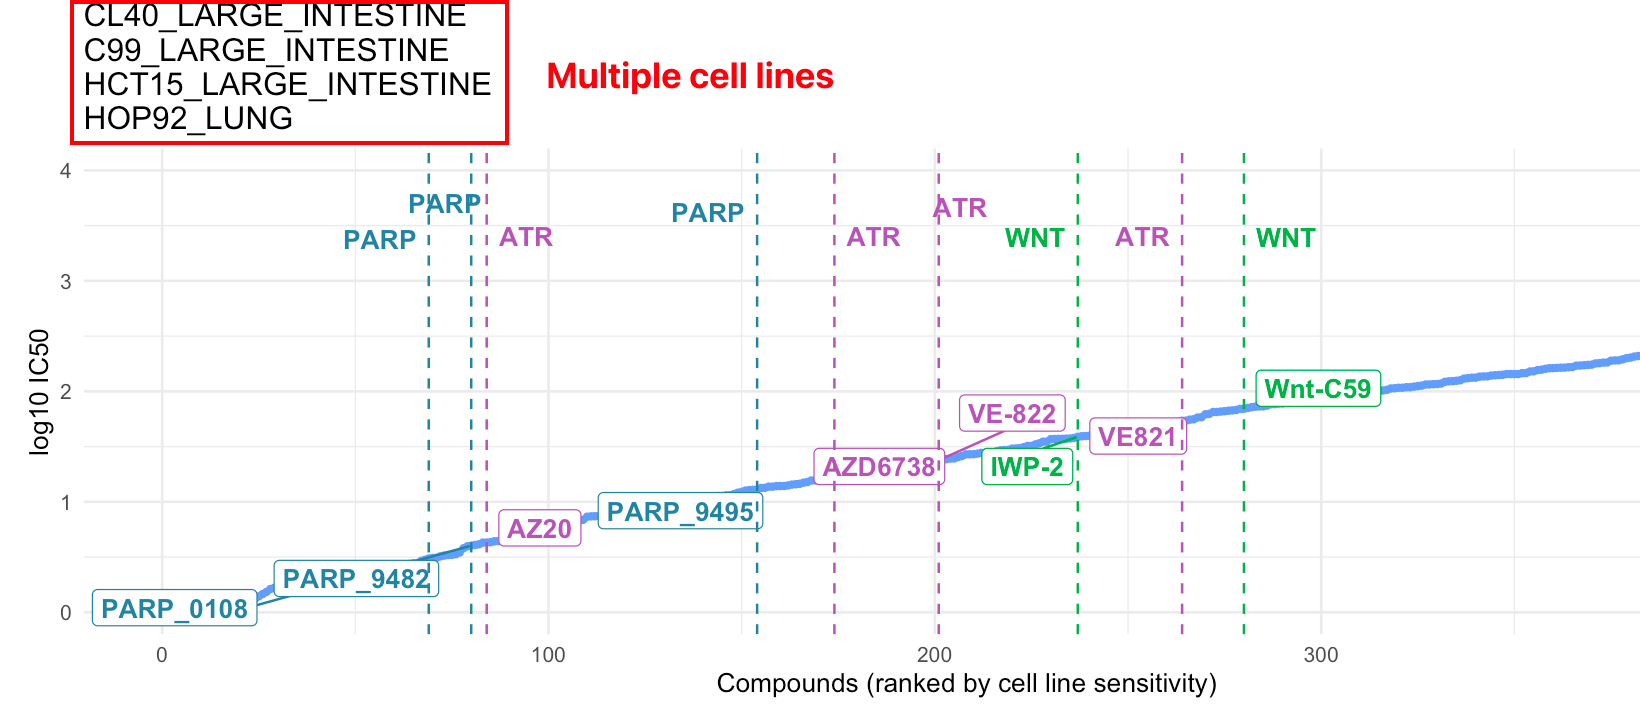
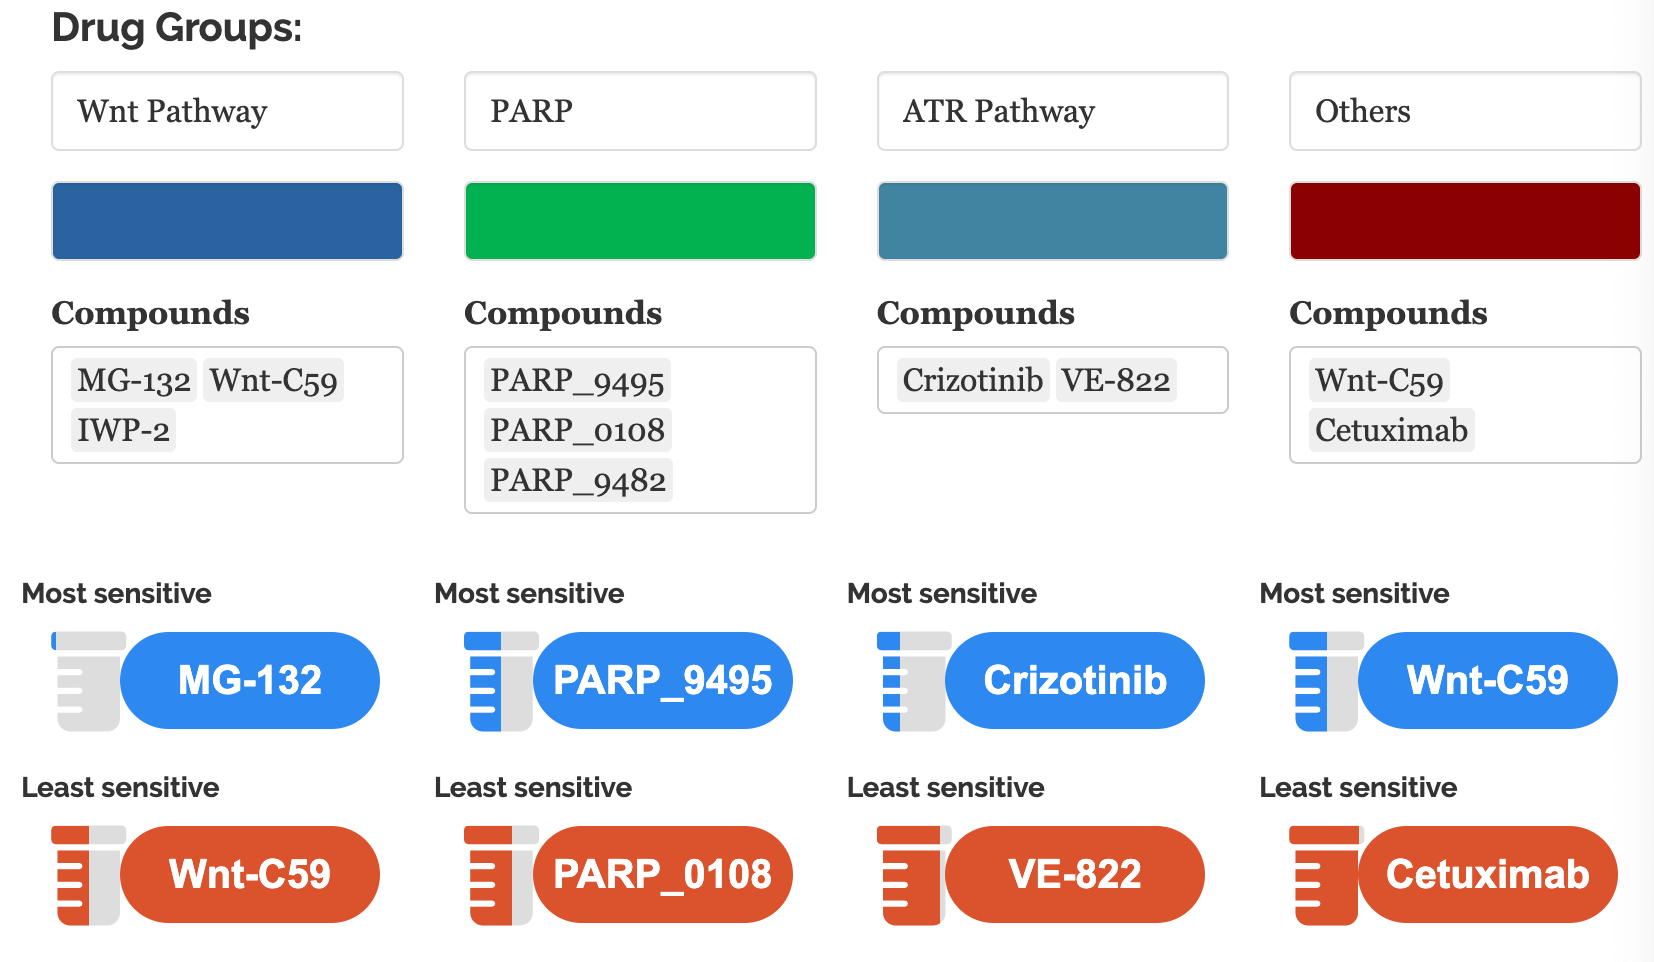
10.2.1 Drug sensitivity
In this module, we provide our innovative in-house visualization for IC50 data (Yang et al. 2012) to query drug sensitivities for user-defined cell lines.
10.2.1.1 Input
Cell line names: Users can query the IC50 of one or multiple cell lines in the change point plots.
Compounds: Drug names and drug groups (pathway, inhibitor, etc.)
10.3 Common in TCGA/CCLE
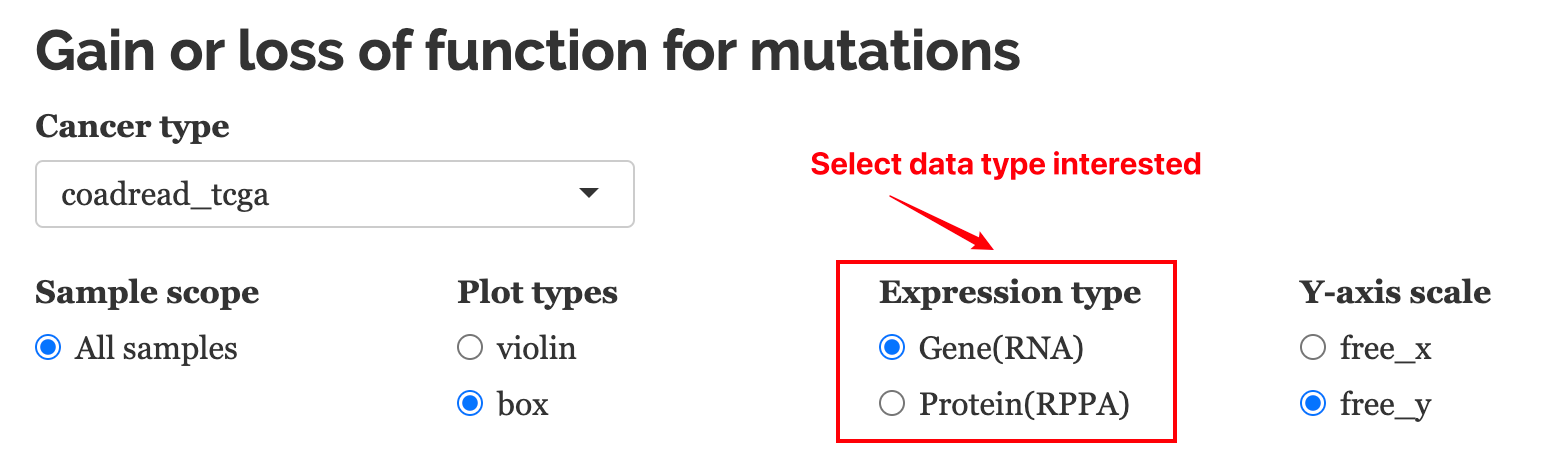
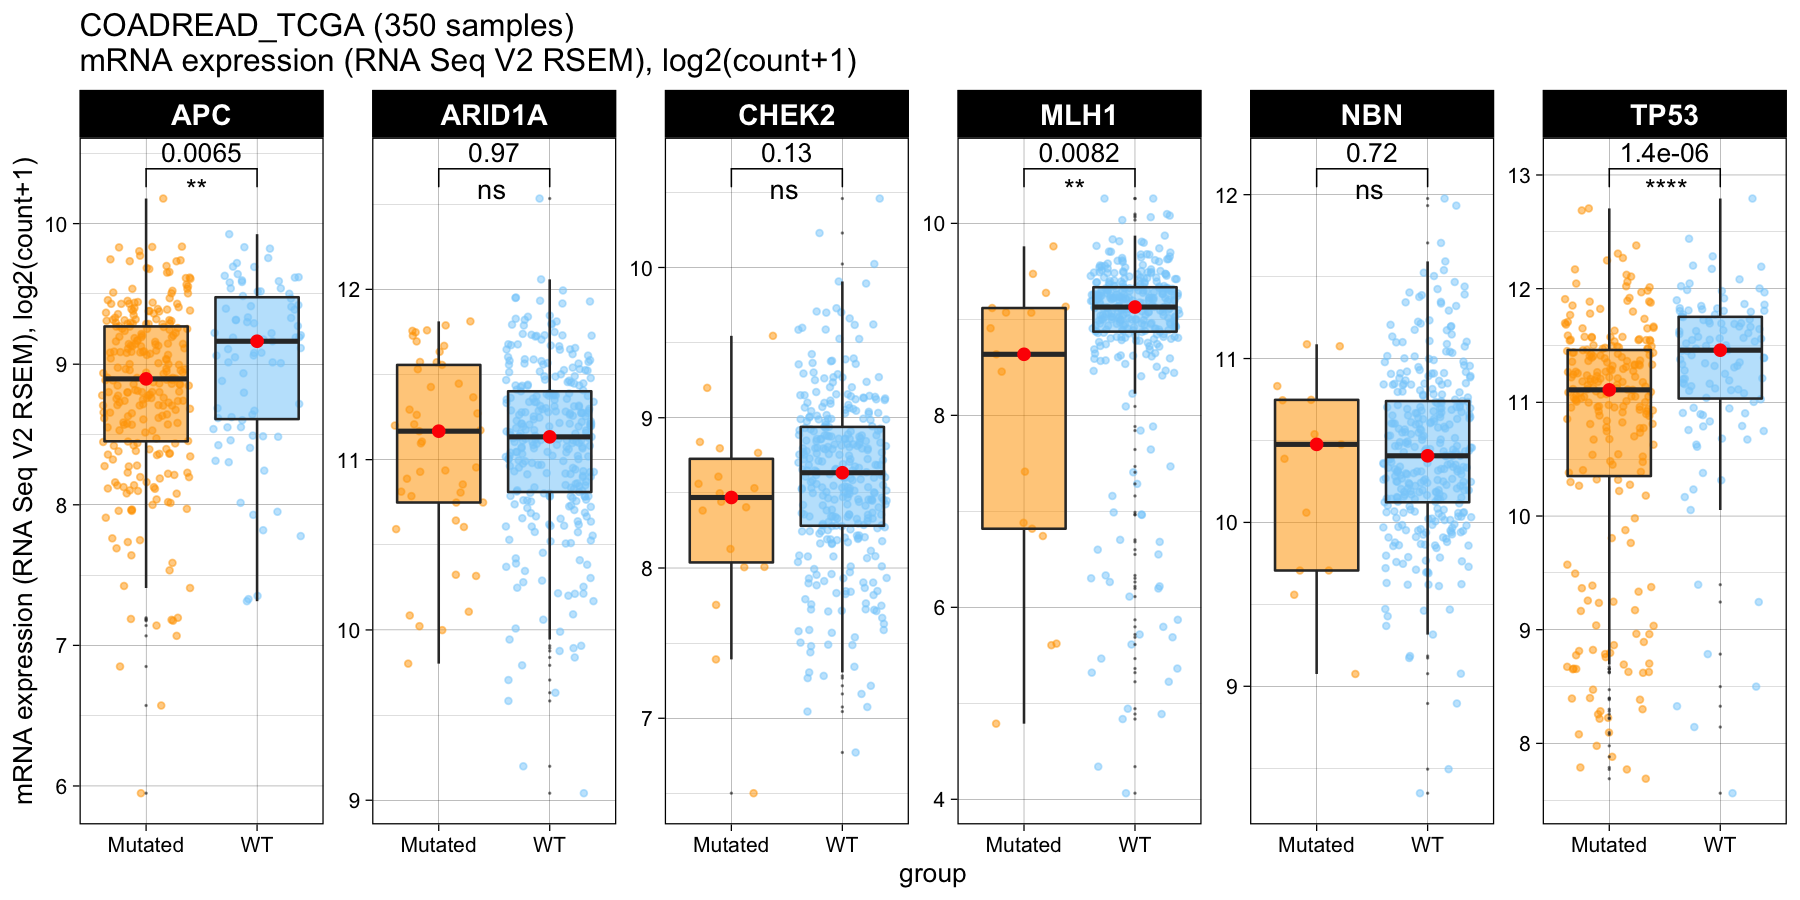
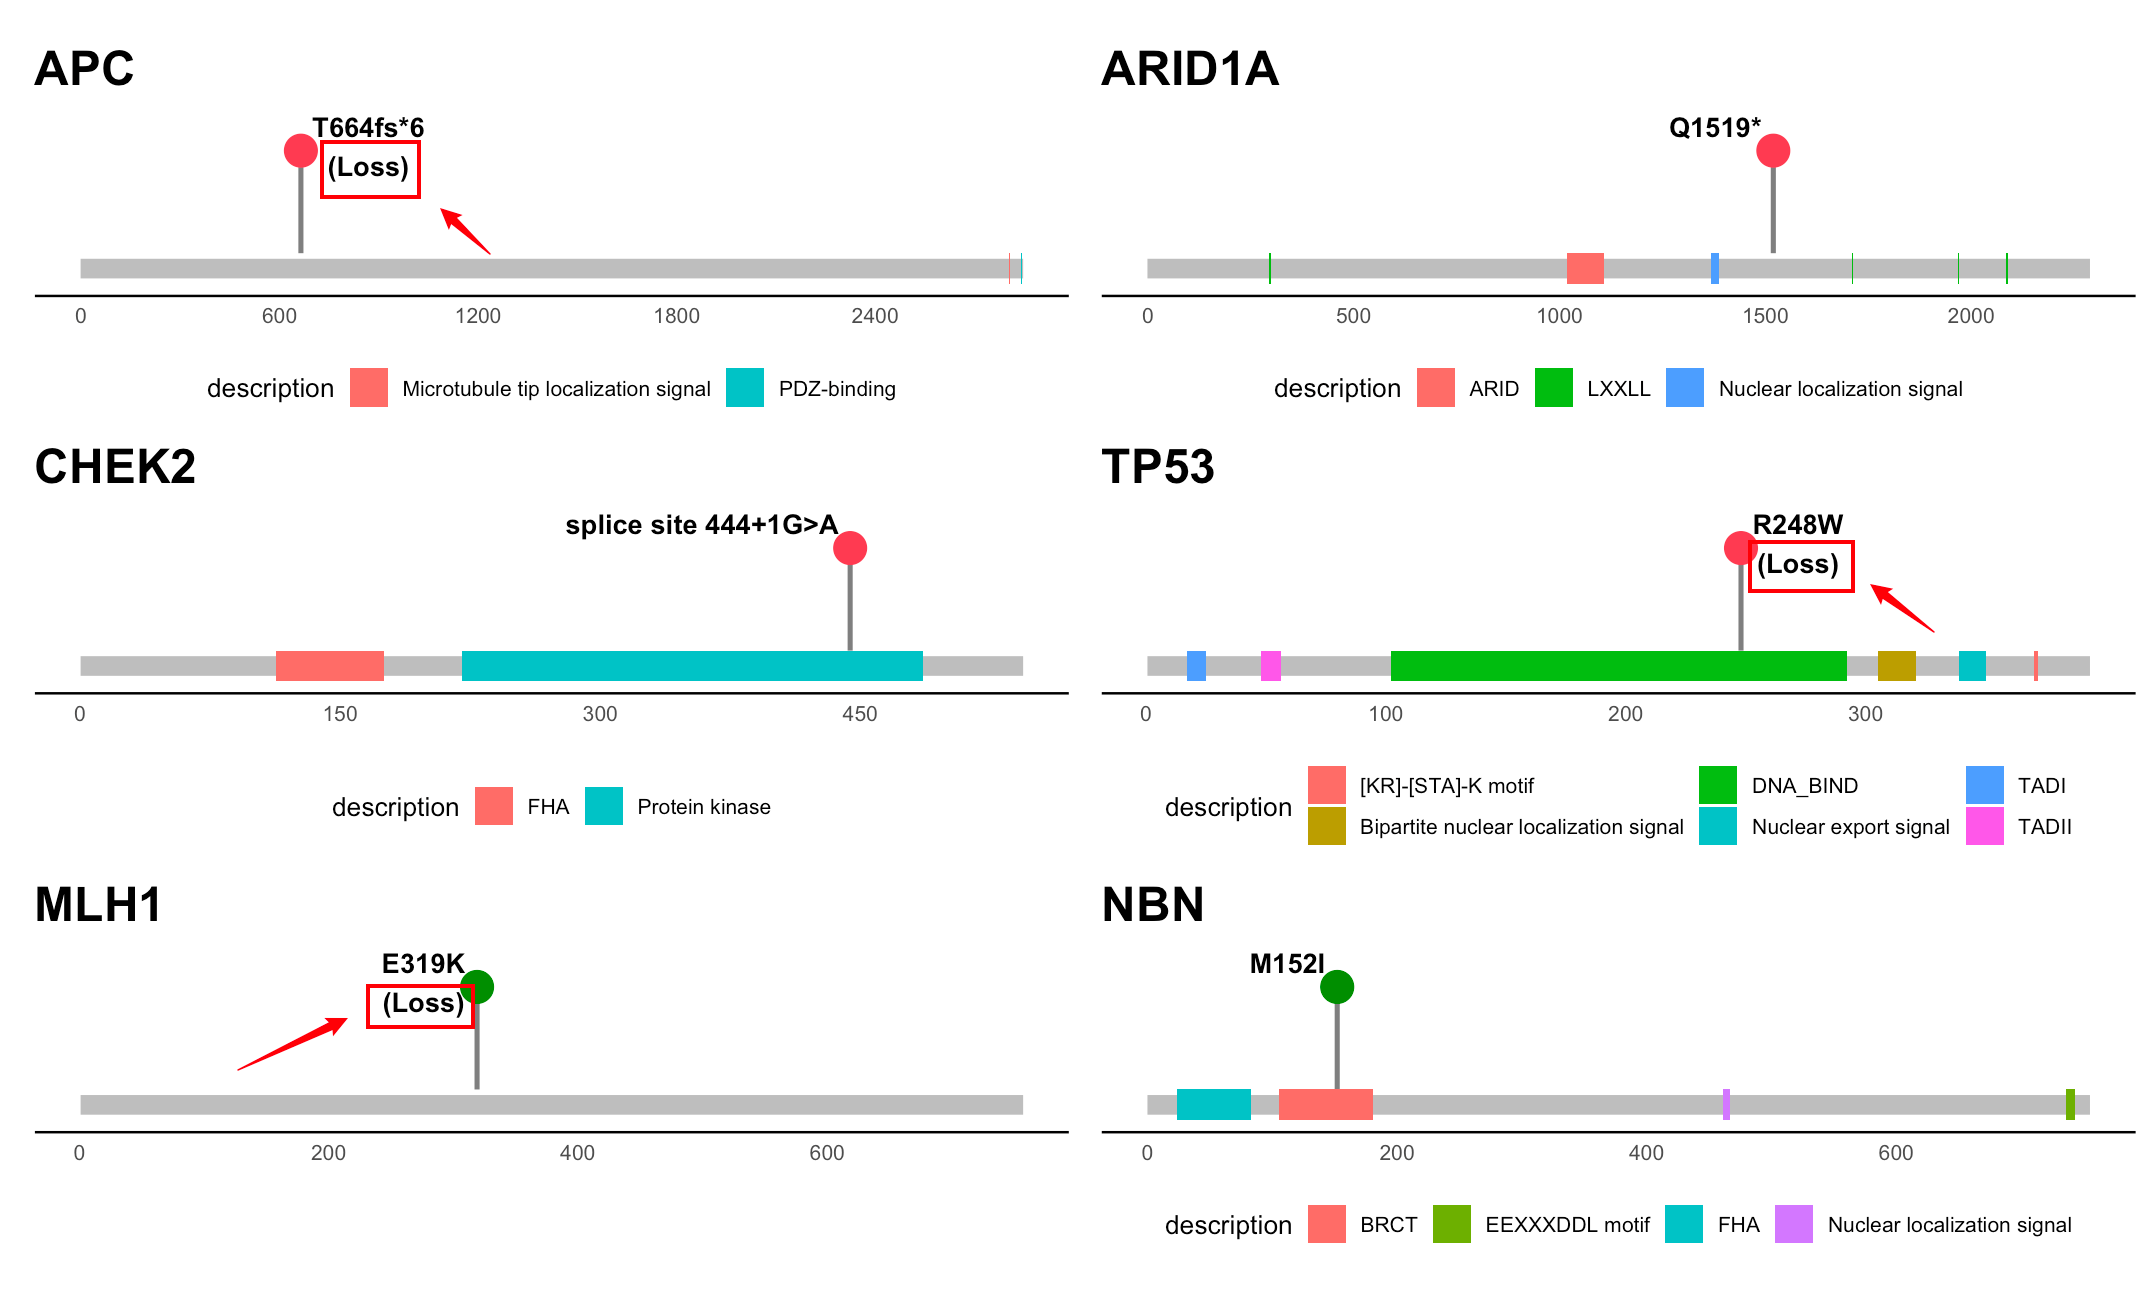
10.3.1 Mutation functions
The module helps predict the functions of mutations (GOF/LOF) provided in the user input profile based on expression data. It supports both RNA/Protein data from TCGA and CCLE.
10.3.1.1 Parameters
Cancer type: Users can choose cell line data from CCLE or patient sample data from TCGA.
Expression type: This function provides the prediction of mutation function based on RNA expression or Protein expression. The data are extracted from TGCA. The protein data may not be available for all genes in the query.
Y-axis scale: whether or not to show unified y-scales for each facet.

10.3.2 3D Feature exploration
The 3D plot allows the exploration of clinical/genomic features among samples (matched sample or all samples). The feature types can be either continuous or discrete.
Continuous variables: TMB, FGA, Connecting scores, age, etc.
Discrete variables: Stage, TMB status(high/low), Microsatellite status, etc.