6 Enrichment Analysis
6.1 Cancer Enrichment Analysis
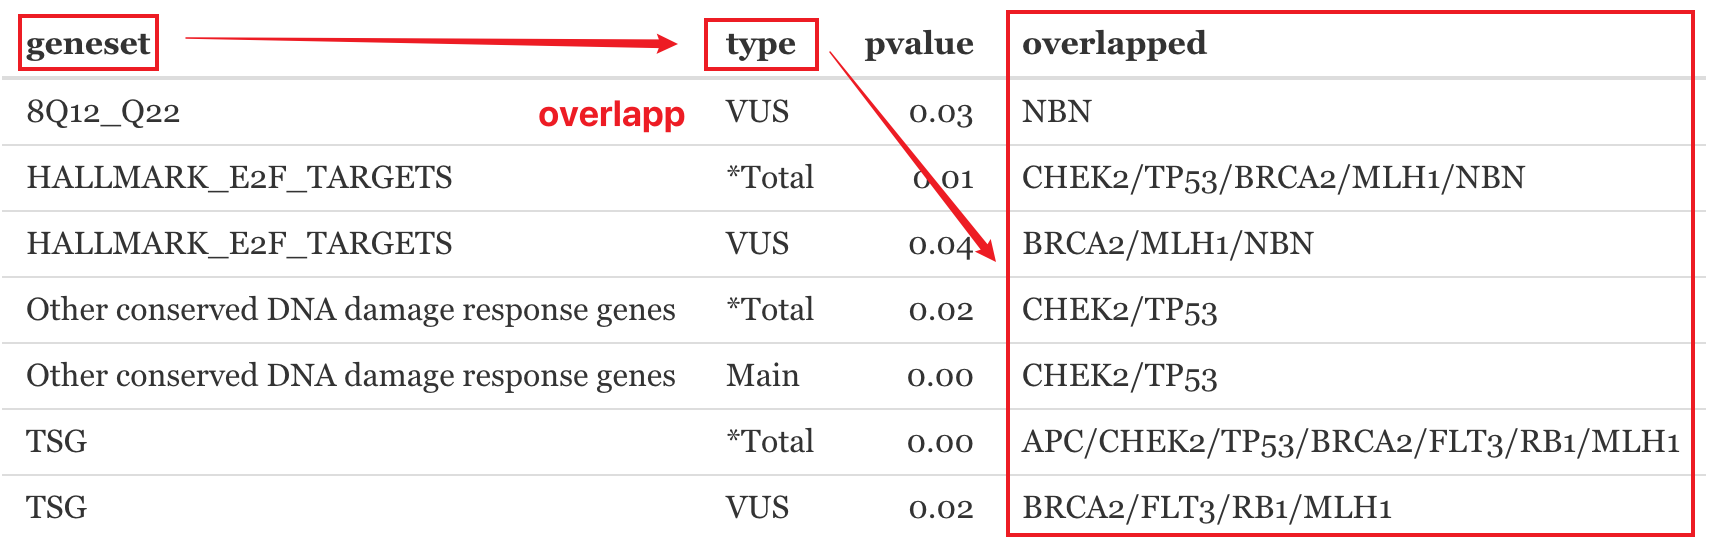
The Cancer Enrichment Analysis module helps find gene sets represented most in the patient profiles. We use an in-house collection of gene sets to perform this analysis. The data source includes MSigDB(Liberzon et al. 2011), DNA repair/damage genes(Lange, Takata, and Wood 2011; Ronen and Glickman 2001), Oncogene, Tumor suppressor genes, etc.
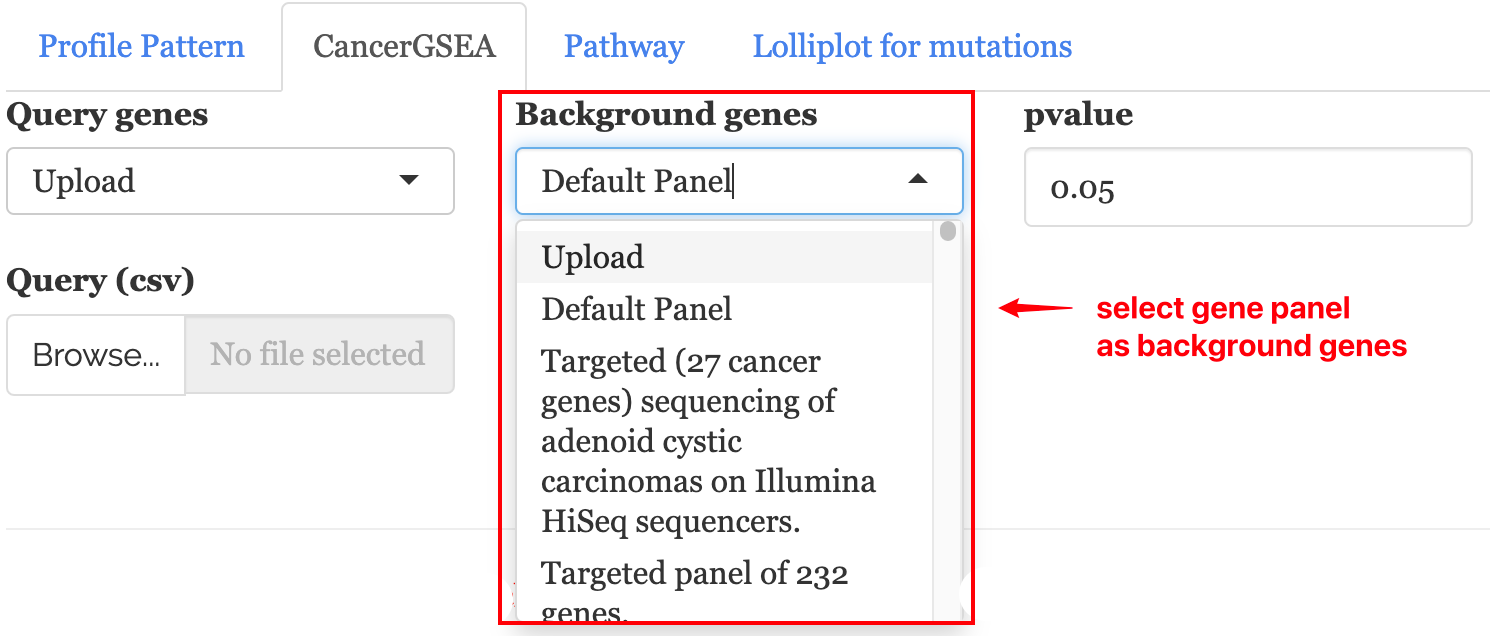
6.1.1 1. Background genes
The input panel allows users to select or upload gene panels as background genes for enrichment analysis. Available genes panels are listed in a drop-down: The panel list are downloaded from cBioPortal using the cBioPortalData package (genePanels(cbio)).
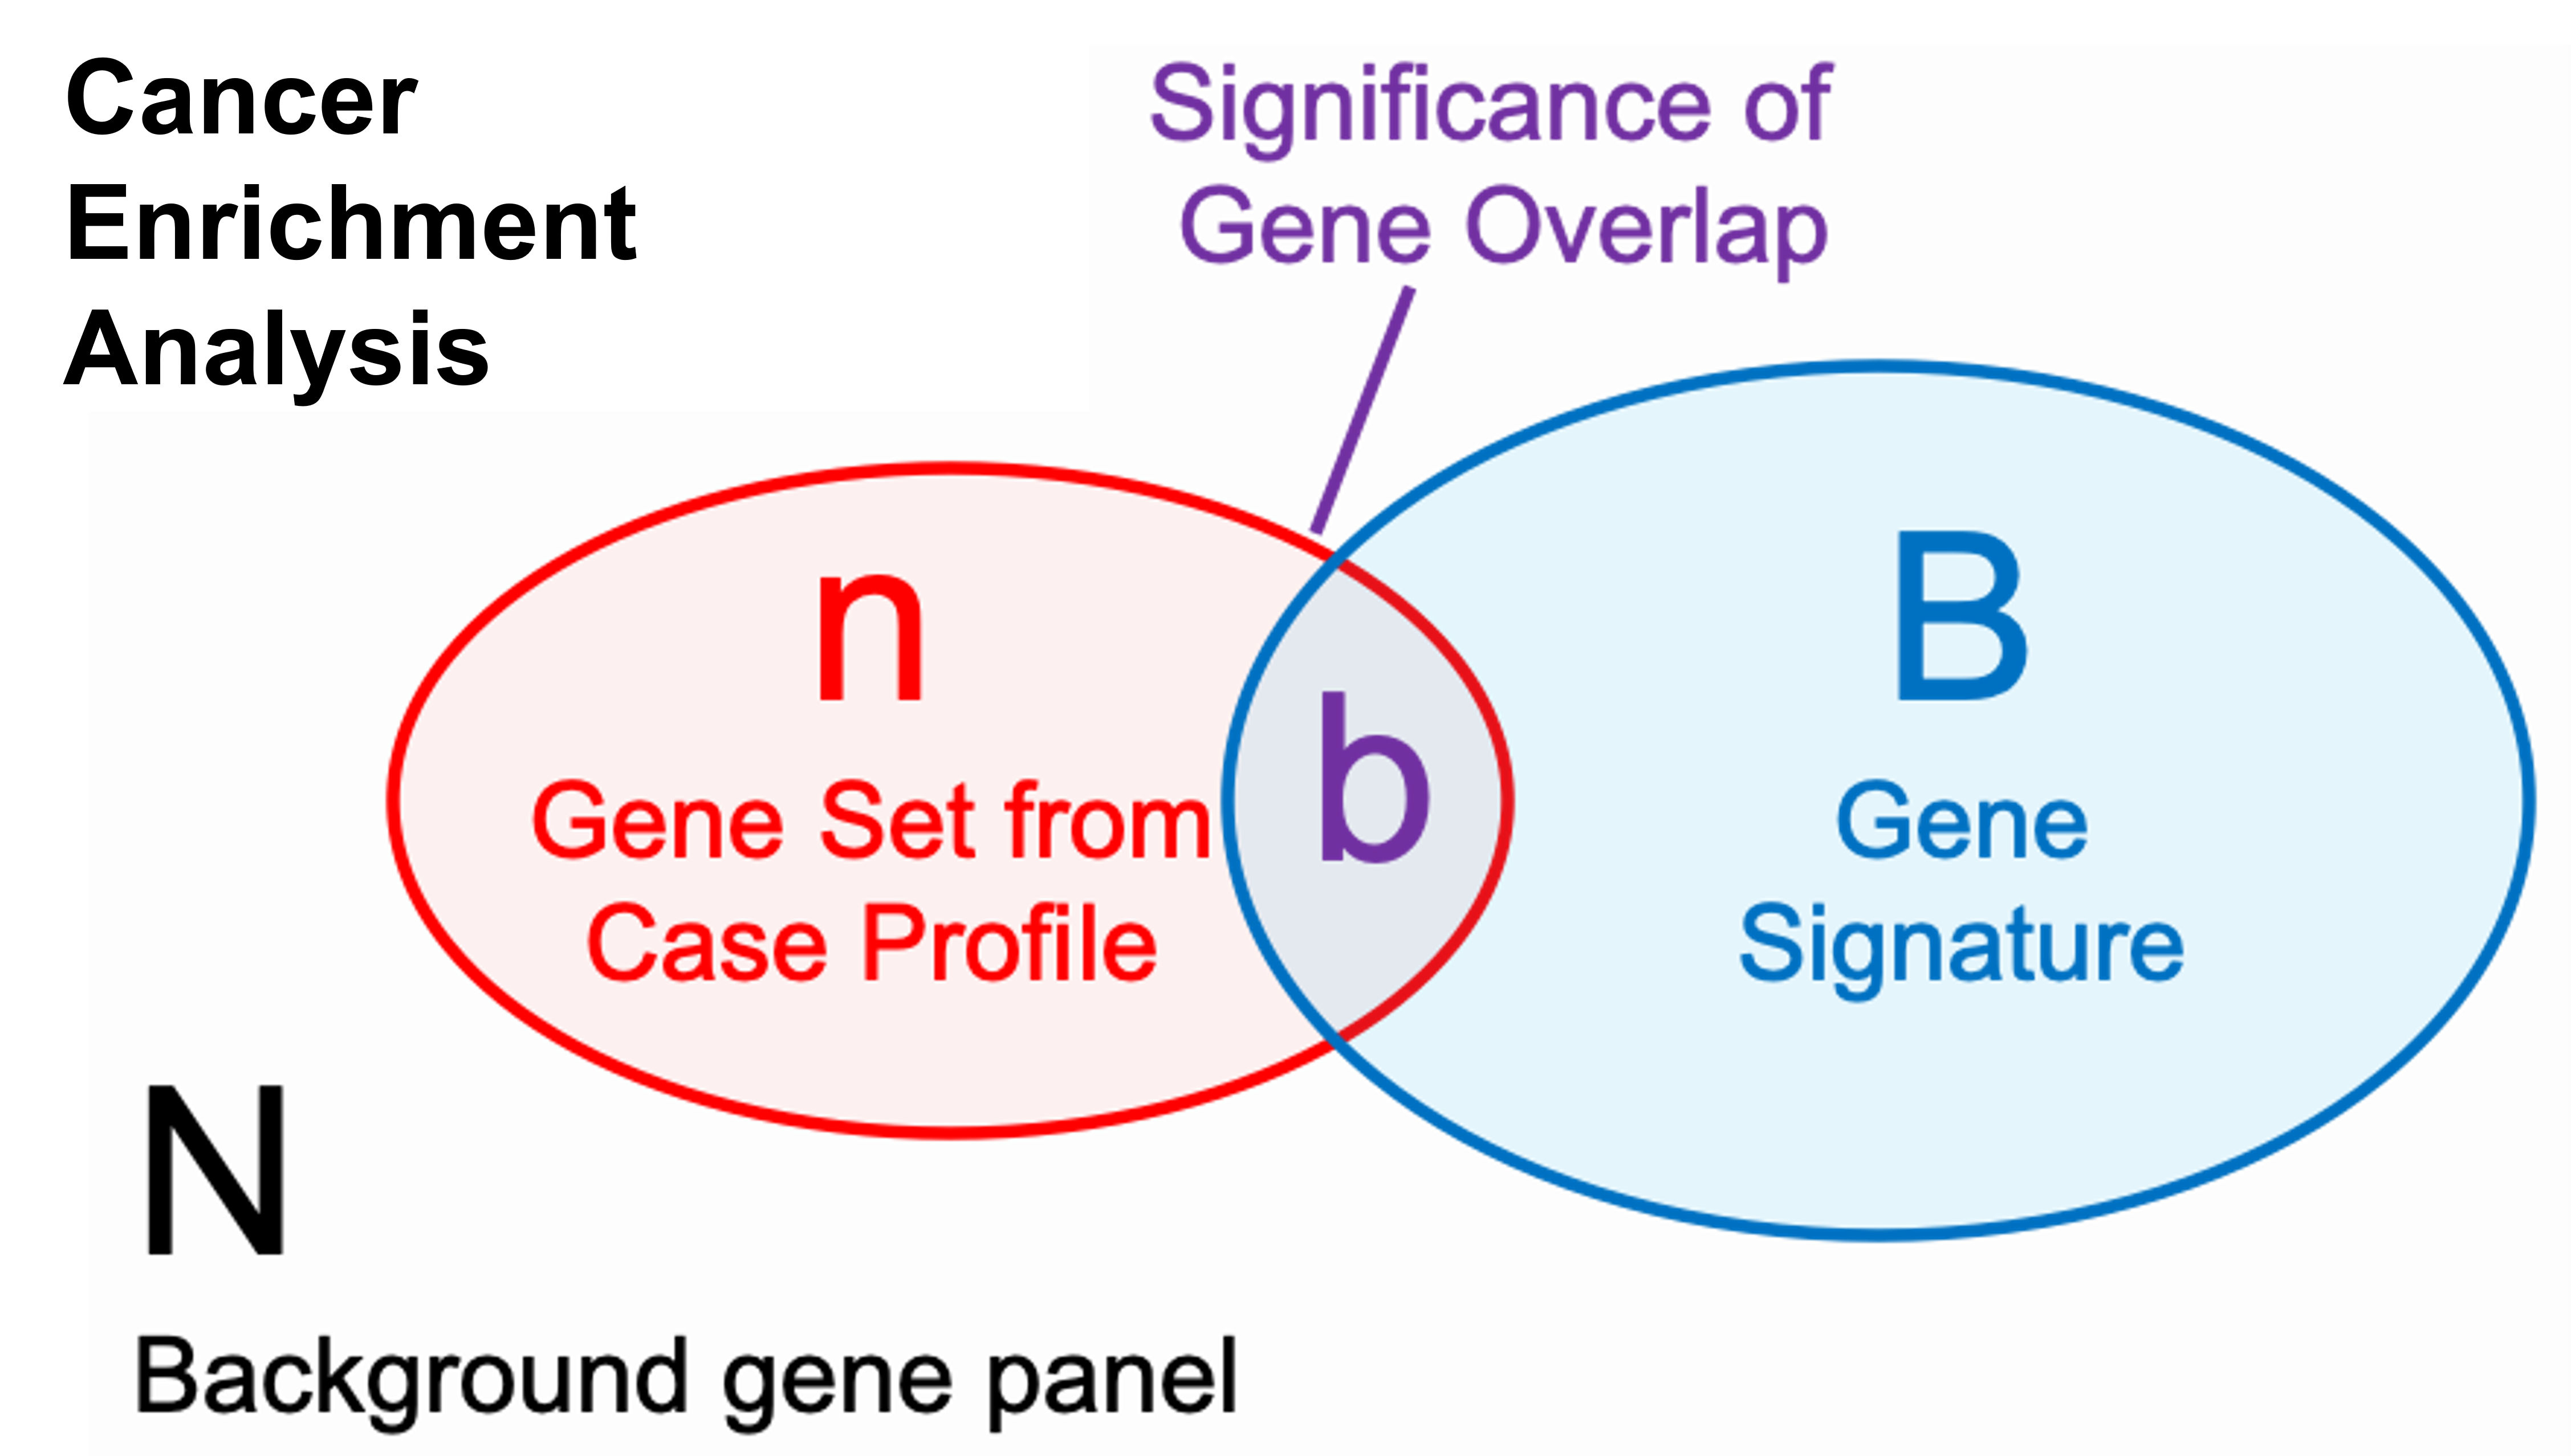
A p-value for the Cancer Enrichment Analysis results requires knowing the number of genes tested in total from a gene panel.
N= the number of genes tested from a panel on the report (background genes)
n= the number of genes in the total patient molecular profile (query genes)
B= the number of genes in each signature (hallmark gene sets, pathways, etc.)
b= overlapped genes
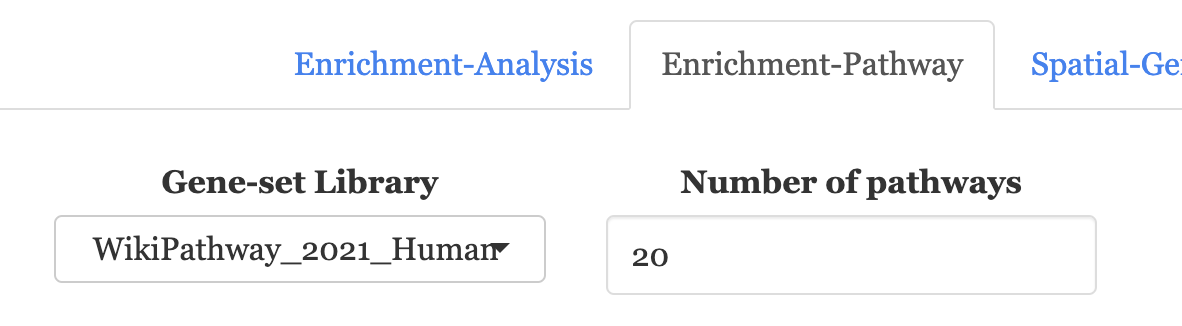
6.2 Pathway analysis
For genes in the patient profile, we perform pathway analyses for the main and VUS group, as well as the combined total profile, to provide a complete graph of genomic alteration.
Using total profile in pathway analysis helps prevent missing pathways represented by both main and VUS together. The results are provided in two types of visualization :
Dot plot for three groups (term-oriented)
pathway graph (gene-oriented)
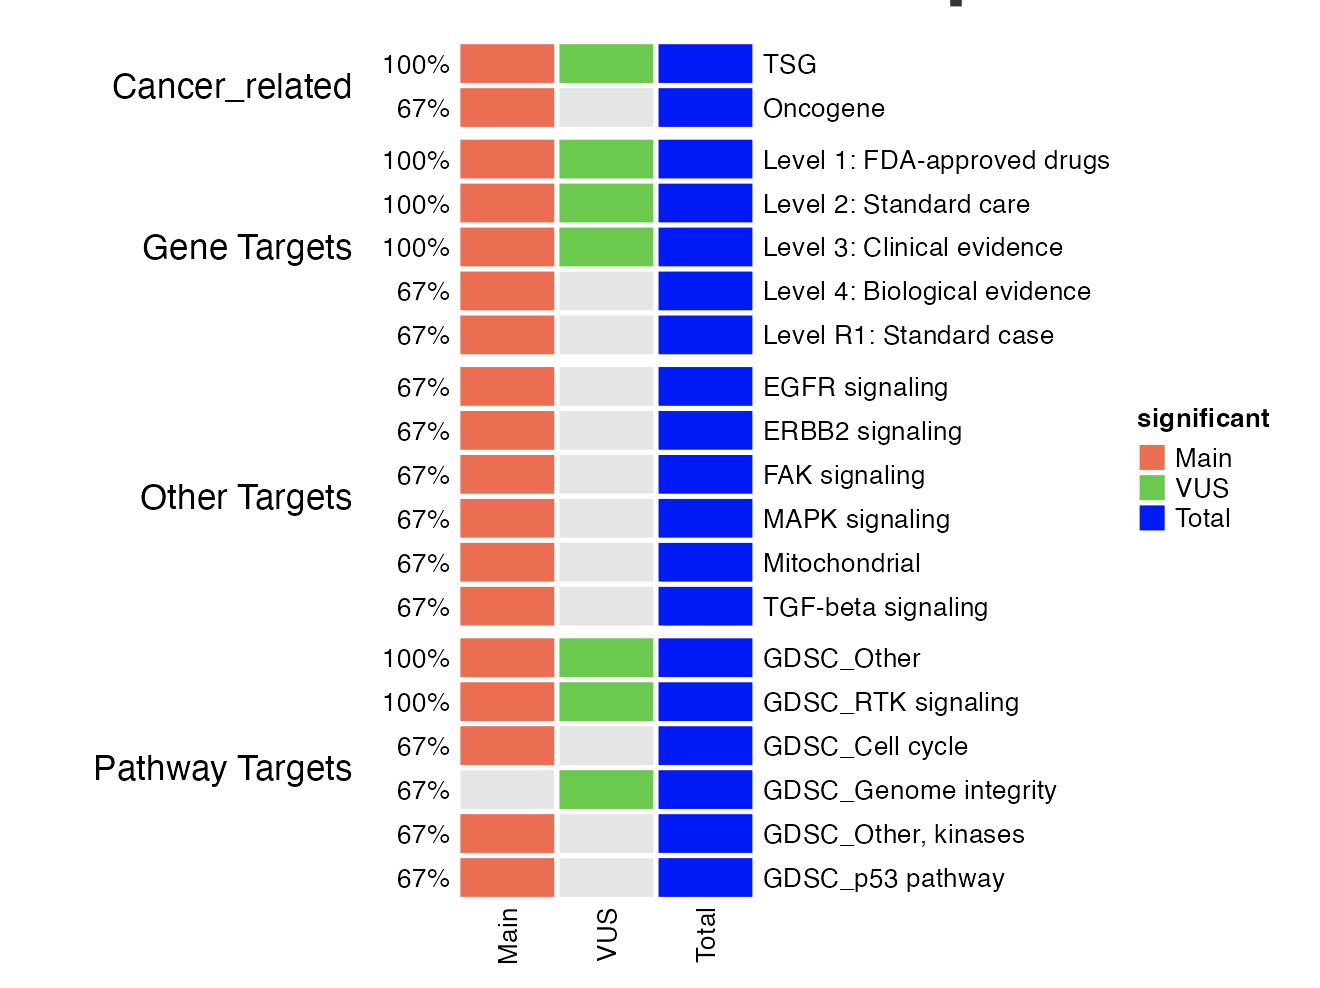
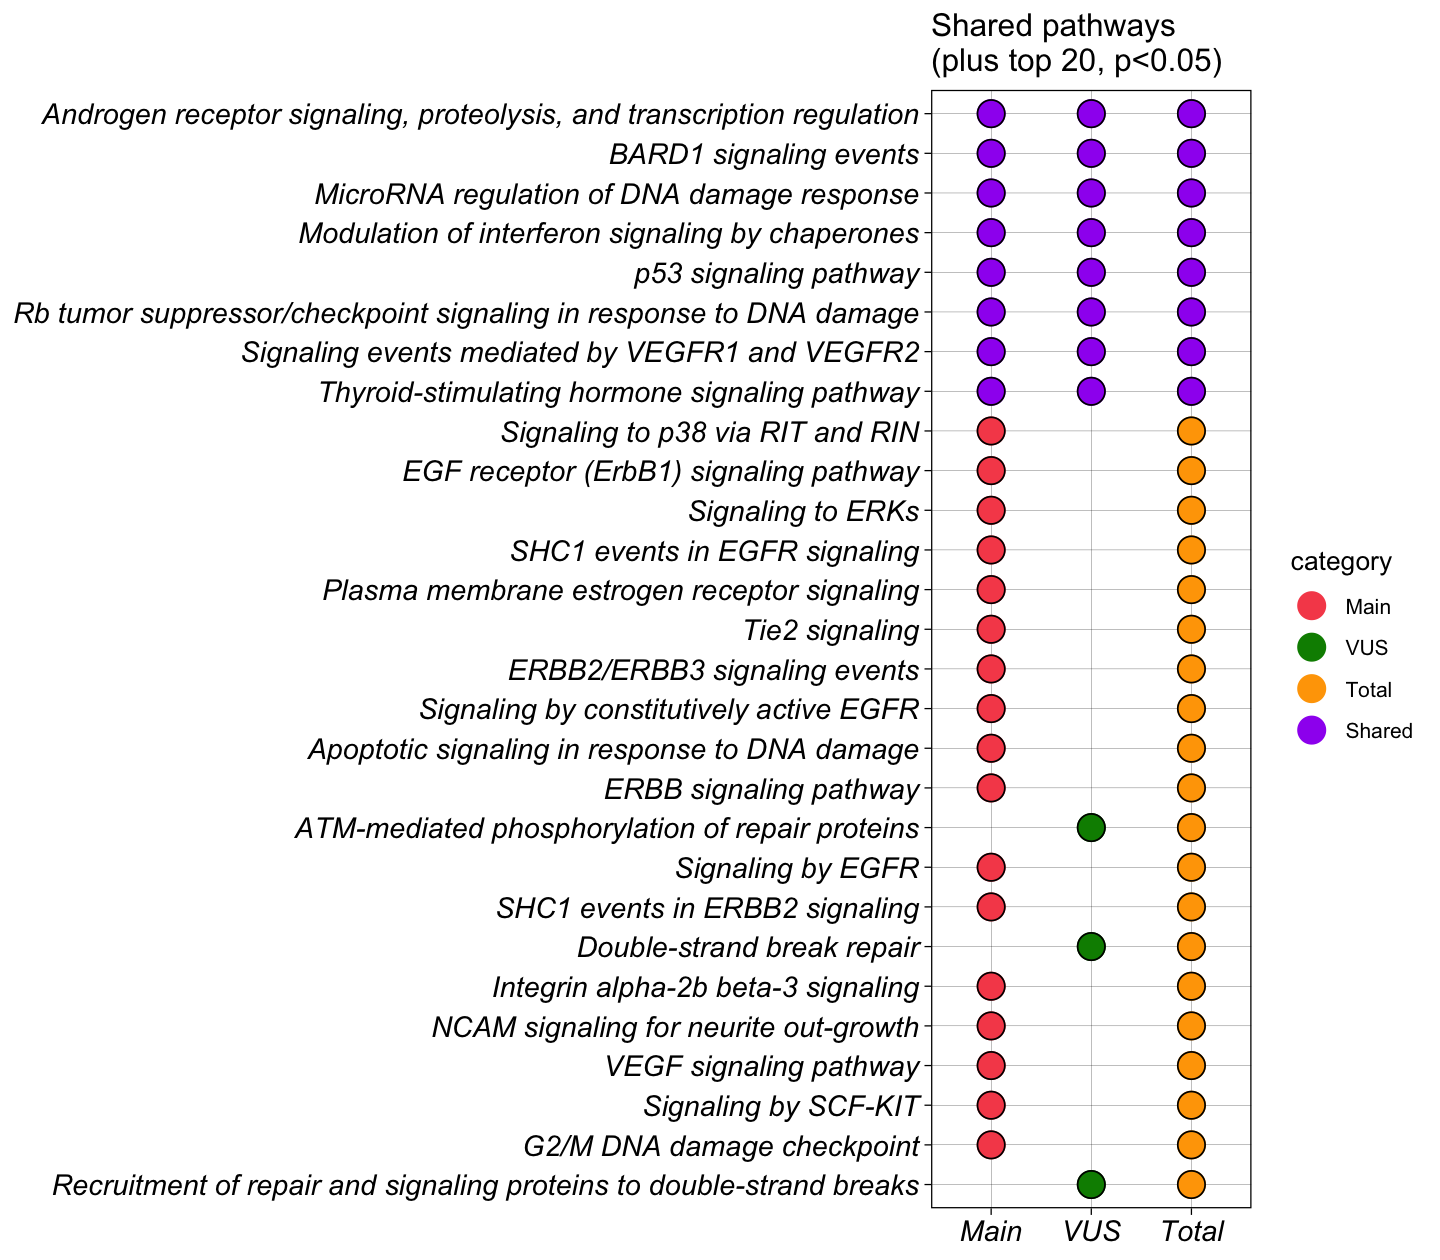
6.2.1 1. Pathway (Dot plot)
The dot plot for the three groups nicely listed the top term enriched separately by groups. It also indicates whether a pathway is shared by multiple groups of genes from the input.
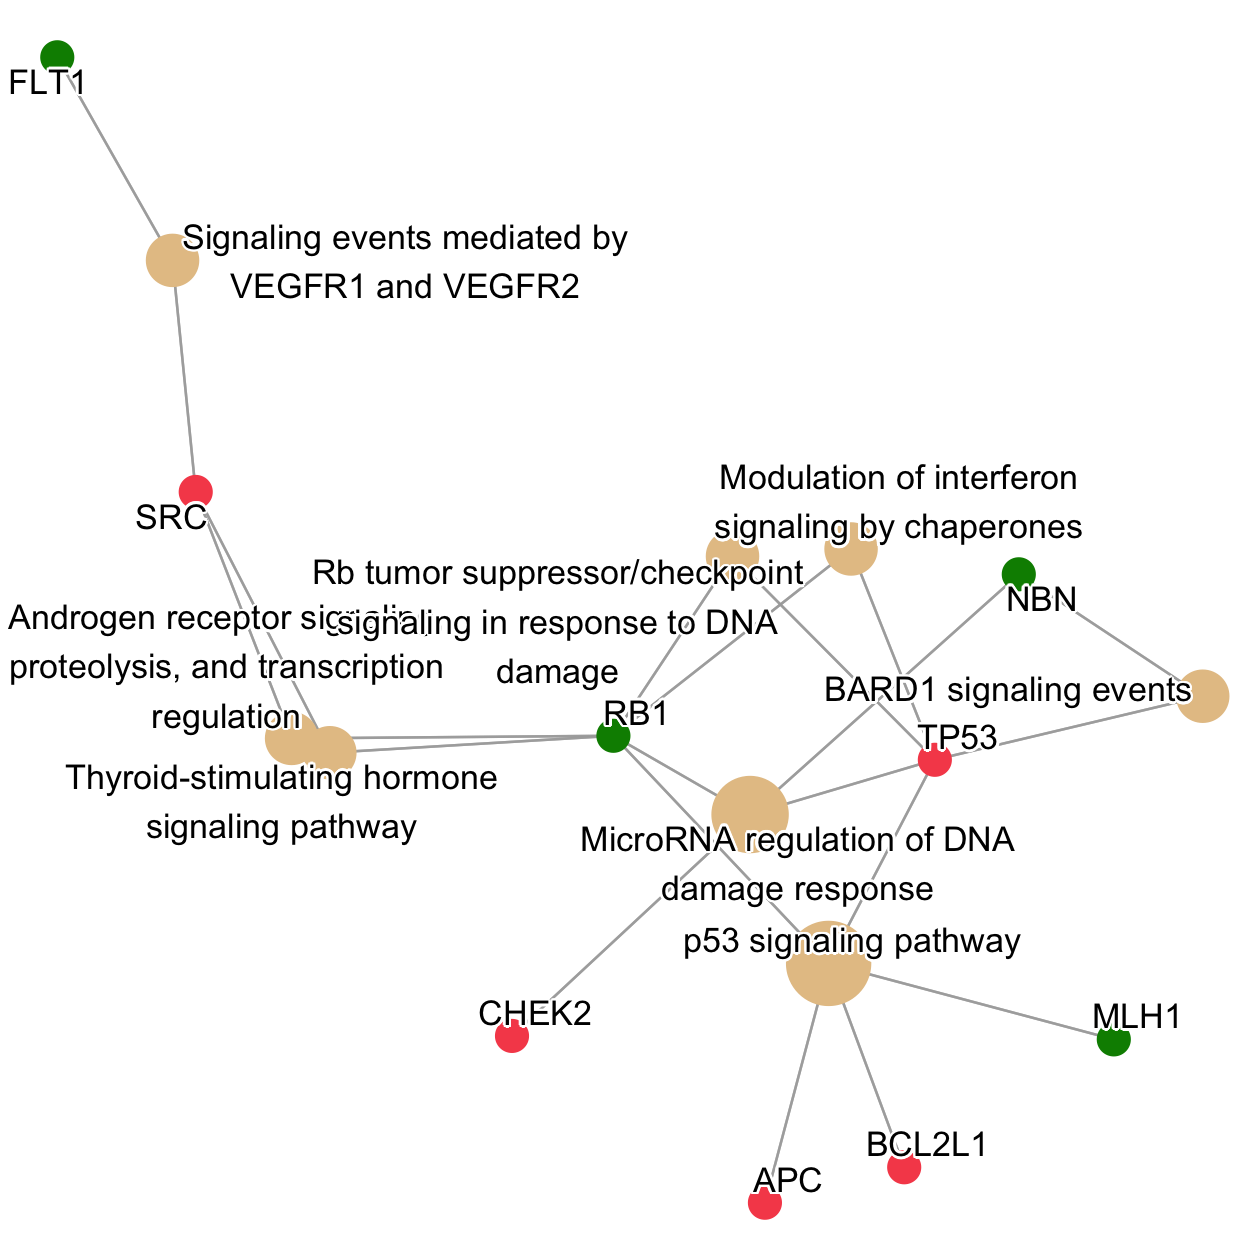
6.2.2 2. Pathway (Graph)
The Nodes in the gene graph represent genes (red/green) and pathway terms (beige).
The graph nicely shows what genes are involved and how they are enriched in multiple pathways(Wu et al. 2021). It also shows that those pathways involve more genes with alterations from the patient profile.