15 Expansion of Exploration
15.1 CCLE-Specific Features
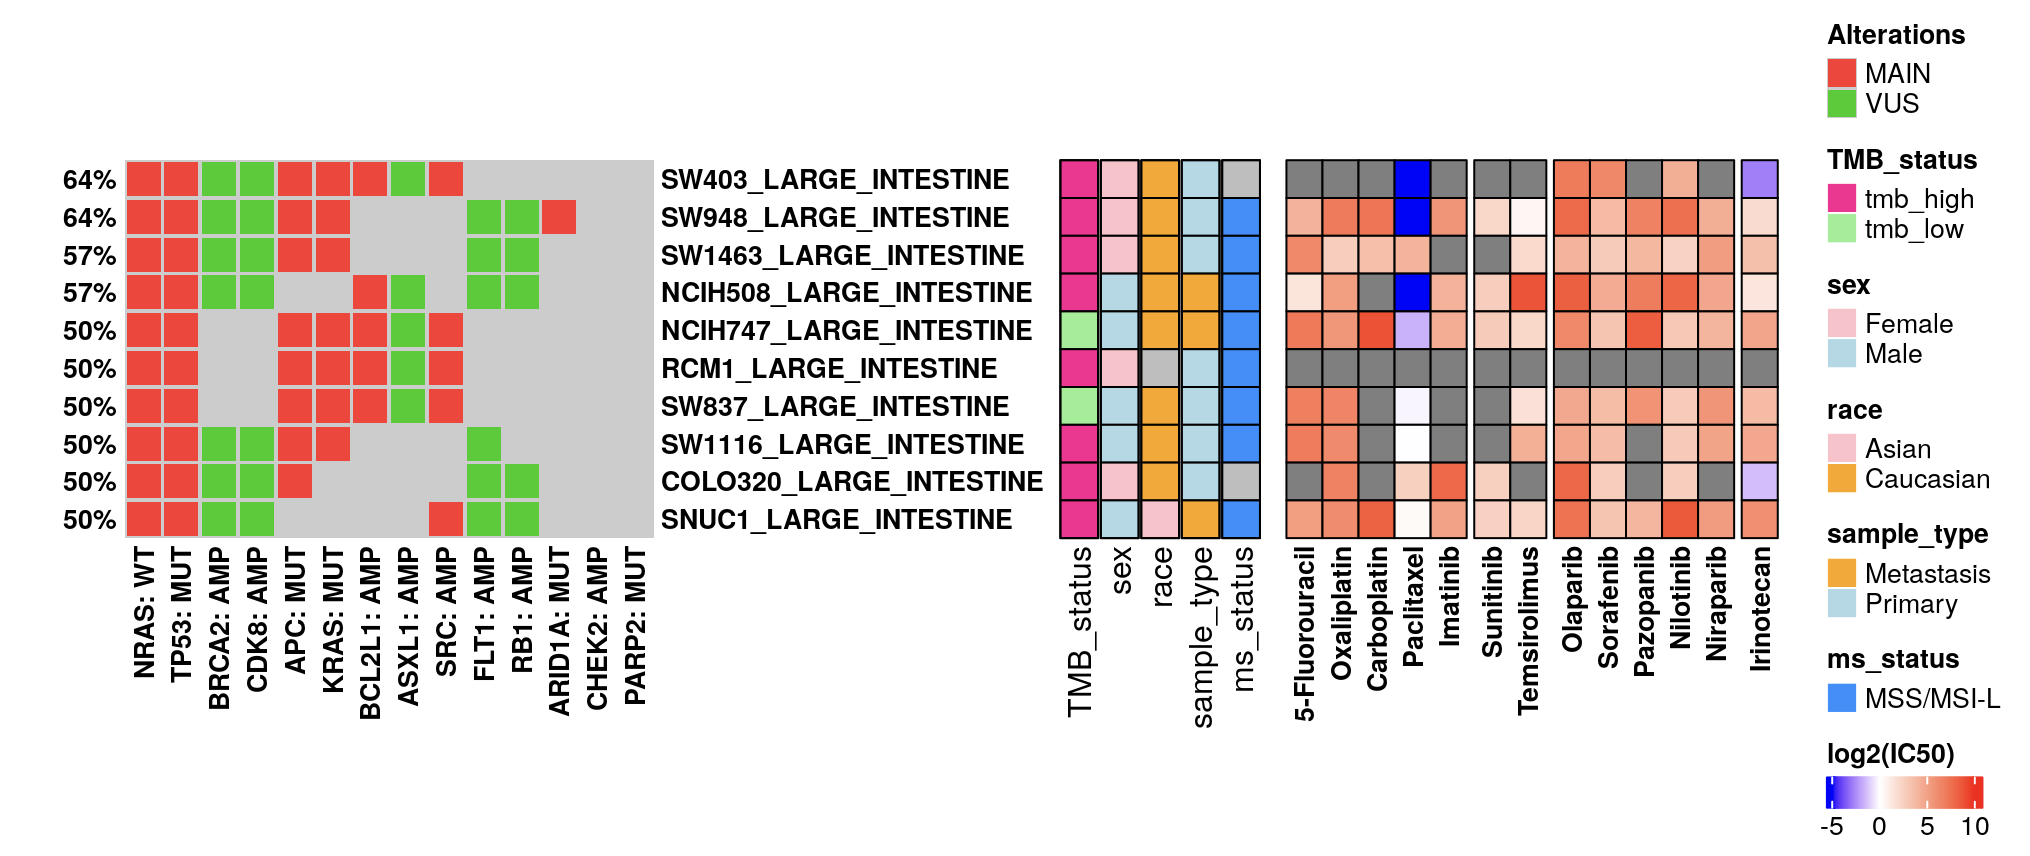
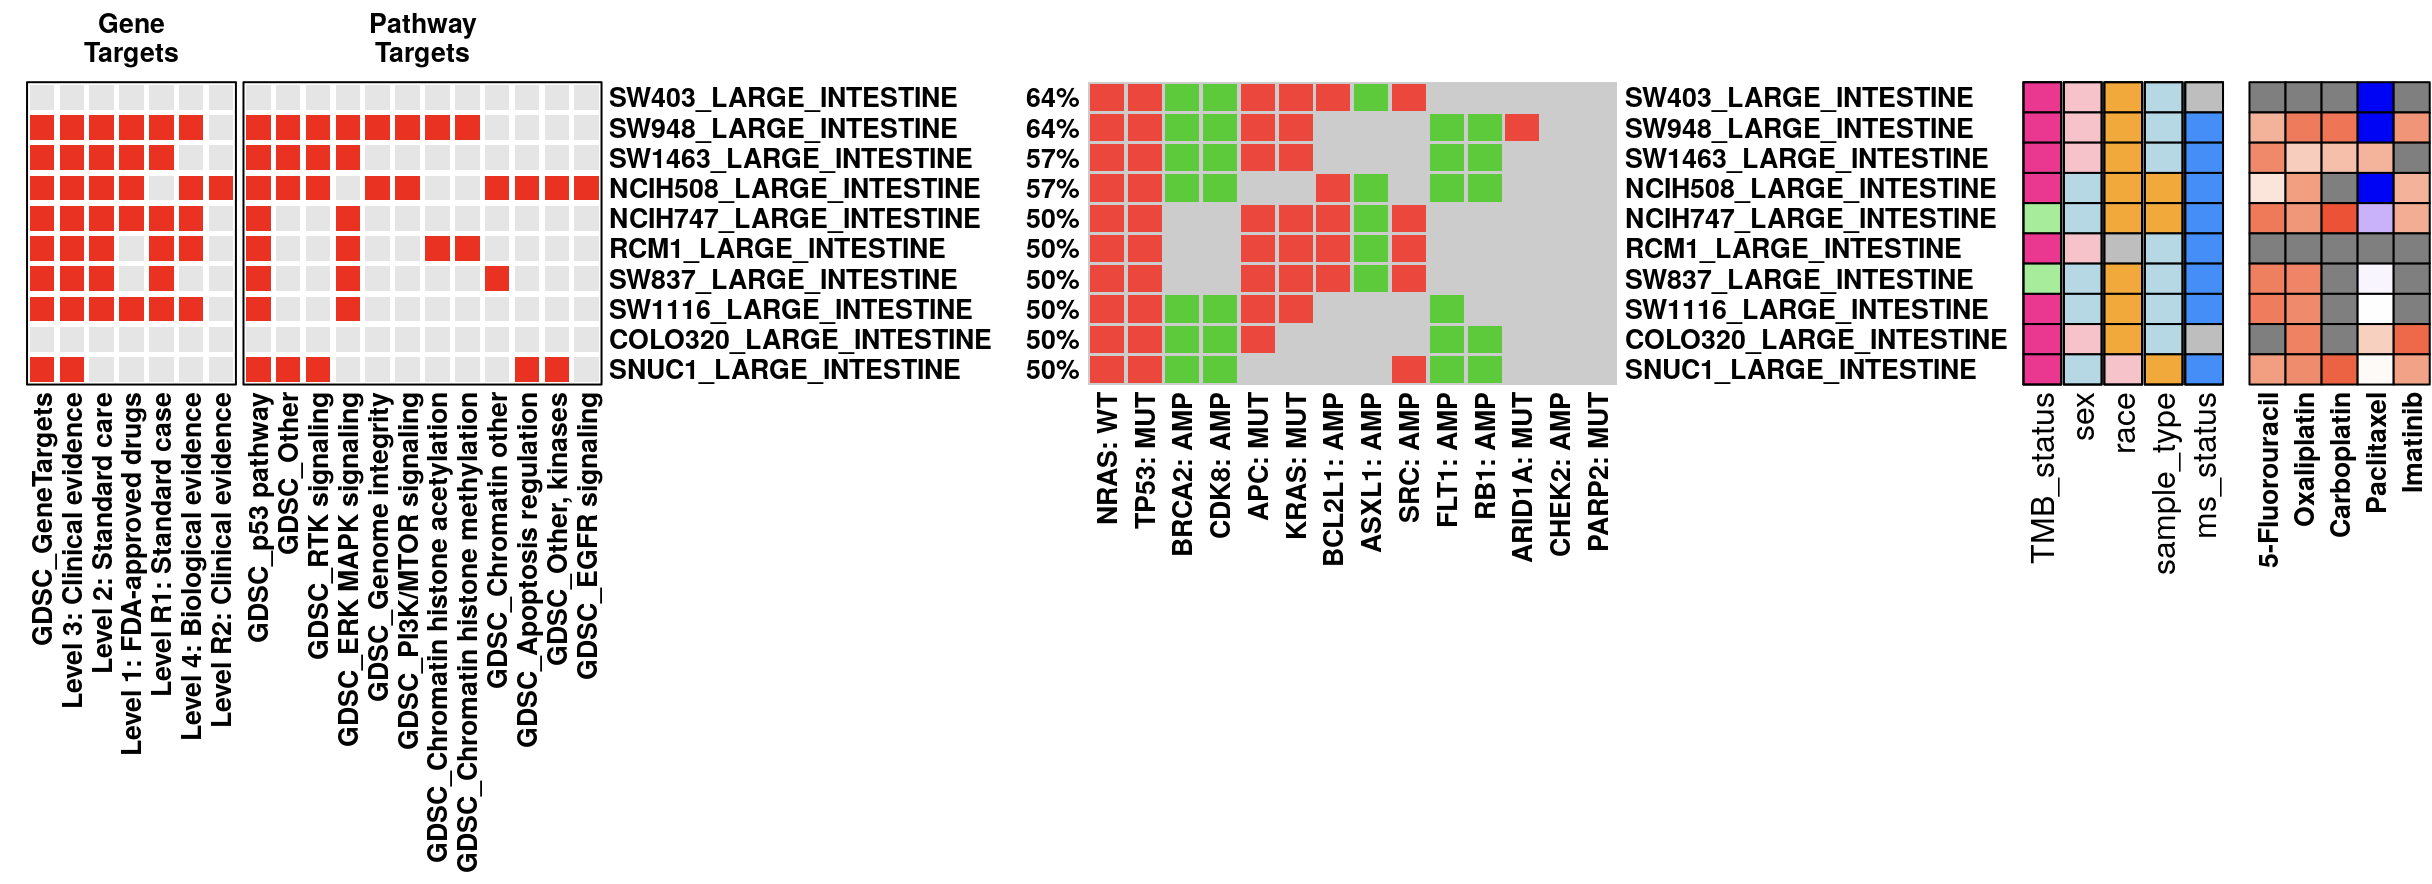
15.1.1 Drug Sensitivity Oncoplots
Input Methods: Query drug sensitivity via IC50 values from the CREAMMIST database, using either “Upload” for batch compound names or “Typing” for real-time direct input.
IC50 Values Display: By default, oncoplots show log2-transformed concentration (µM). Normalization options within compounds are available to facilitate cross-sample drug sensitivity comparison.
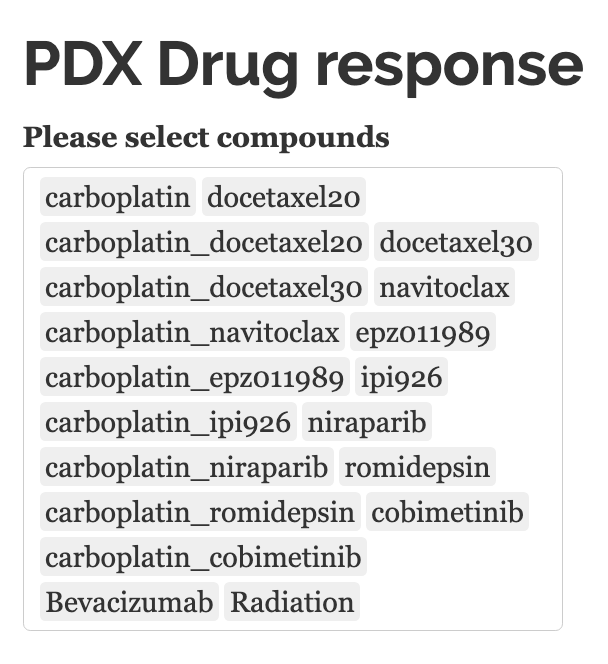
15.3 PDX Specific Feature
The PDX (Patient-Derived Xenograft) model data utilized in this module is sourced from the PDMR (Patient-derived Model Repository) and BCM (Baylor College of Medicine), focusing on breast cancer. These models facilitate the visualization of drug response data, which is annotated with various responses such as Progressive Disease (PD), Partial Response (PR), Stable Disease (SD), among others.
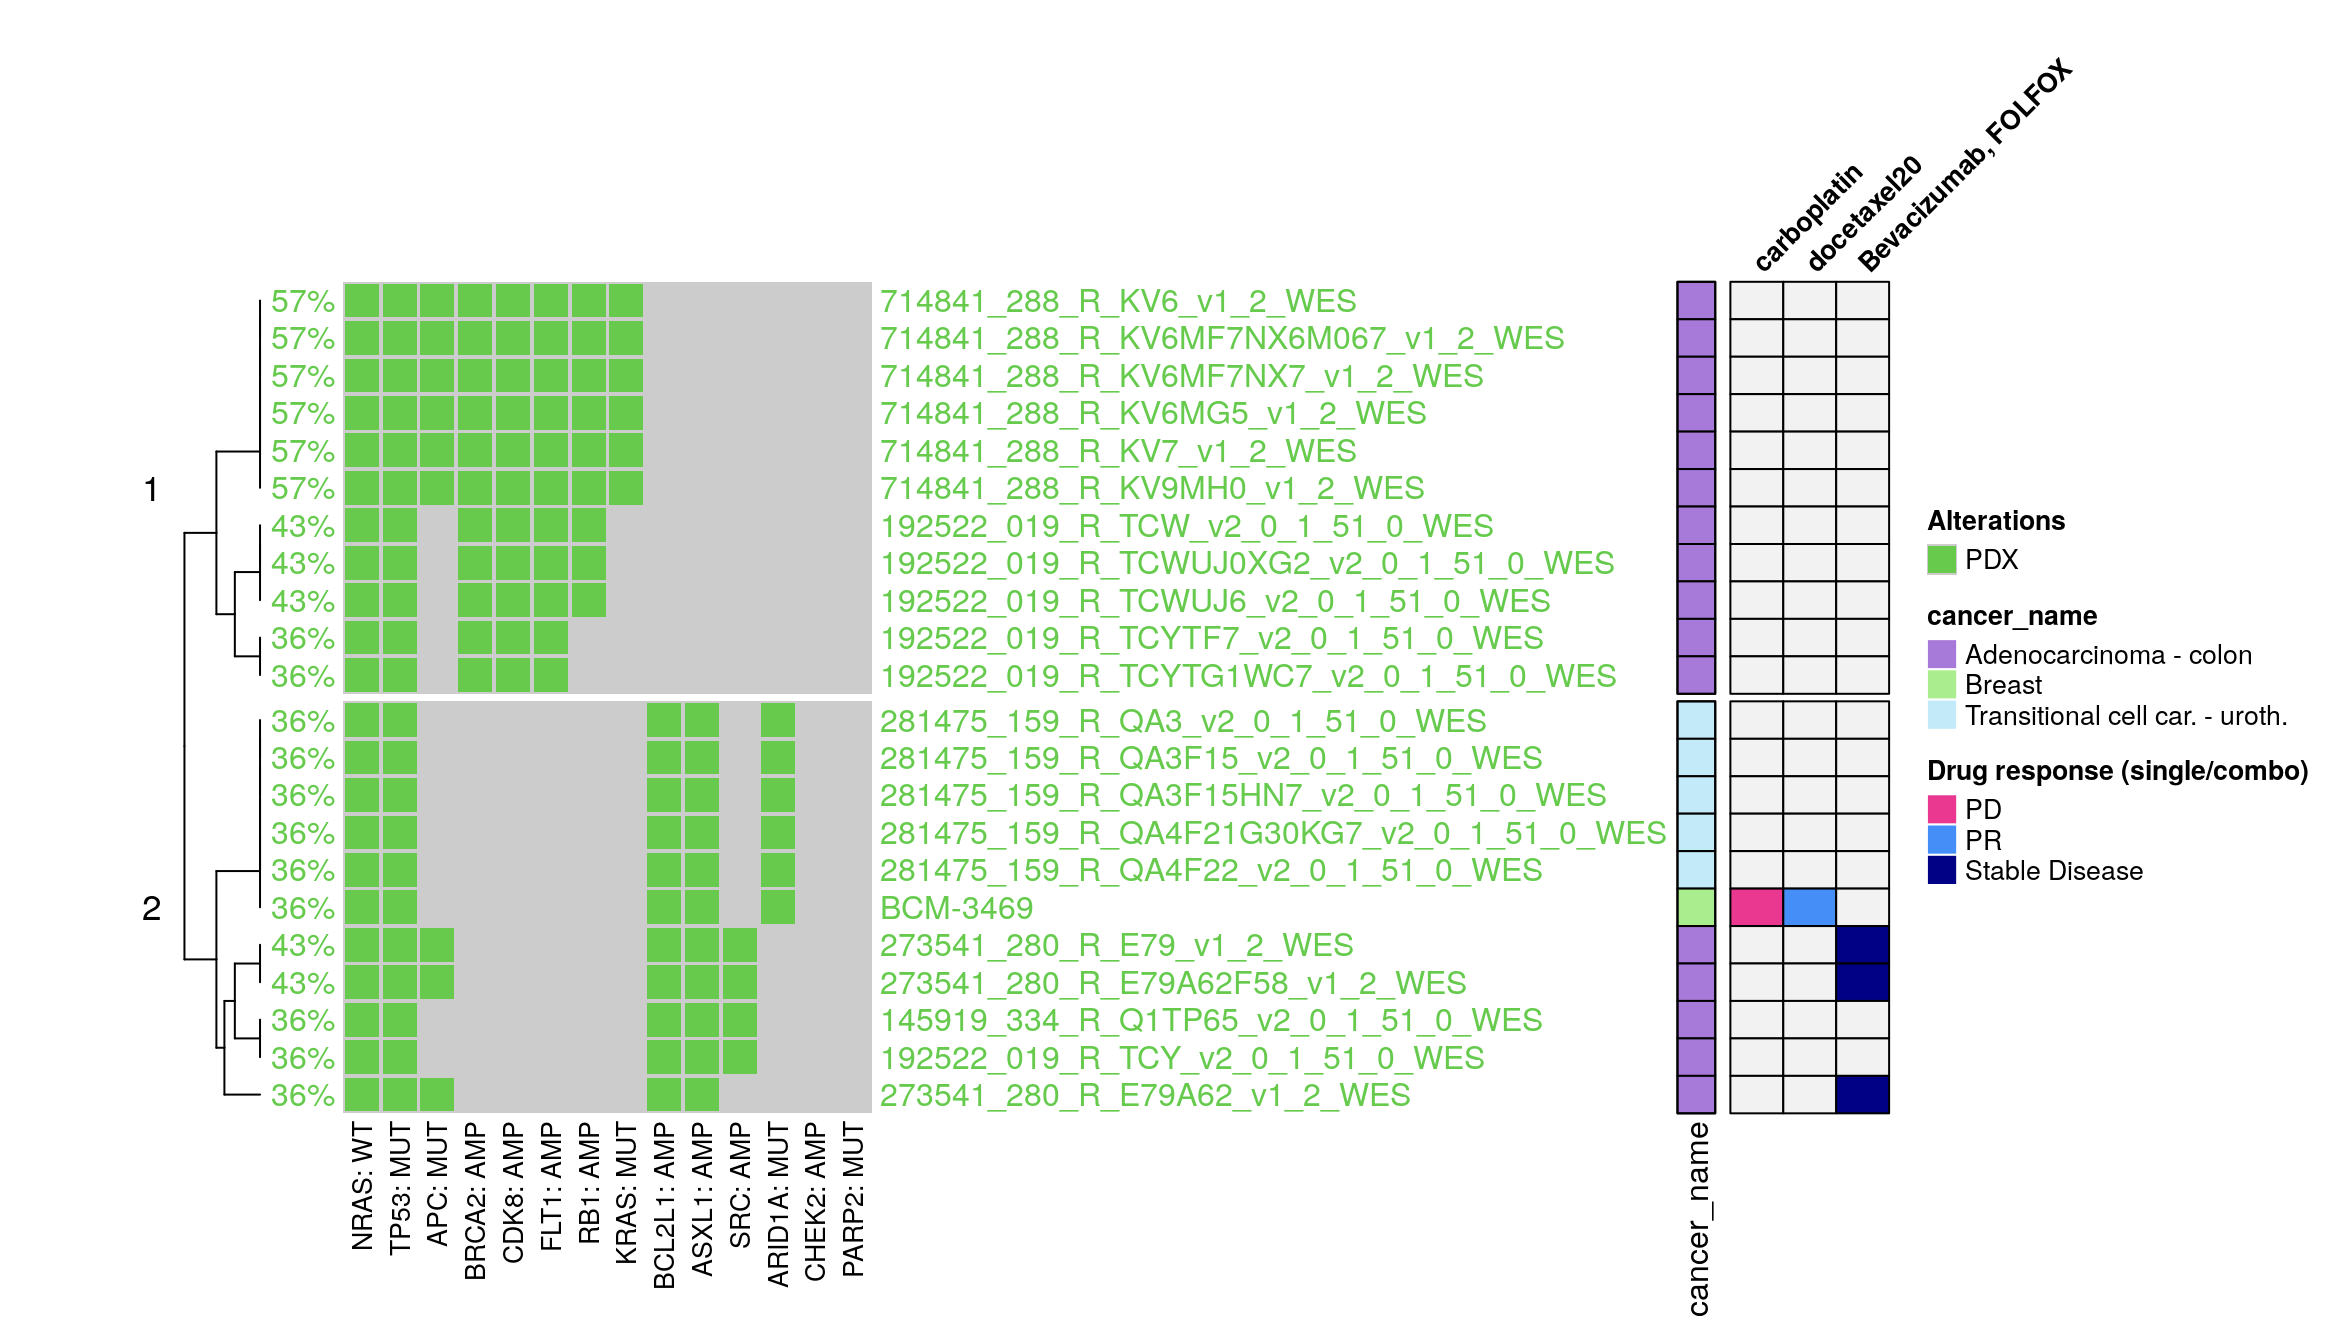
Input Flexibility: Users are provided with a dynamic and responsive interface to select and examine compounds of interest. Given the diversity of compounds tested across different PDX models, the selection list adapts accordingly. Only compounds that have been tested on the currently selected PDX model are displayed, streamlining the user experience and preventing data overload for a more efficient and user-friendly interface.
15.4 Common Oncoplot Features
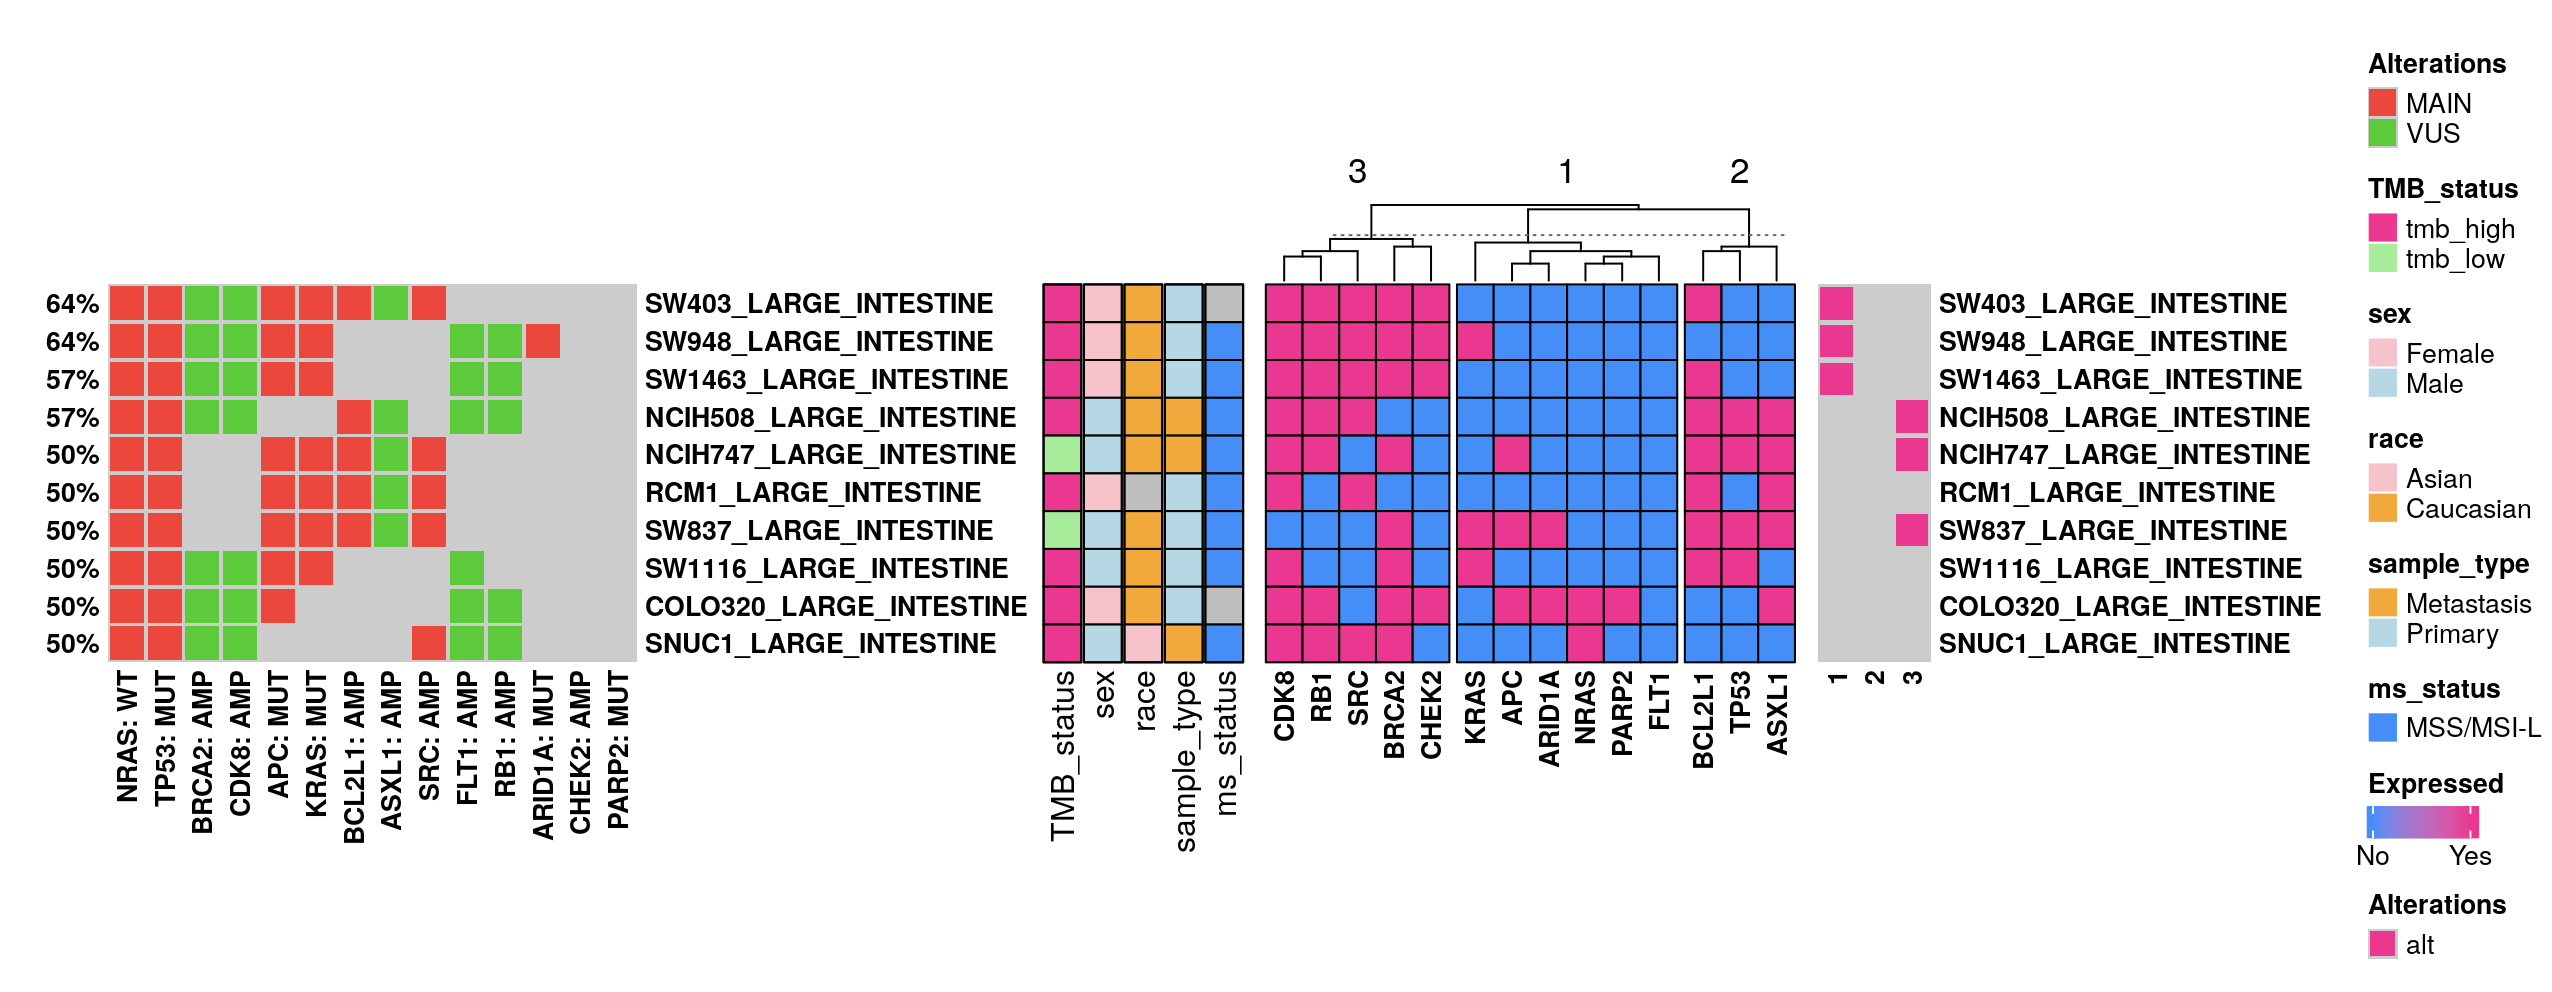
15.4.1 Expression Oncoplots
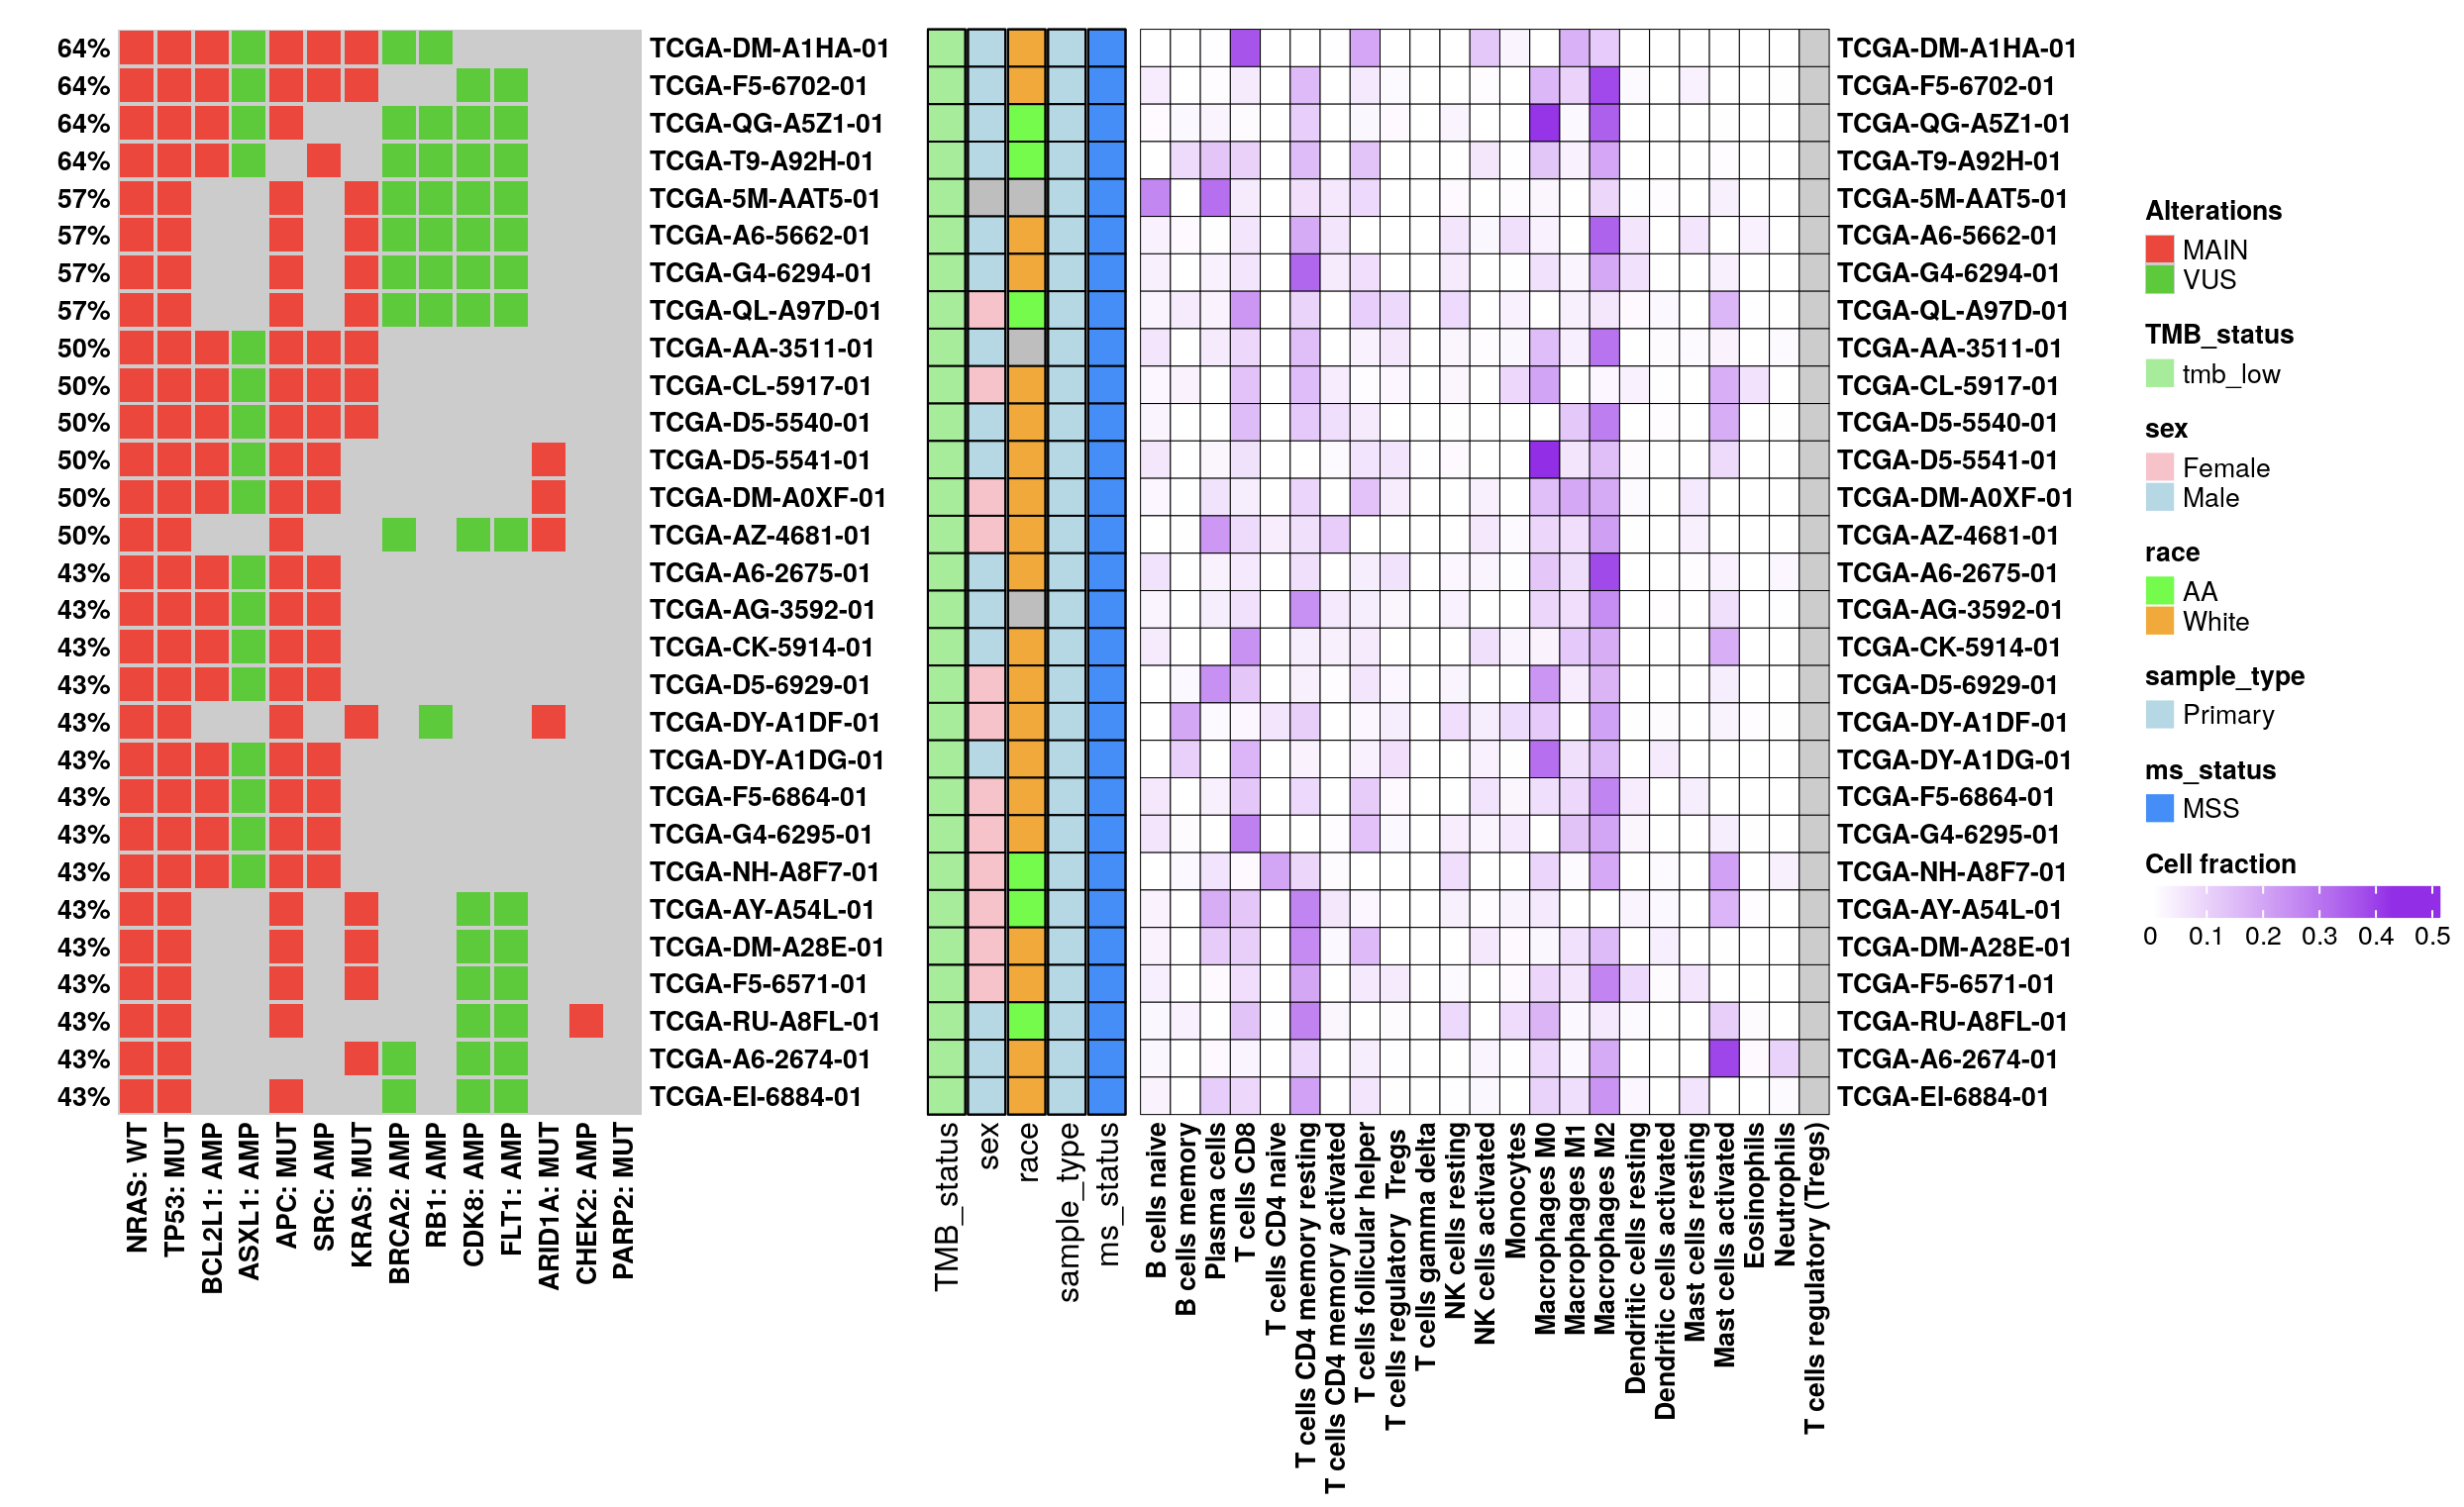
Expression oncoplots enable a comprehensive exploration of RNA expression alongside mutation and copy number data. Supported by TCGA and CCLE databases, this feature draws from the cbioPortal API, with a z-score normalization applied to diploid samples. Here, a z-score above 0 denotes “high” expression, while a z-score of 0 or below indicates “low” expression for each gene.
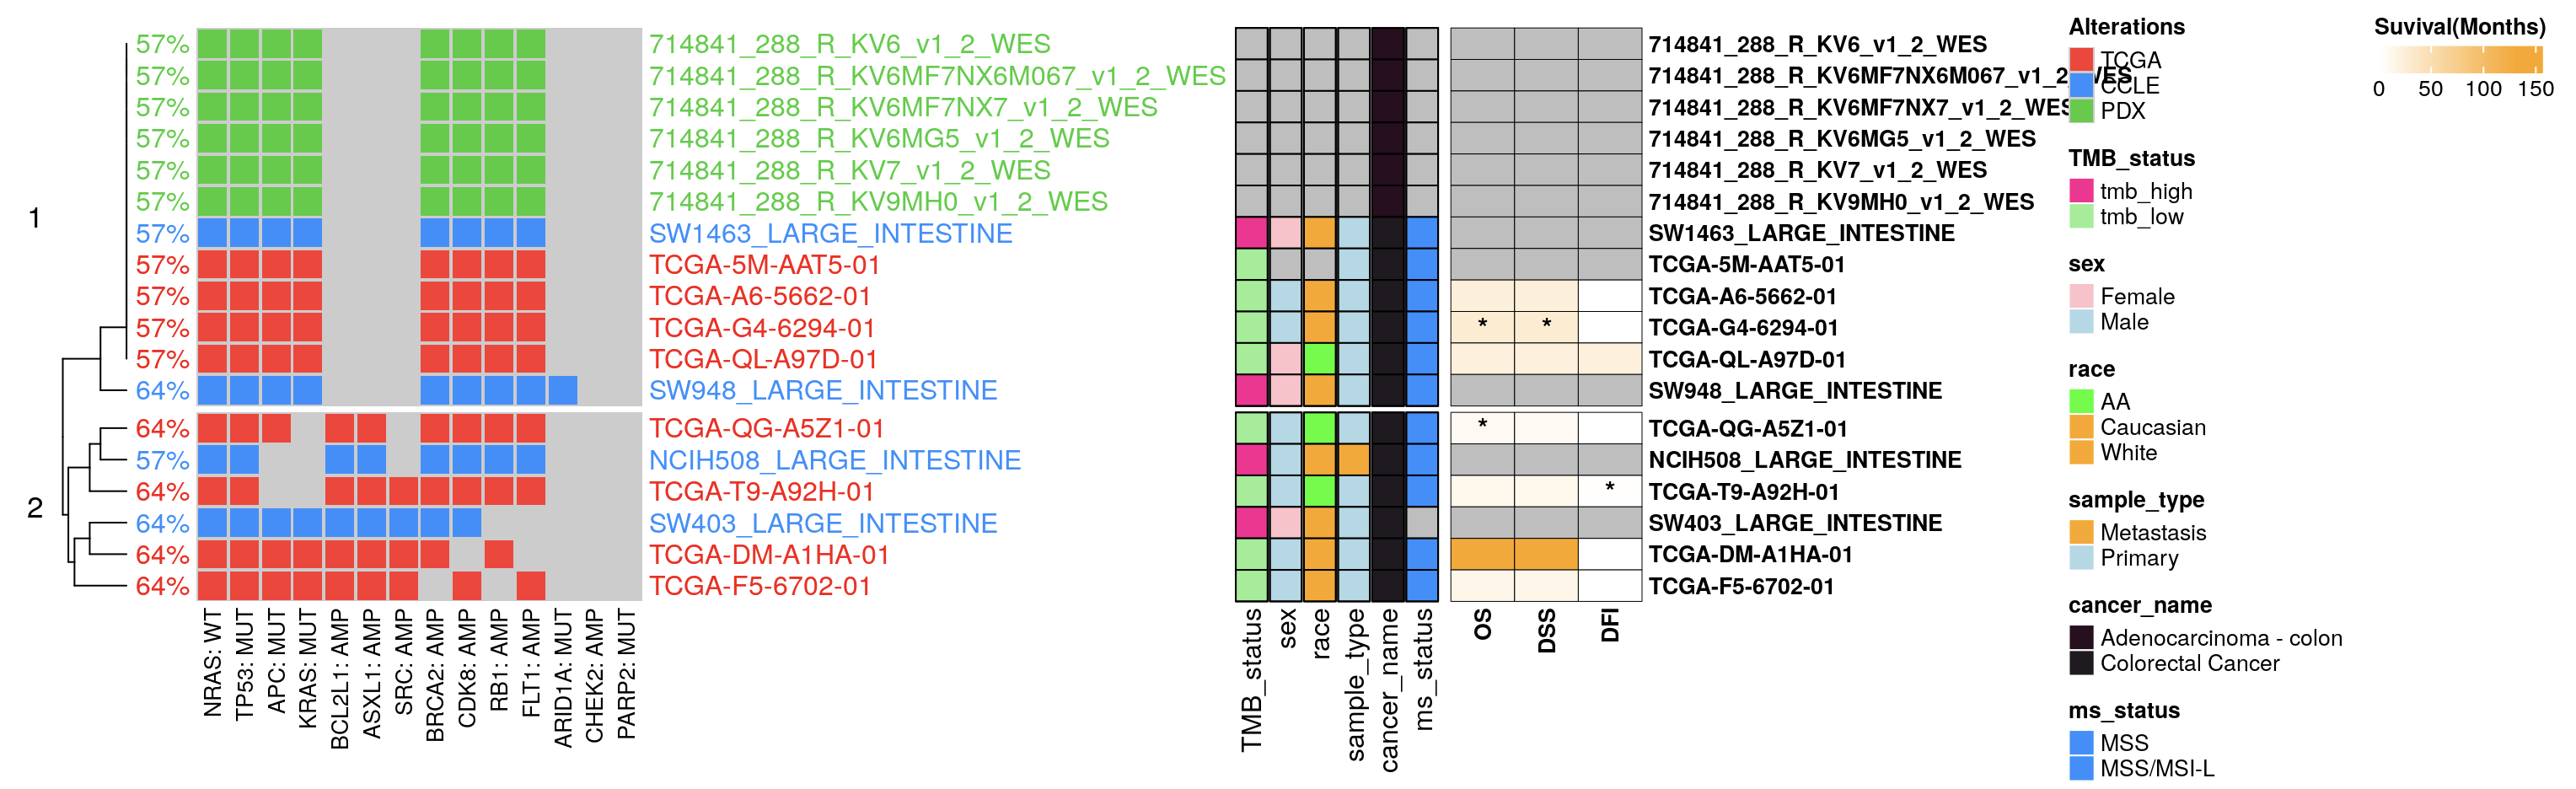
15.4.2 Survival Oncoplots Integration
This module graphically represents survival status and time, visualizing the data as color-coded heatmaps. Available data spans TCGA, CCLE, MSKCC, and METABRIC databases. The survival duration, denoted in months, is illustrated, with an asterisk (*) marking deceased patients.
15.4.3 Non-B Burden Assessment
The application includes our proprietary non-B related burdens calculation, as defined by Xu and Kowalski (2022):
nbTMBp: This metric represents the percentage of non-B related mutations relative to the total Tumor Mutation Burden (TMB) for each sample.
mlTNB: Mutation-localized non-B Burden assesses non-B forming sequences situated at mutation sites within tumor samples, quantified by non-B types.
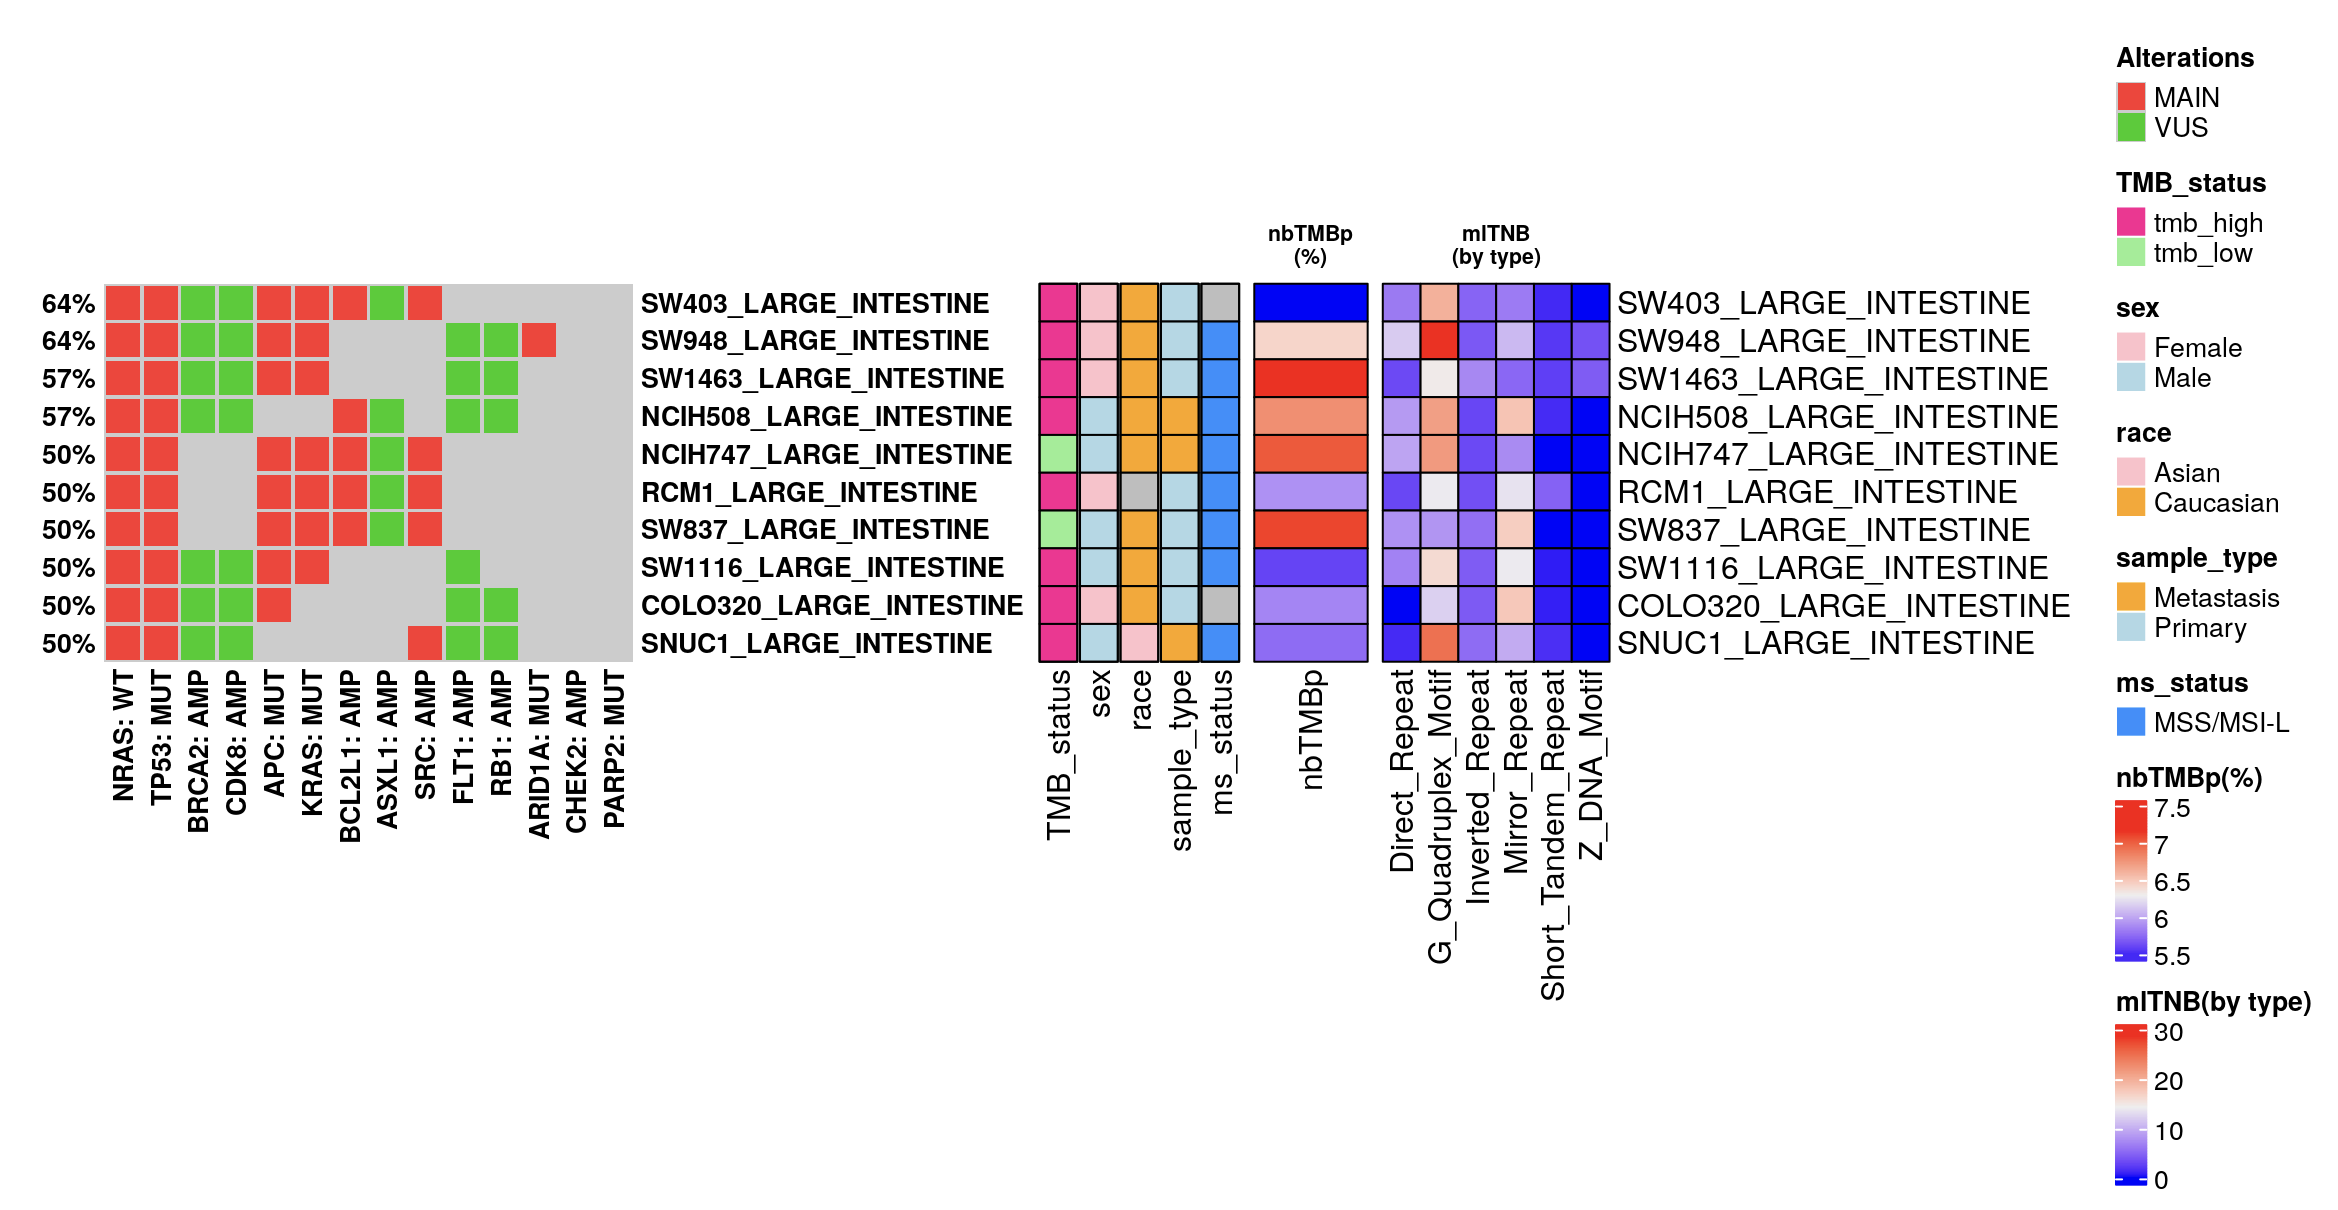
Users can normalize these burden metrics across samples (column-wise) and may incorporate IC50 oncoplot data to investigate the correlation between non-B related burdens and drug sensitivity.