9 Connect your community
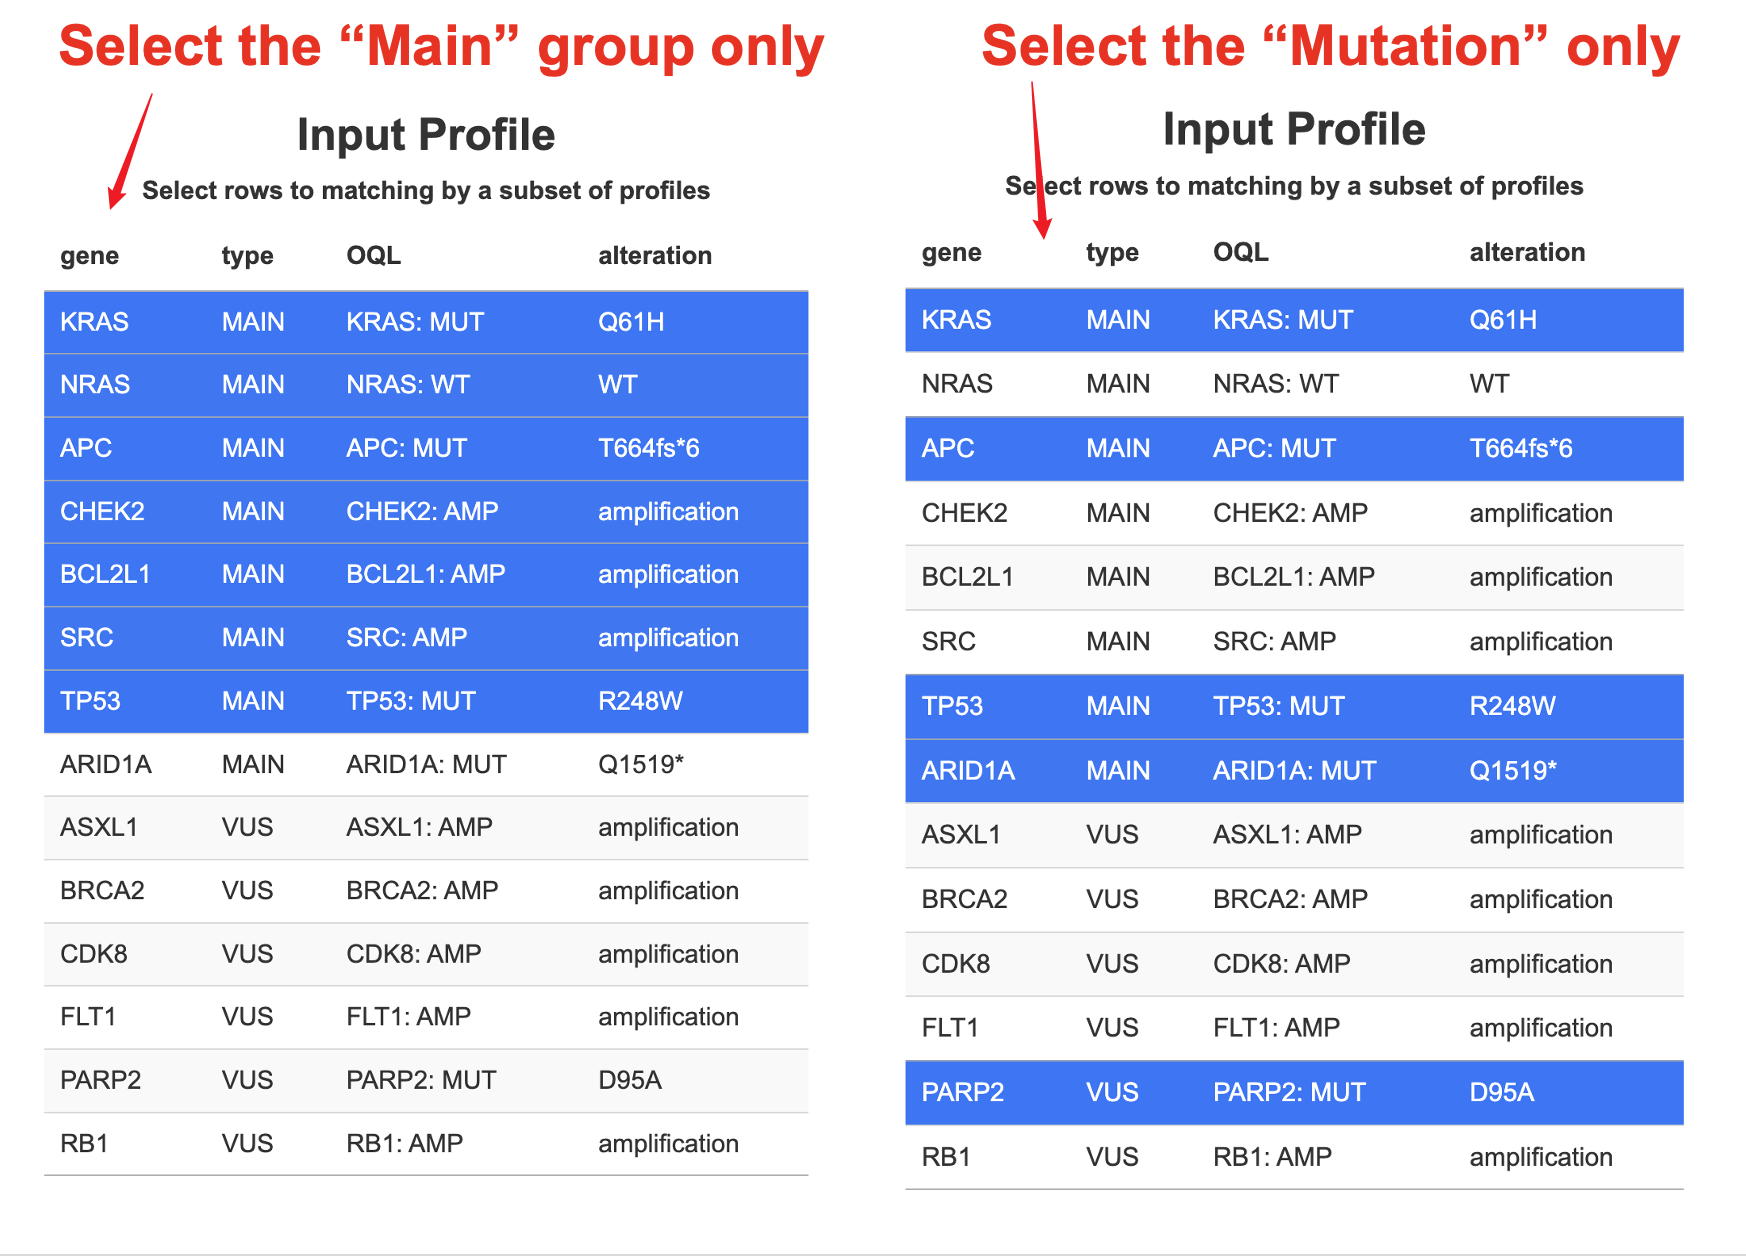
9.1 Patient connecting
Patient connecting (TCGA data). The matching rate is used to evaluate the similarity of samples in the public domain to the patient’s genomic profile from the clinical sequencing
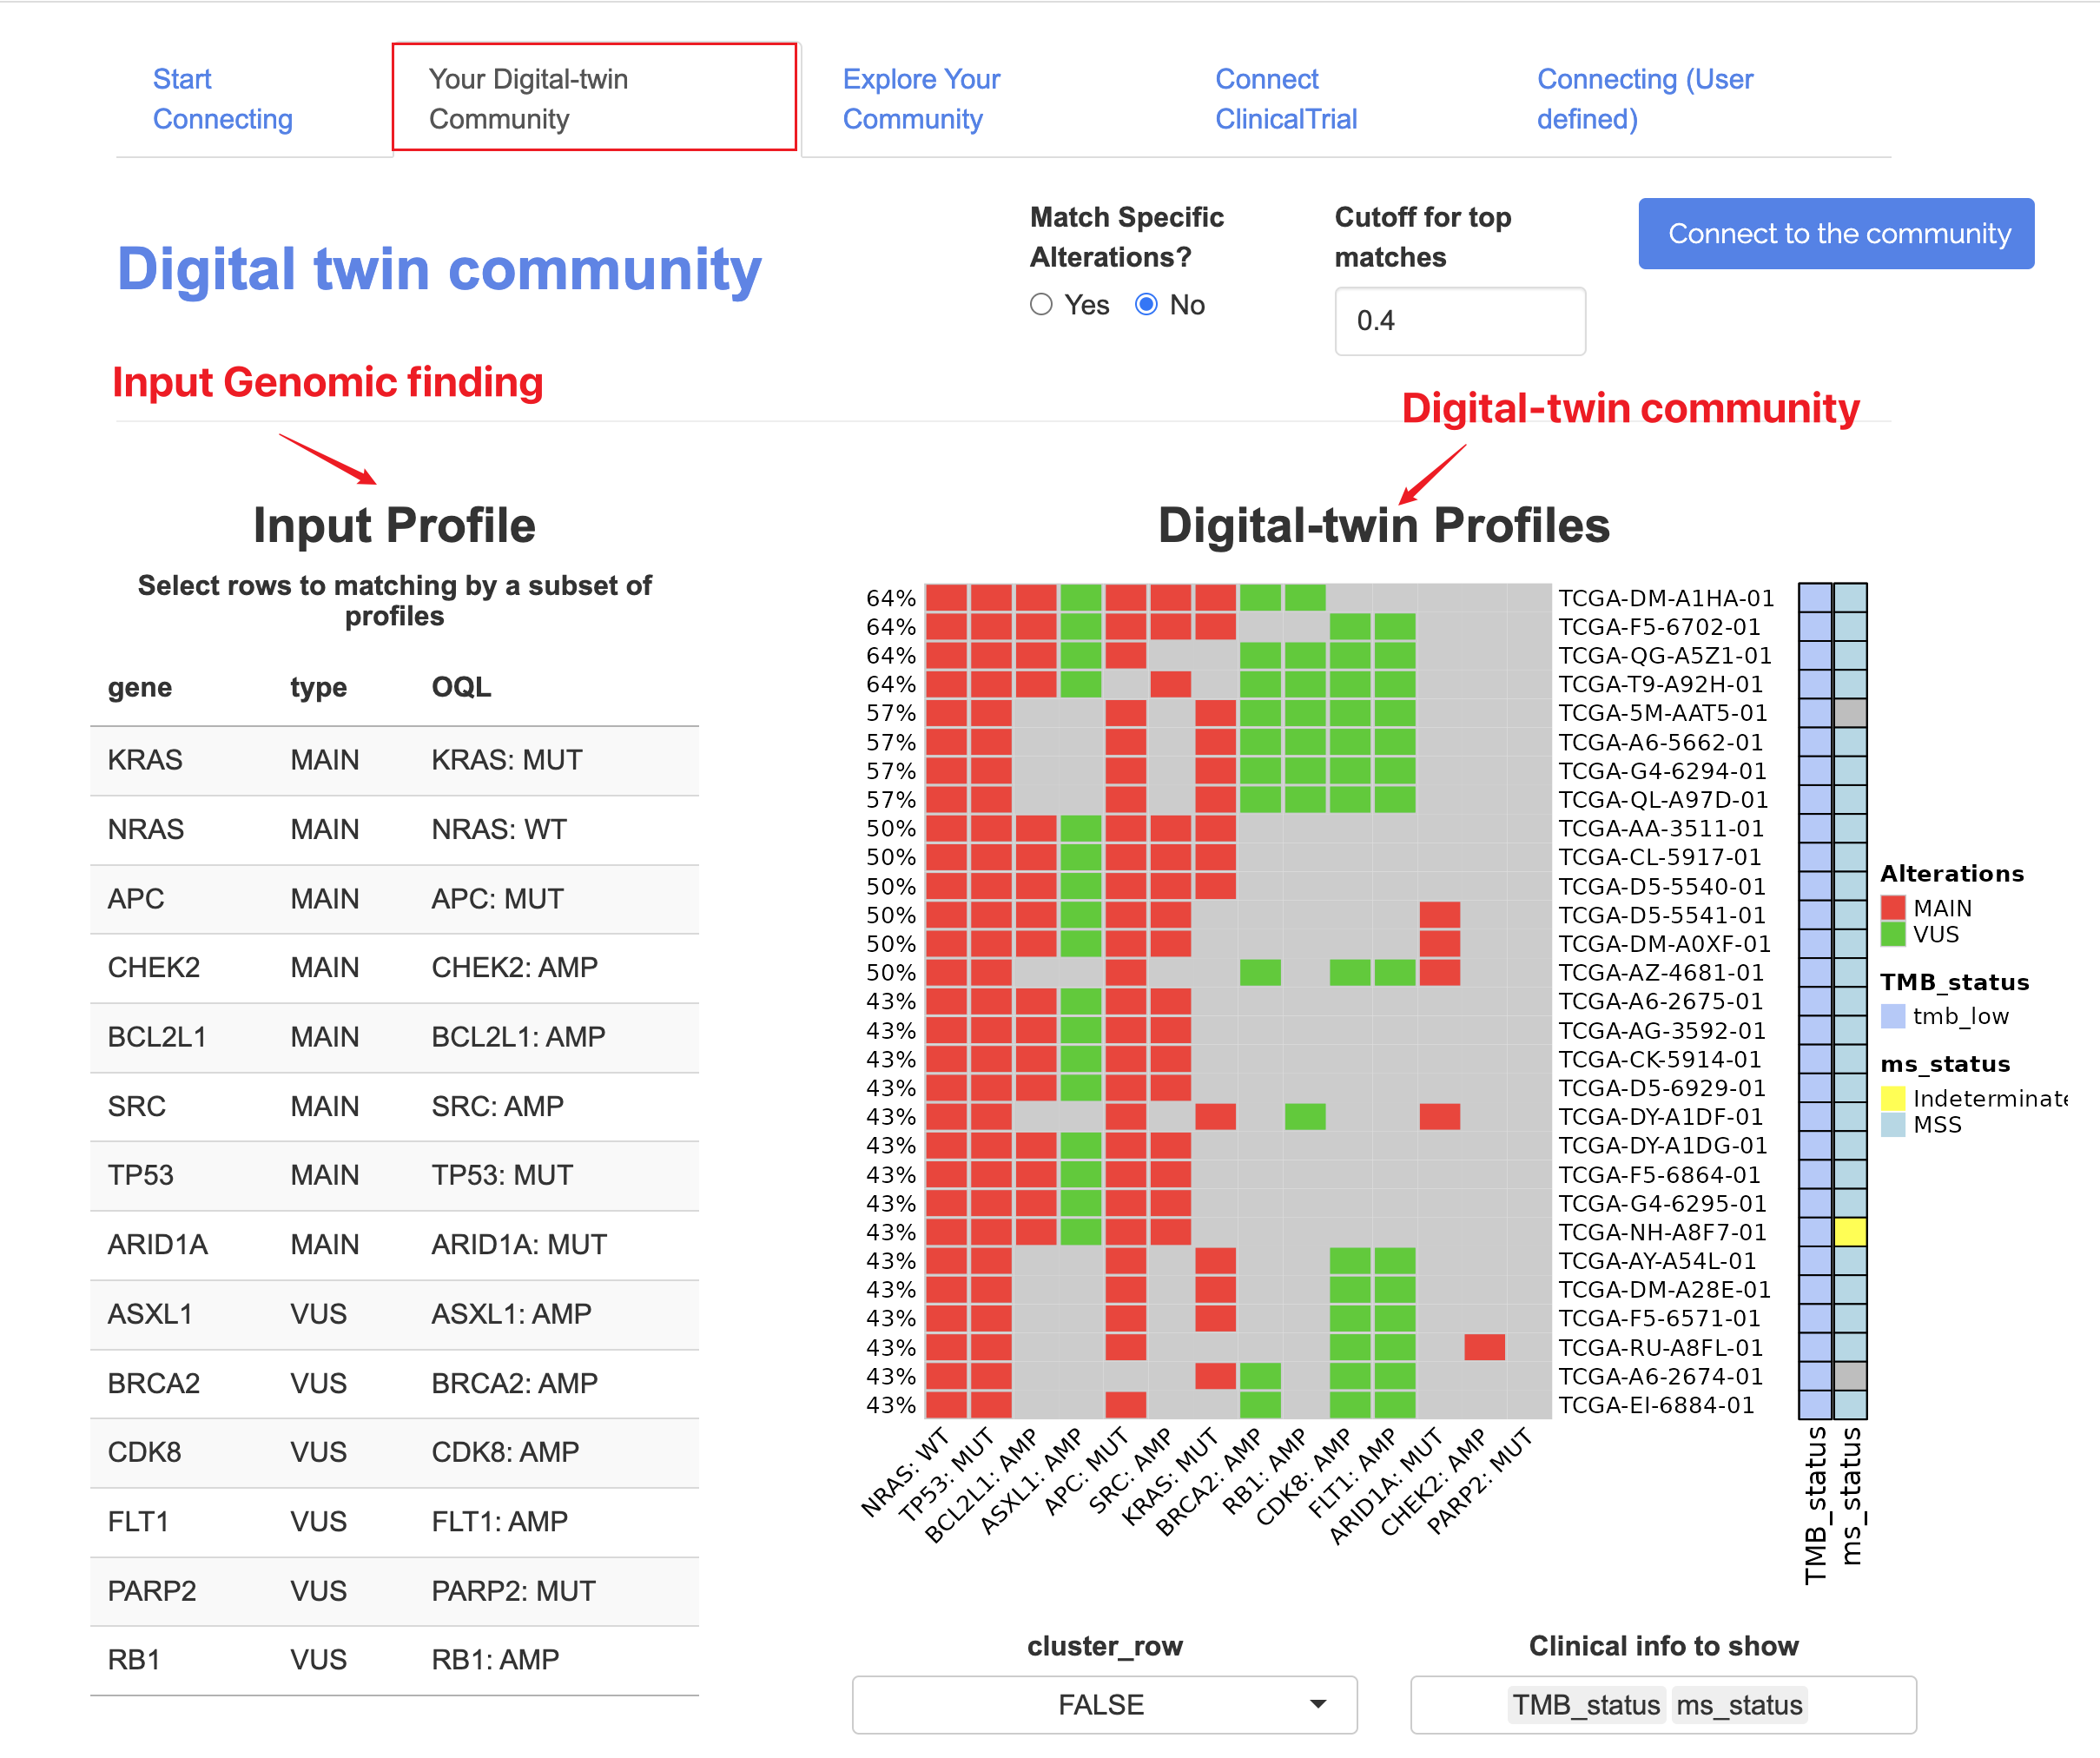
Note: OQLs (Onco query language) represent the gene and which specific types of alterations.
9.1.1 RECO Alterations
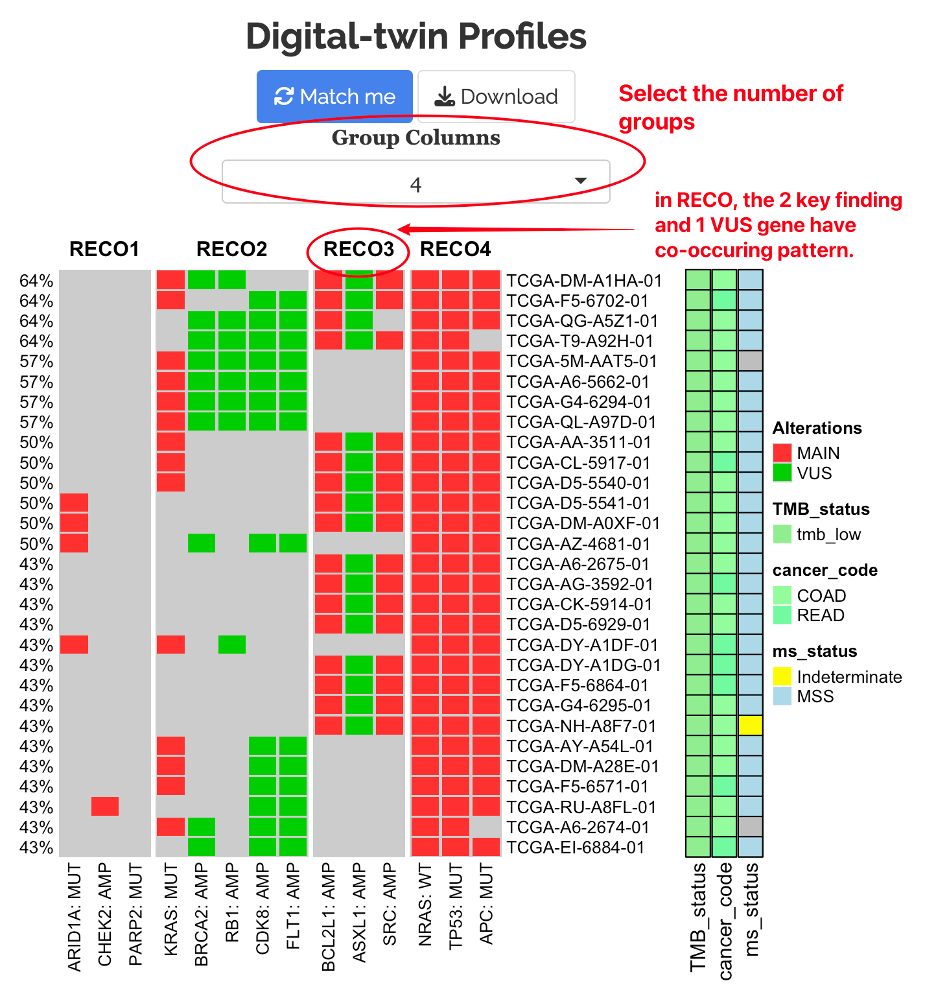
After finding the digital-twin profiles, users can further visualize the recurring and co-occuring (RECO) genomic alteration among the digital twins.
9.1.2 Subset matching
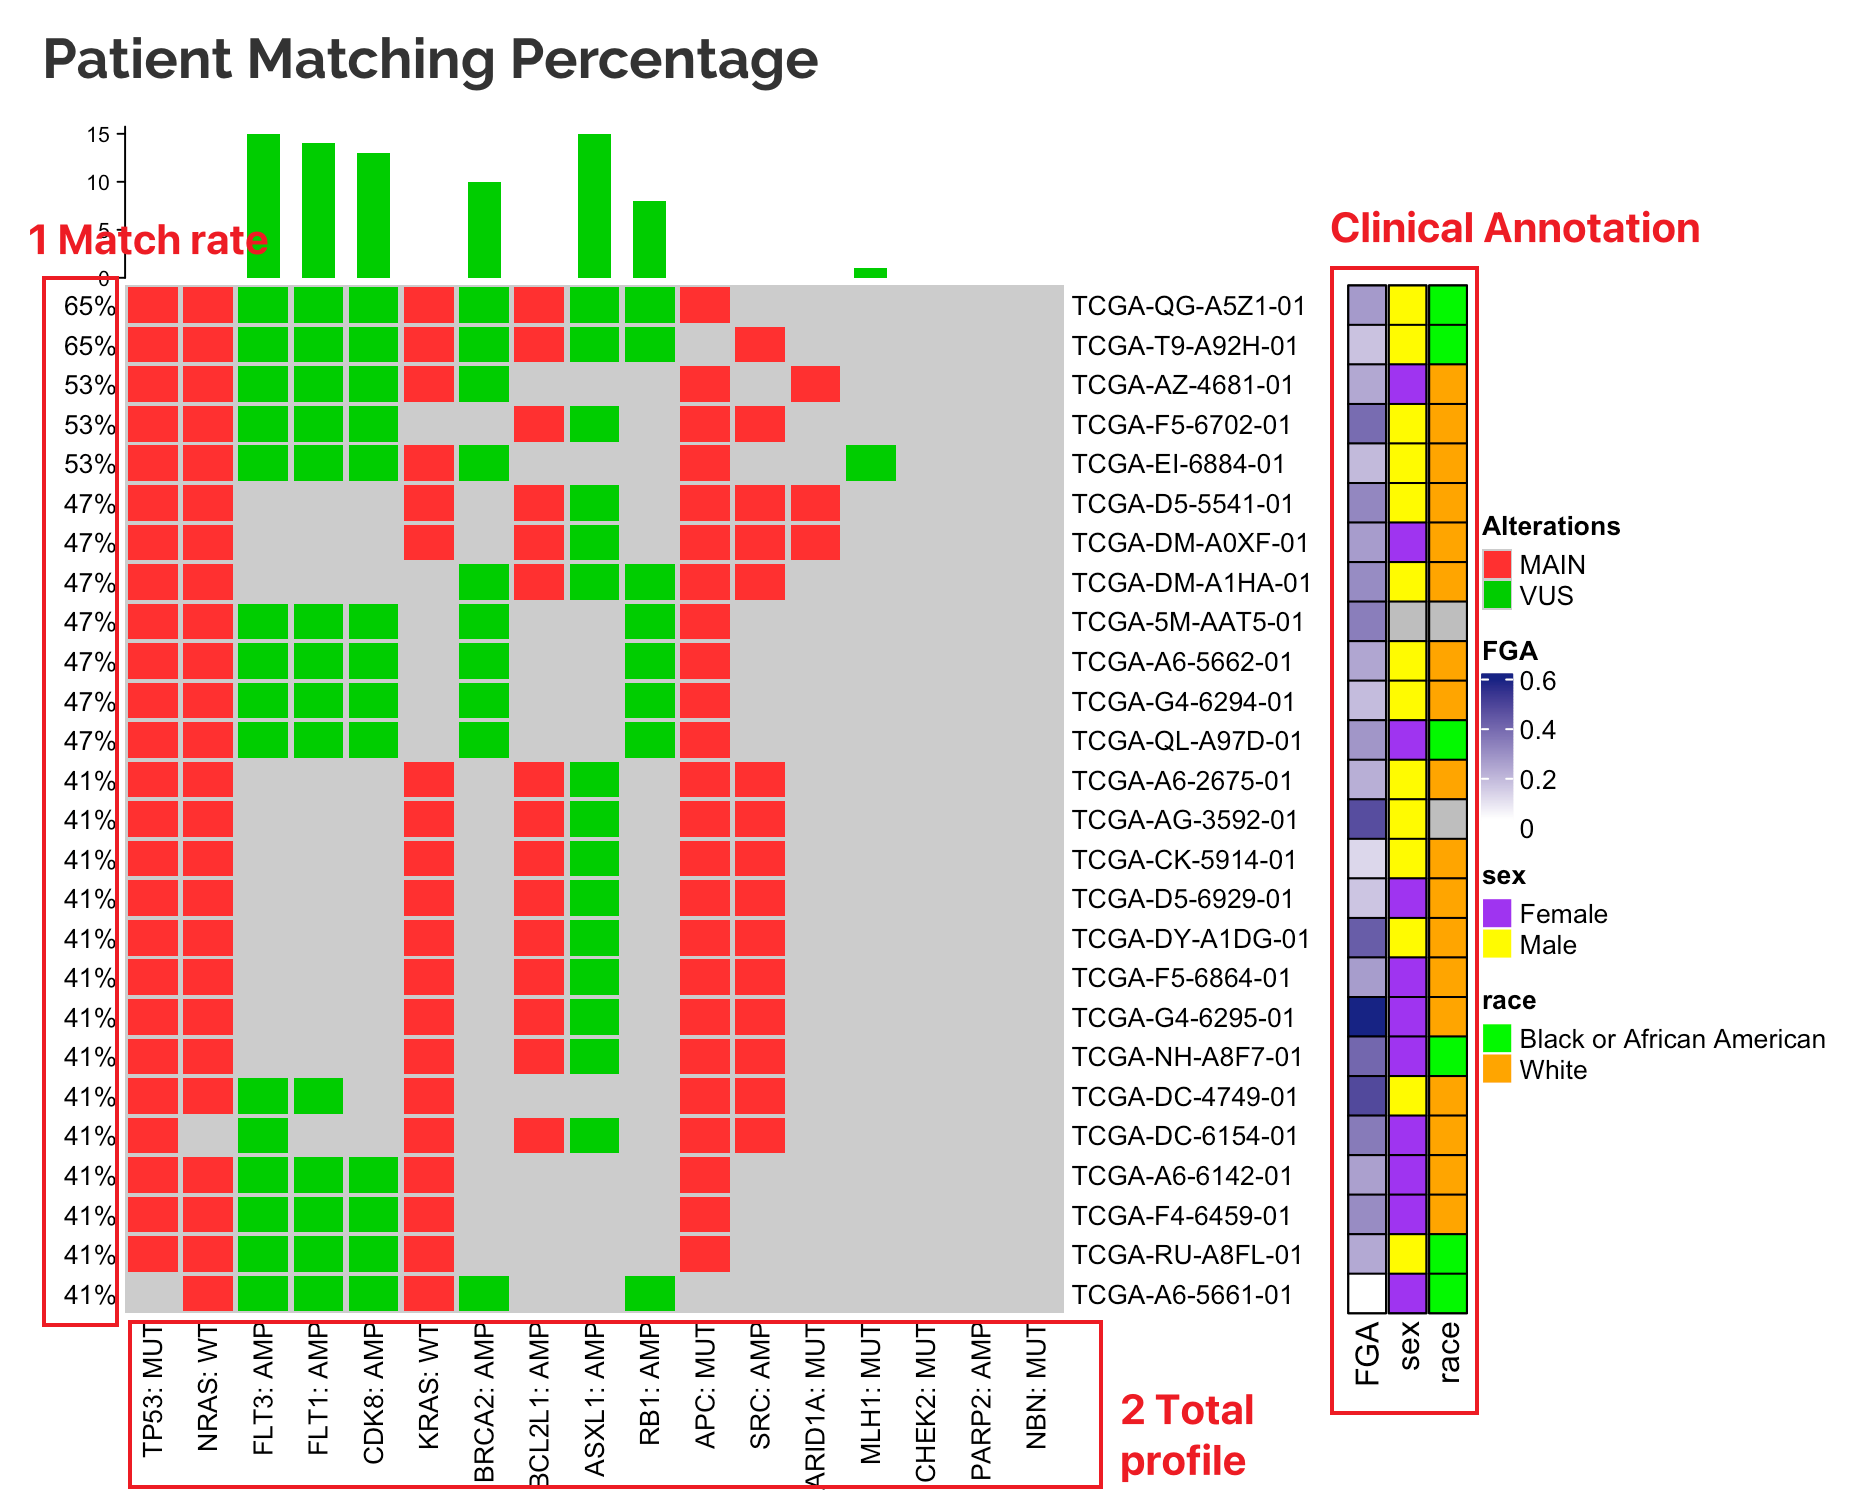
 The figure below includes:
- Matching rate
- Genomic profile (colored red and green to distinguish Main/VUS findings)
- Clinical information on the row for matches samples
9.1.3 Matching threshold
On the sidebar, users can choose the cutoff of matching rates.
For example, if a user chooses to connect their input profile to one TCGA project (e.g. TCGA-COAD, 549 samples), top N samples with highest matched rate (overlapped alterations with the input profile) will be grouped as “matched” (samples with tied rate will all be included by default).

Note:
Matched: samples with high percent matched profiles in the "Profile connecting" module; (thresholds can be set by users)Unmatched(Others): samples with low percent matched profiles.
9.1.4 Precise Matching
Precise Matching by specific mutations. In the input profile, users can also include the “amino acid change” for each mutation under the “alteration” columns.
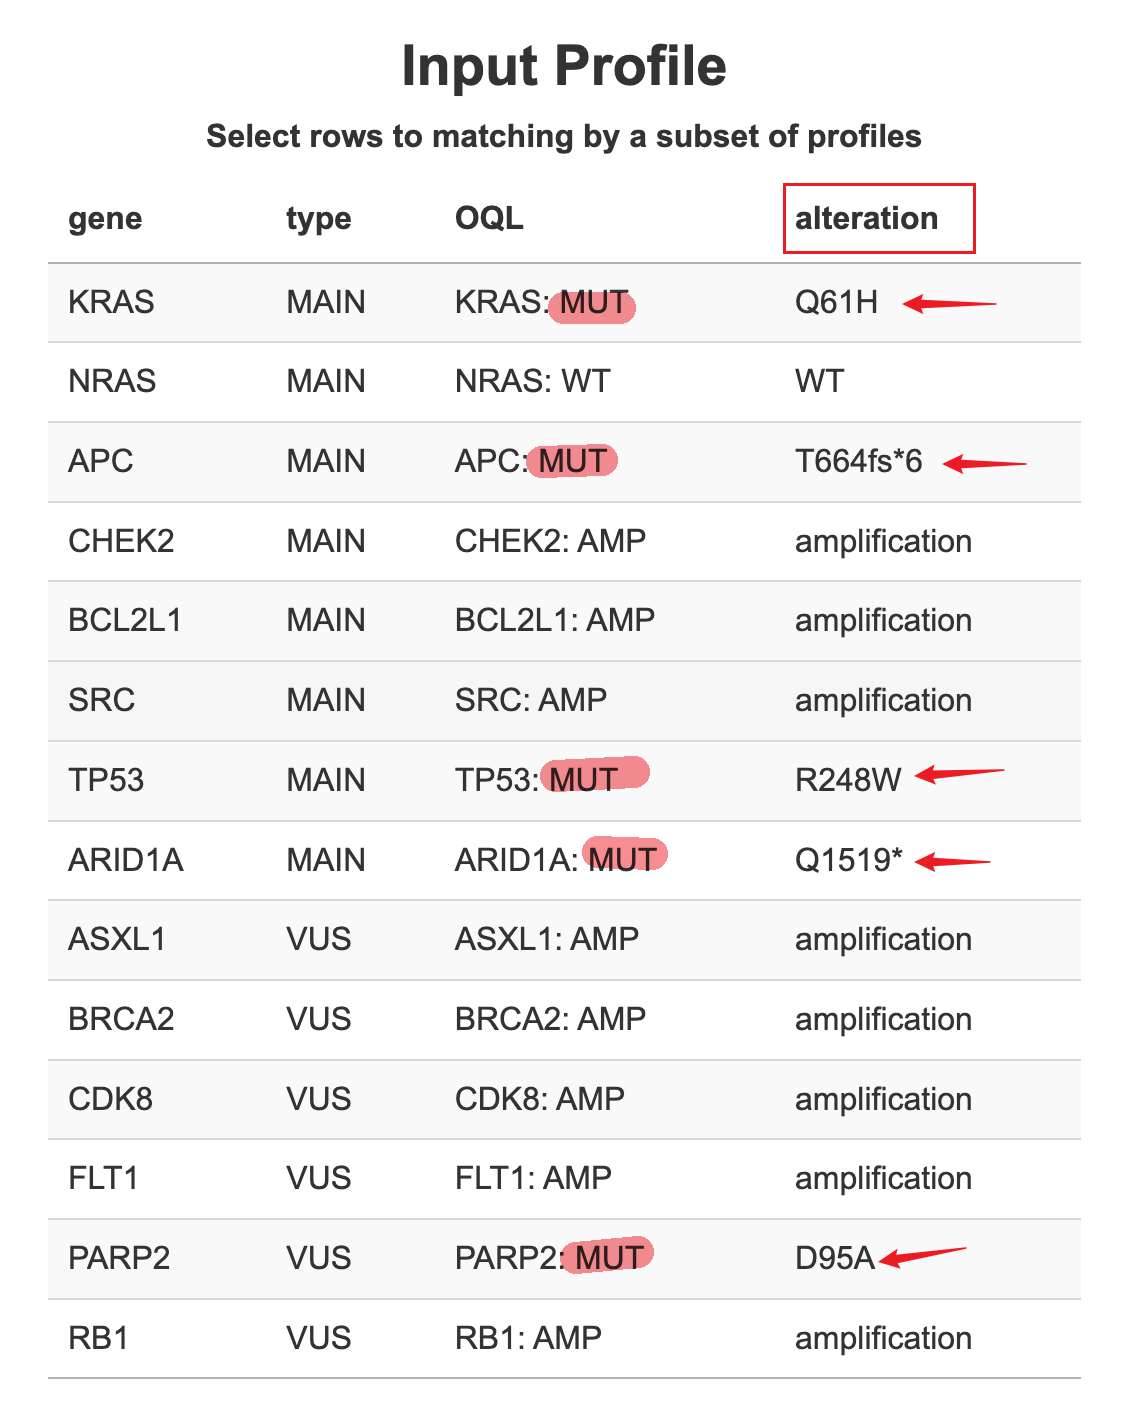
By default, the connecting function will match the profiles by gene symbol and alteration type (MUT or AMP or LOSS). Typically it forms OQLs (Onco query language) for query requests.
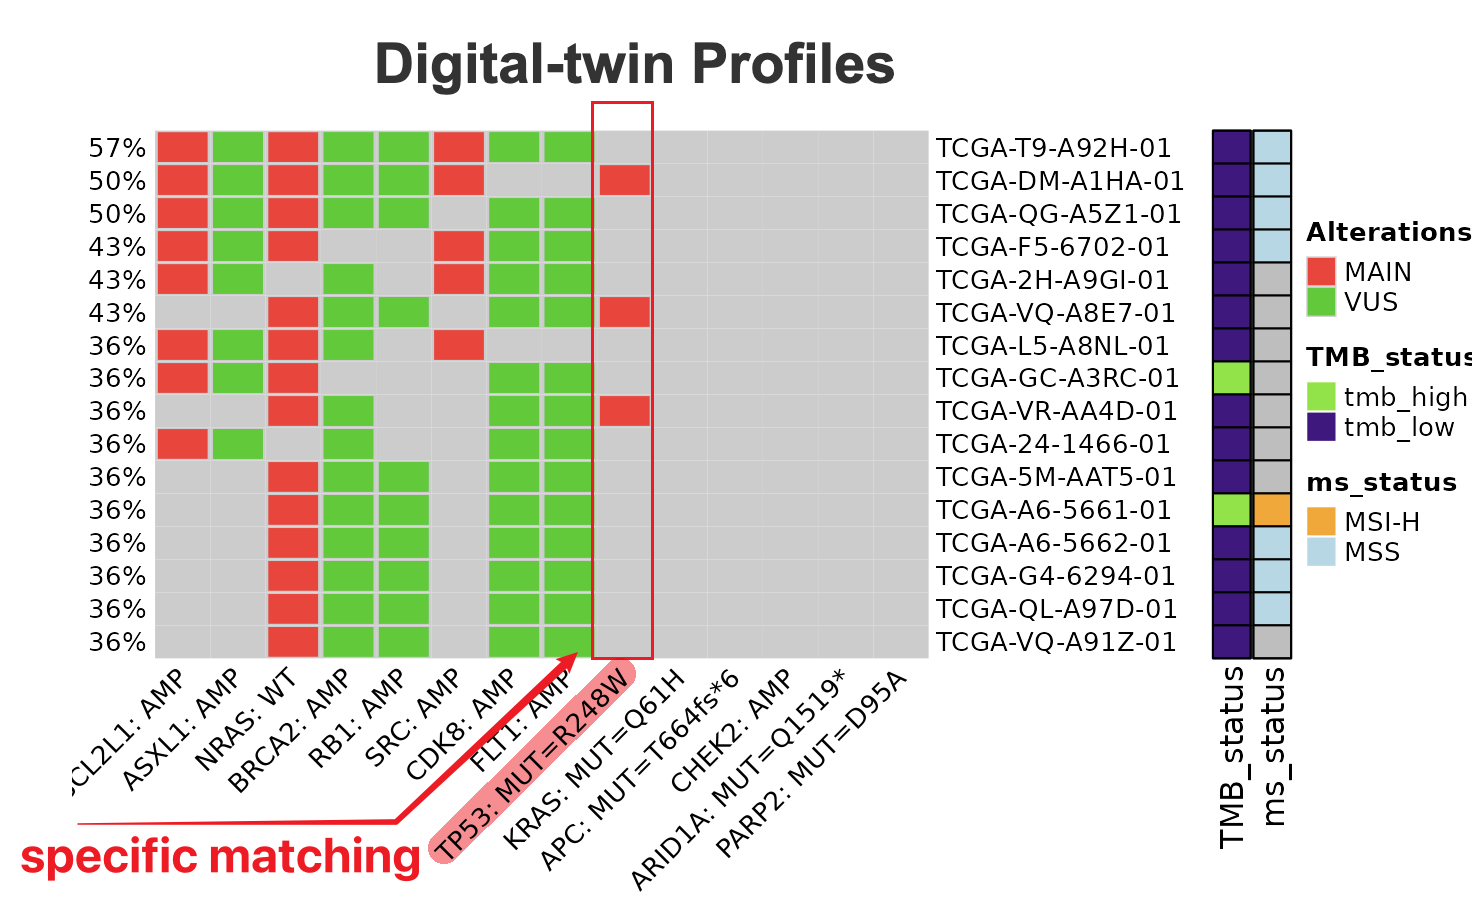
But we provide options for users to match more specifically by both OQL and alterations. For example, instead of matching profiles by TP53 mutation, the function will look for profiles with TP53 mutation that is exactly “R248W” AA changes.

The digital twin community based on the matched the profile will look similar to below:
9.2 Other matching
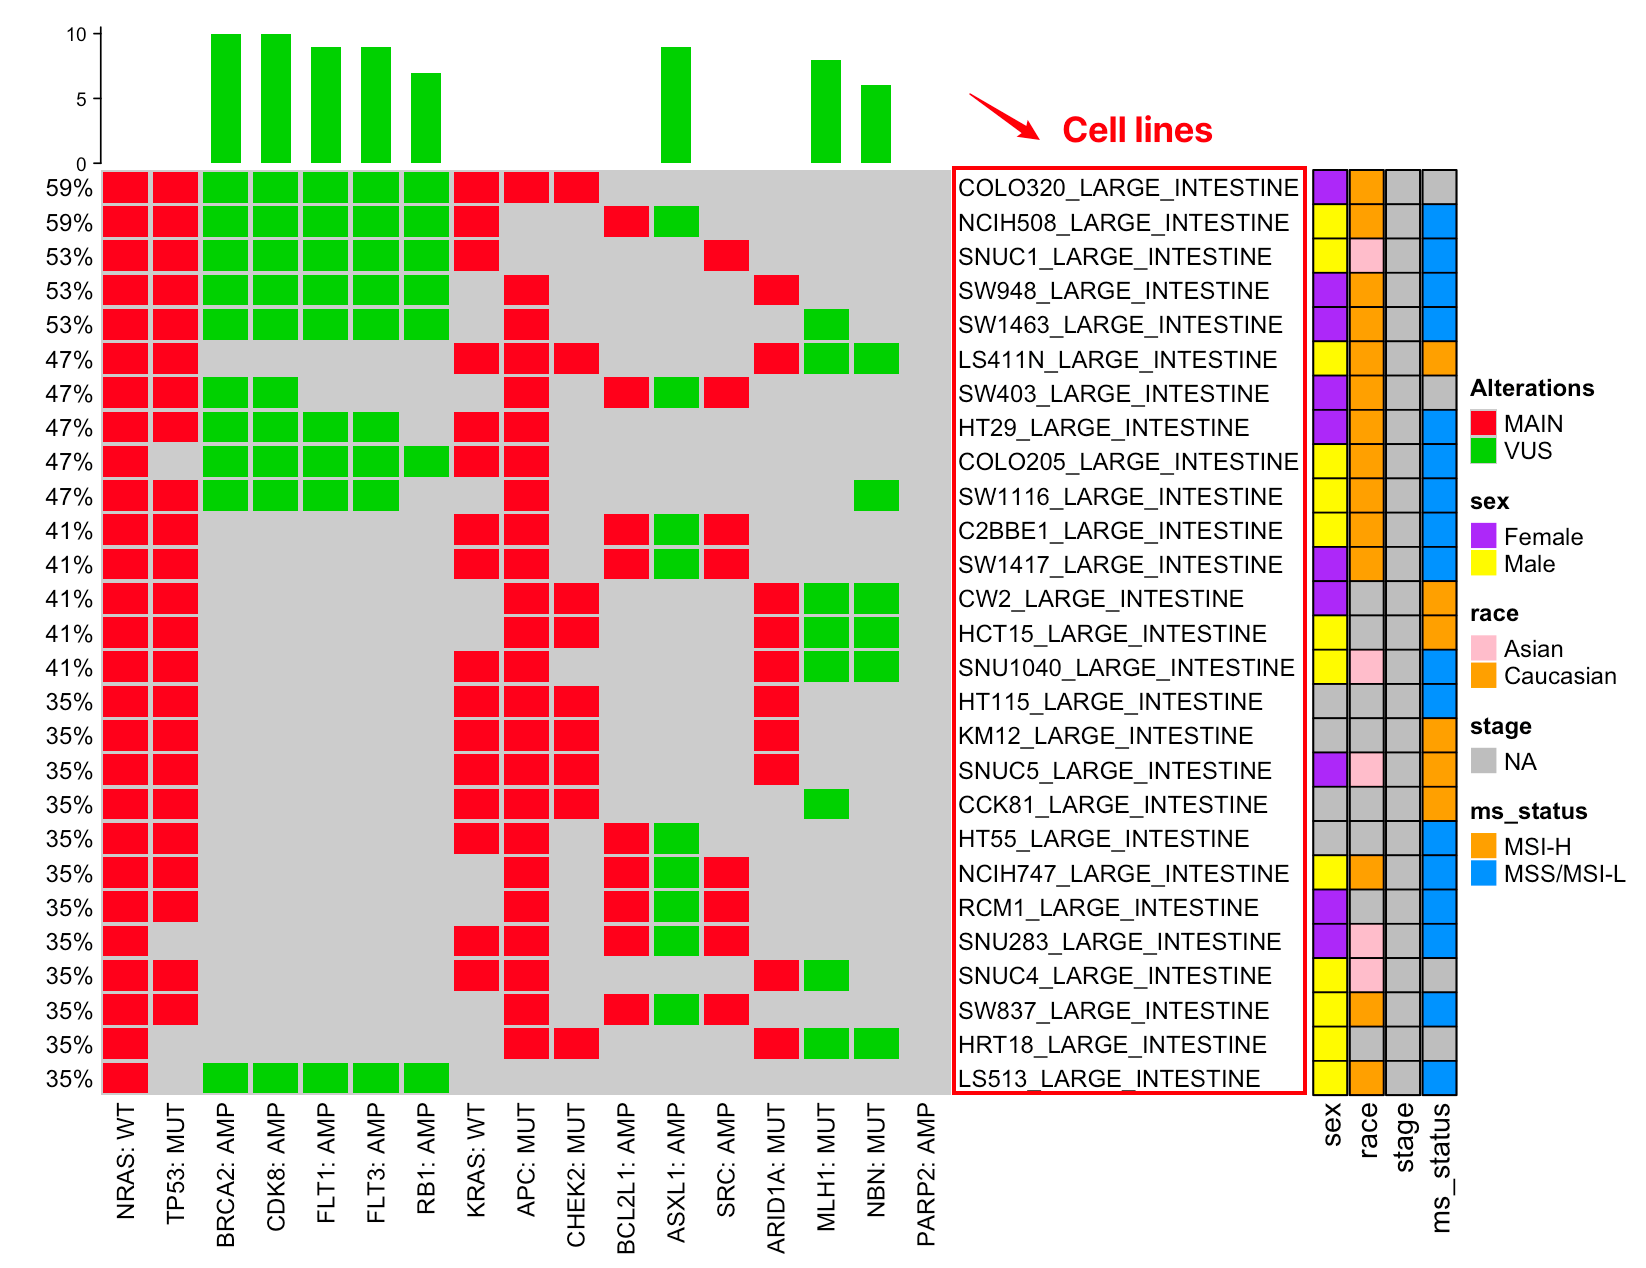
myCMIE also supports: - Cell line matching - Hybrid matching - Biomarker matching
9.2.0.1 Cell line matching
9.2.0.2 Hybrid matching
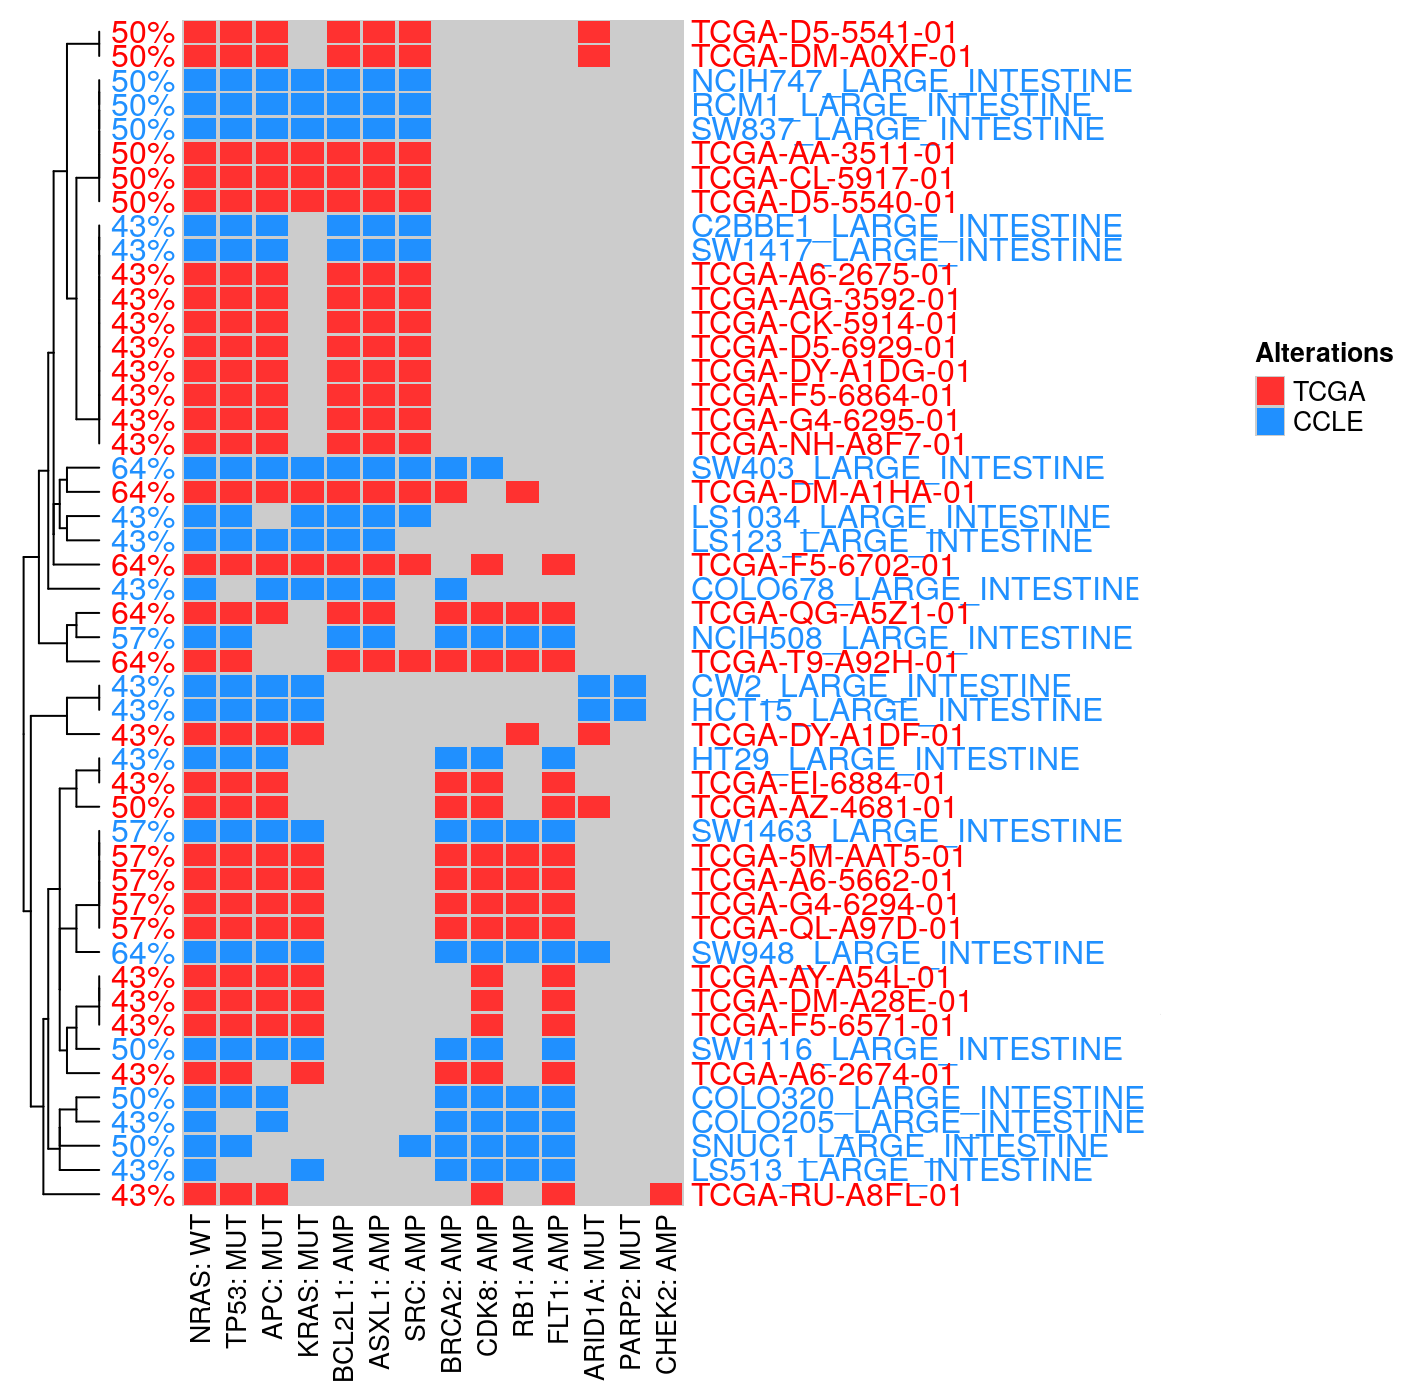
Hybrid Connecting (TCGA & CCLE). This module connects the profiles of TCGA patient samples and CCLE cell lines.
By doing so, we are trying to connect the available unique features for each data group, such as mutation clonality from TCGA and drug sensitivity from CCLE.
9.2.0.3 Biomarker matching
How to use TMB and MSS information.
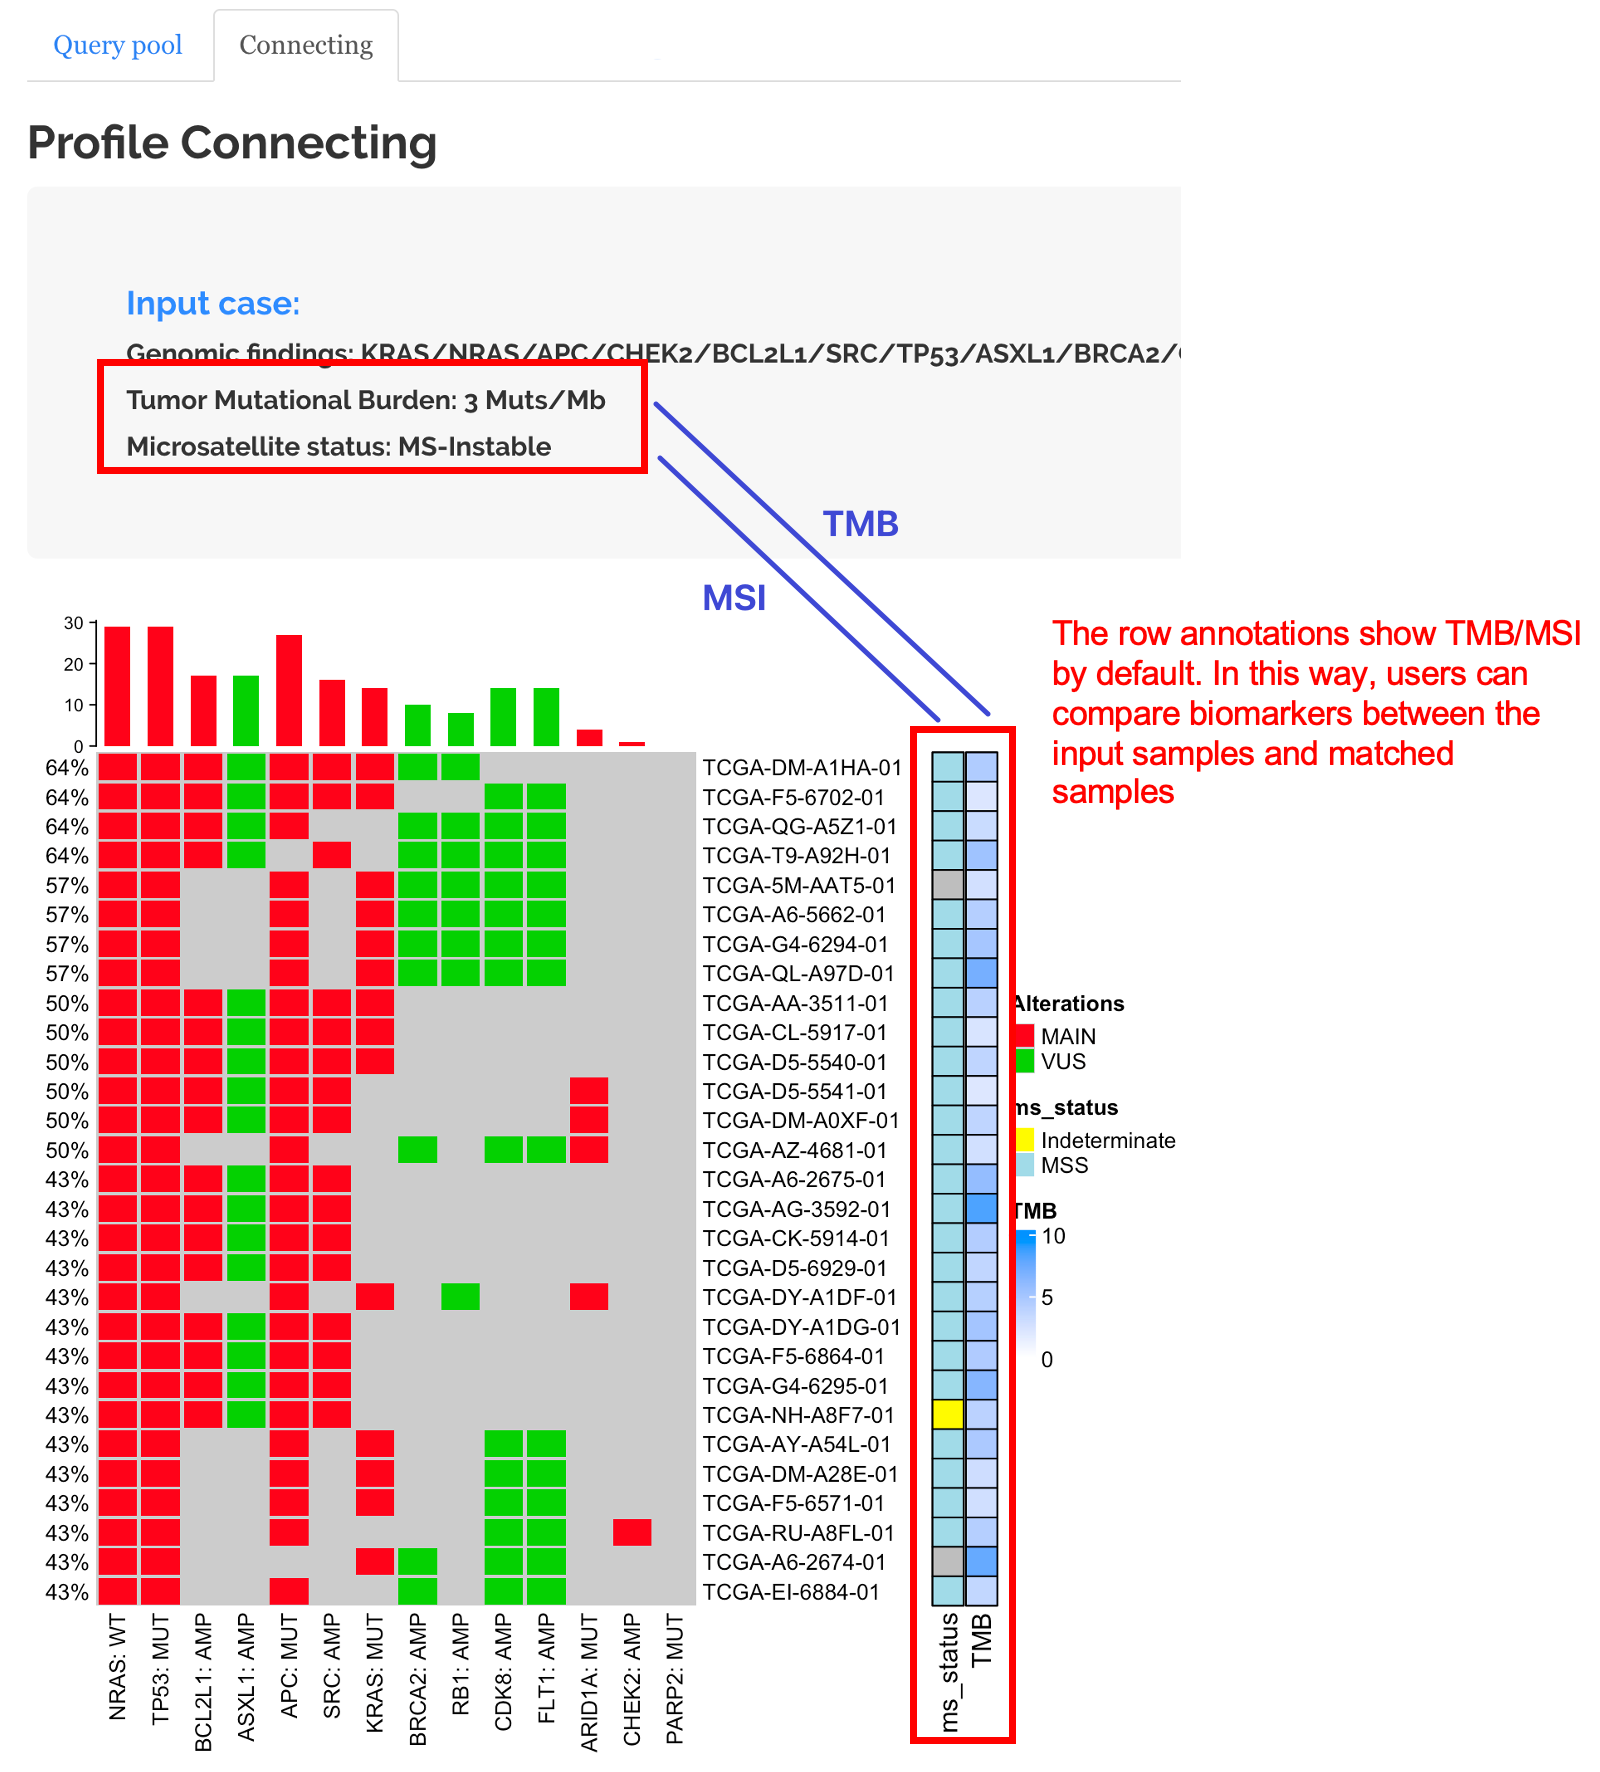
The profile connecting module also allows Biomarker-informed exploratory profile connection from two perspectives:
From the query pool: Build a query pool filtered by biomarker statuses.
From the heatmap: Compare the biomarker statuses between the input and connected profiles.
9.2.0.4 From the query pool
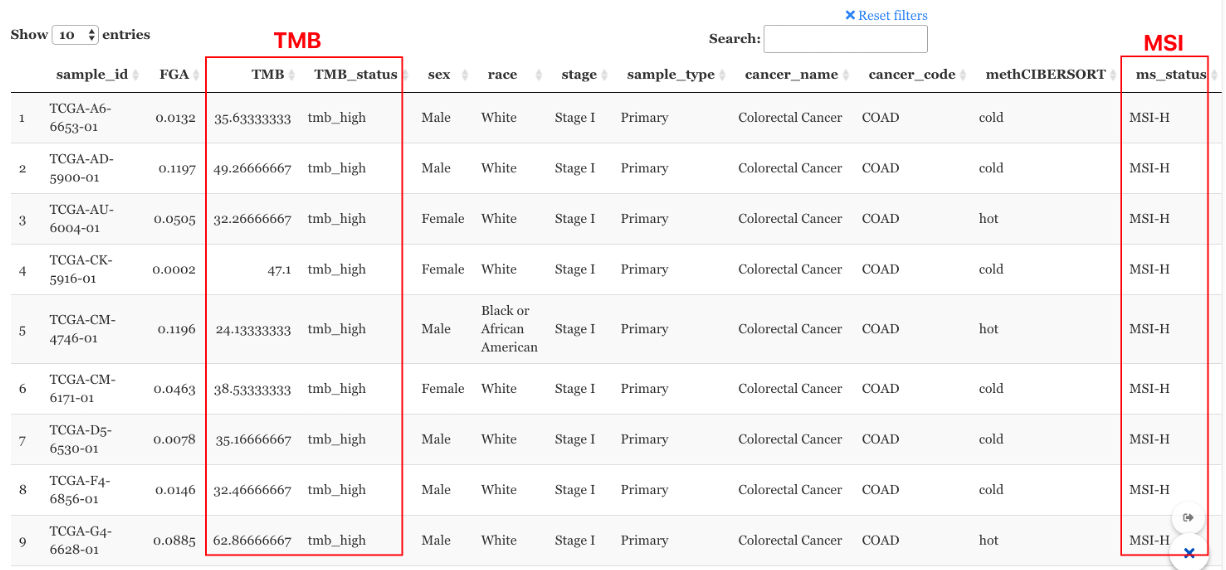
Before running the profile connecting, under the “Query pool” tag, users can filter the samples by cancer types, TMB status, and Micro-satellite status based on their input data. In this way, all the connected profiles in the next step will be in the scope of the same biomarker patients/cell lines

Example:
