1.3 Using RStduio
After the installations of both R and RStudio, open the RStudio.
Opening RStudio, you should see something as in Figure 1.7.
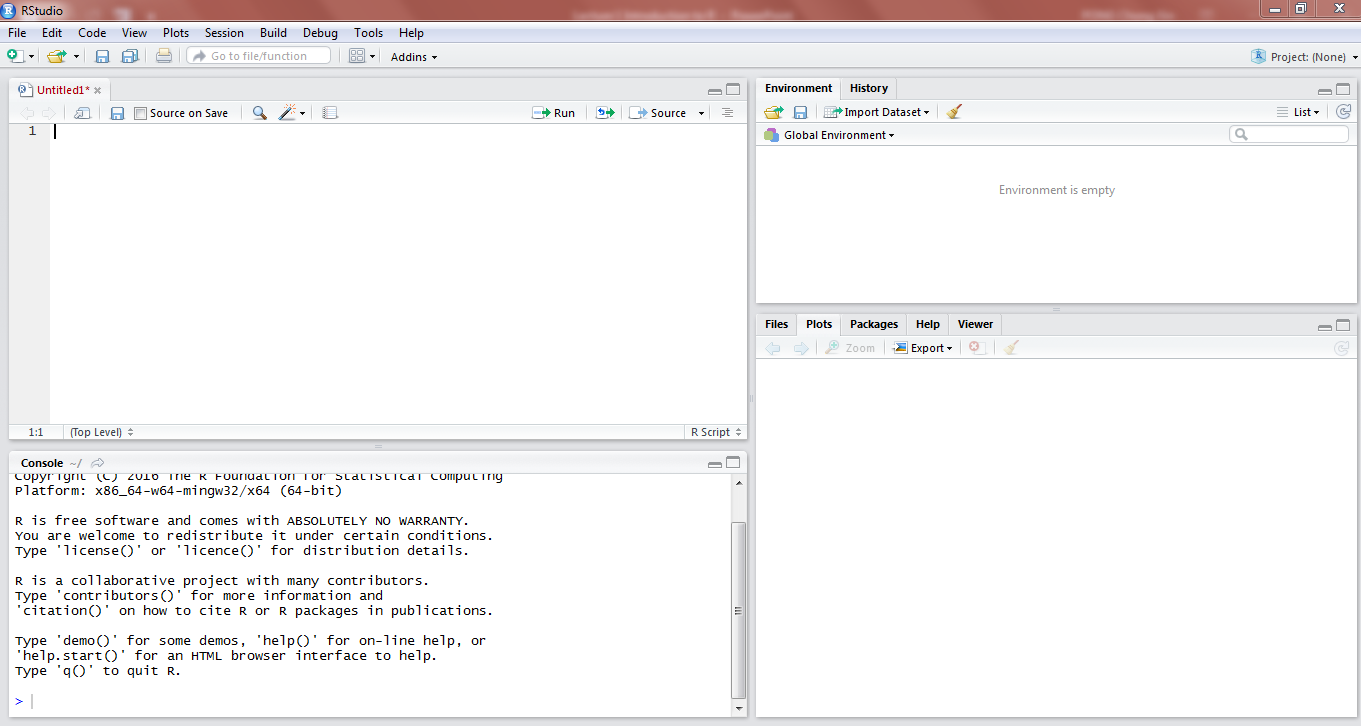
Figure 1.7: RStudio Interface
As in Figure 1.8, there are 2 places where you can enter your code, as highlighted in red.
The top part is called the code editor, where you can type your code, and choose to run it after you finish typing all of it.
You can also type your code in the console, which is below the code editor.
In the console, seeing the `’ symbol means that you are writing a new line of code. You can use the console for calculations, but for coding it is recommended you use the code editor if you wish to edit or reuse the code in future.
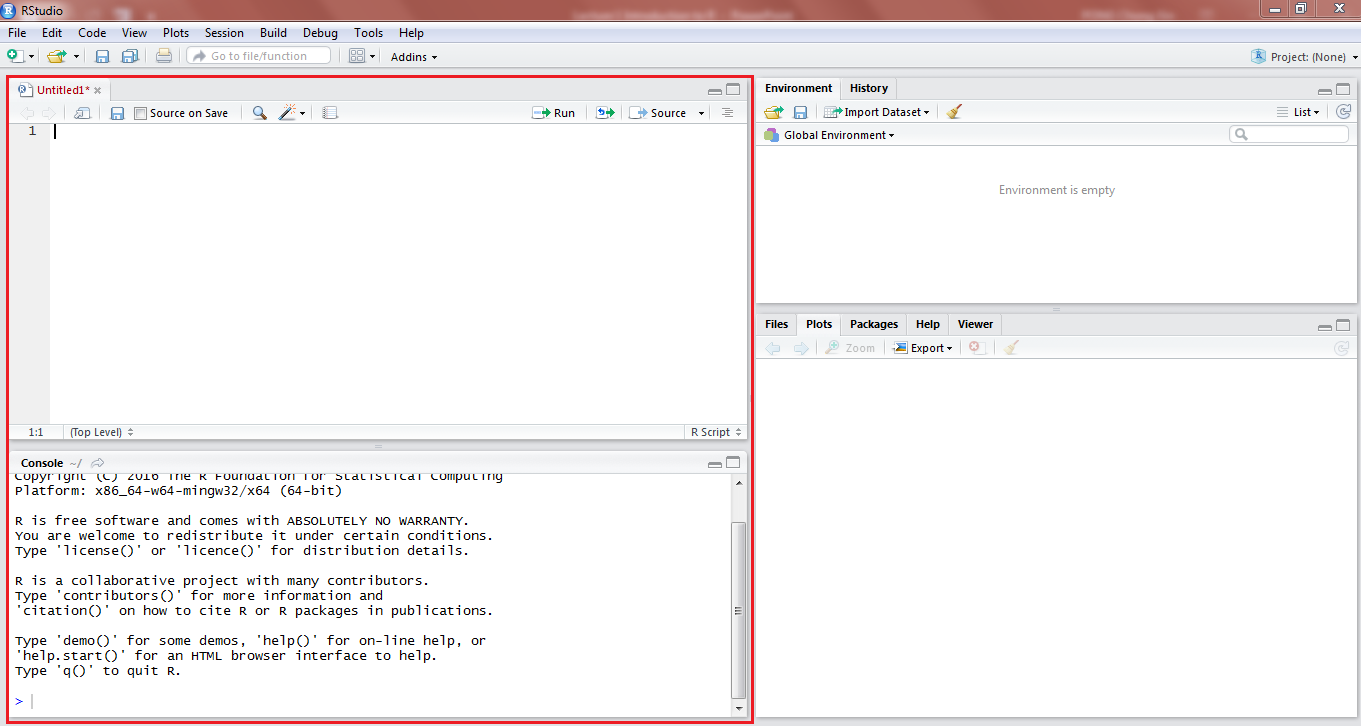
Figure 1.8: RStudio Left
As in Figure 1.9, on the top right hand side, you will see a window called Global Environment. This is where all your data(downloaded data, assigned vectors etc) will be shown. Clicking on a data name in this part will open up the data.
You can also view your history of past commands in the History tab.
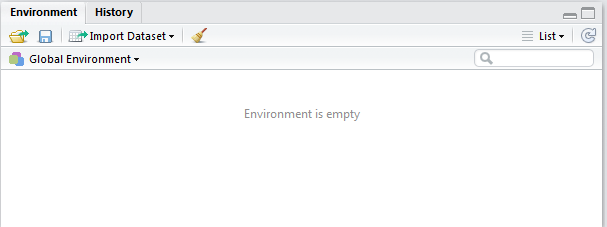
Figure 1.9: RStudio Top right
As in Figure 1.10, at the bottom right hand side, you see this window which shows you the files, viewer, packages, and also the help window.
For this course, we will mainly be using this to view plots/graphs, which will be displayed here when you run the code to generate the graphs.
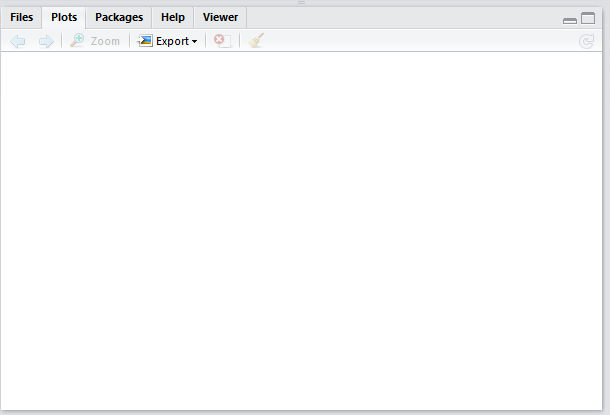
Figure 1.10: RStudio Bottom right