5.9 MACD
Moving average convergence/divergence (MACD) is the difference between a short-period (fast) EMA and a long-period (slow) SMA: \[MACD_t(S,L)=ema_t(P, S)-ema_t(P, L).\]
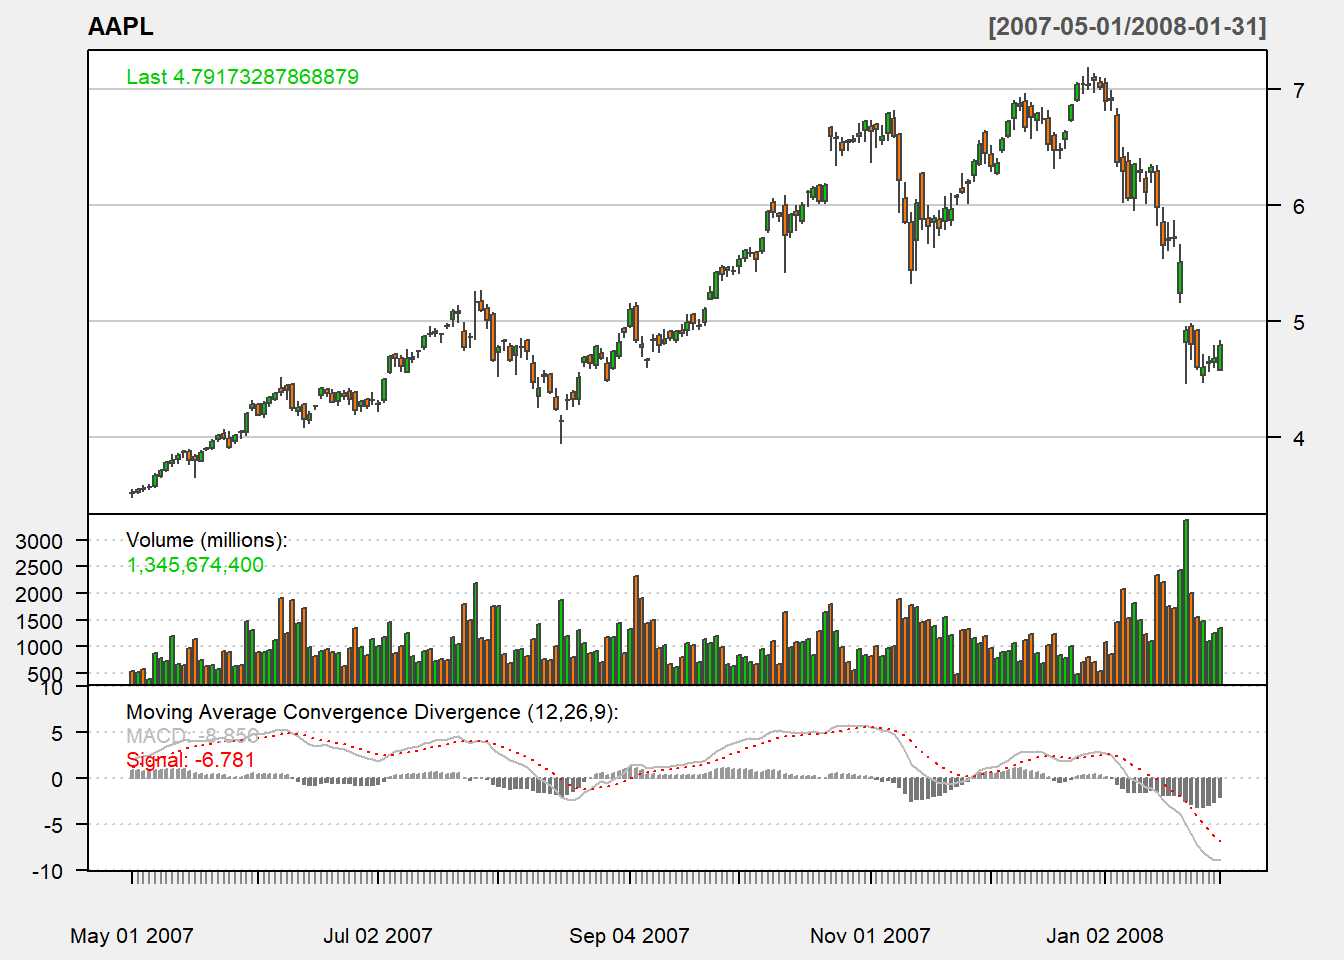
For its usage, we compare it with its exponential smoothed line. This line is called the : \[sig_{t}(S,L,K)=ema_t(MACD(S,L), K).\] Usually, \(K=9\) days, \(S=12\) days and \(L=26\) days. Note that MACD sometimes appear as the percetnage format \[MACD_t(S,L)= ema_t(P, S)-ema_t(P, L))/ema_t(P, L).\]
Here is the short code for MACD:
myMACD <- function (price,S,L,K){
  MACD <- EMA(price,S) - EMA(price,L)
  signal <- EMA(MACD,K)
  output <- cbind(MACD,signal)
  colnames(output) <- c("MACD","signal")
  return(output)
}
Let us apply our code:
##                  MACD     signal
## 2012-12-21 -0.5521694 -0.5180912
## 2012-12-24 -0.5445377 -0.5233805
## 2012-12-26 -0.5527802 -0.5292604
## 2012-12-27 -0.5470695 -0.5328222
## 2012-12-28 -0.5519451 -0.5366468
5.9.1 TTR
We use MACD function in TTR package:
##                  macd     signal
## 2012-12-21 -0.5521694 -0.5180912
## 2012-12-24 -0.5445377 -0.5233805
## 2012-12-26 -0.5527802 -0.5292604
## 2012-12-27 -0.5470695 -0.5328222
## 2012-12-28 -0.5519451 -0.5366468
where nFast, nSlow, and nSig are S, L, and K in our formula. The percent is whether MACD is in percentage form or in difference form.
5.9.2 Trading signal
Buy signal arises when MACD crosses from below to above the signal line.
Sell signal arrises when MACD crosses from above to below the signal line.