5.11 TTR
In the TTR package, we can use RSI() function:
##                 rsi
## 2012-12-26 38.85768
## 2012-12-27 35.28442
## 2012-12-28 38.26621
Note that the third input is a function. You may use SMA or EMA.
Further notice that this is different from what we have above. It is because their upward and downward indicators use numerical values instead:
\[U_{t}=\left\{ \begin{array}{cl} P_t-P_{t-1}, & P_t>P_{t-1} \\ 0, & P_t \leq P_{t-1} \end{array} \right. \] and \[ D_{t}=\left\{ \begin{array}{cl} 0, & P_t\geq P_{t-1} \\ P_{t-1}-P_{t}, & P_t < P_{t-1} \end{array} \right. \]
Hence, we need to modify our code:
myRSI <- function (price,n){
  N <- length(price)
  U <- rep(0,N)
  D <- rep(0,N)
  rsi <- rep(NA,N)
  Lprice <- Lag(price,1)
  for (i in 2:N){
    if (price[i]>=Lprice[i]){
      U[i] <- price[i]- Lprice[i]
    } else{
      D[i] <- Lprice[i]- price[i]
    }
    if (i>n){
      AvgUp <- mean(U[(i-n+1):i])
      AvgDn <- mean(D[(i-n+1):i])
      rsi[i] <- AvgUp/(AvgUp+AvgDn)*100
      }
    }
  rsi <- reclass(rsi, price)
  return(rsi)
}
Now we can see that we have the same result:
##                [,1]
## 2012-12-26 38.85768
## 2012-12-27 35.28442
## 2012-12-28 38.26621
5.11.1 Trading signal
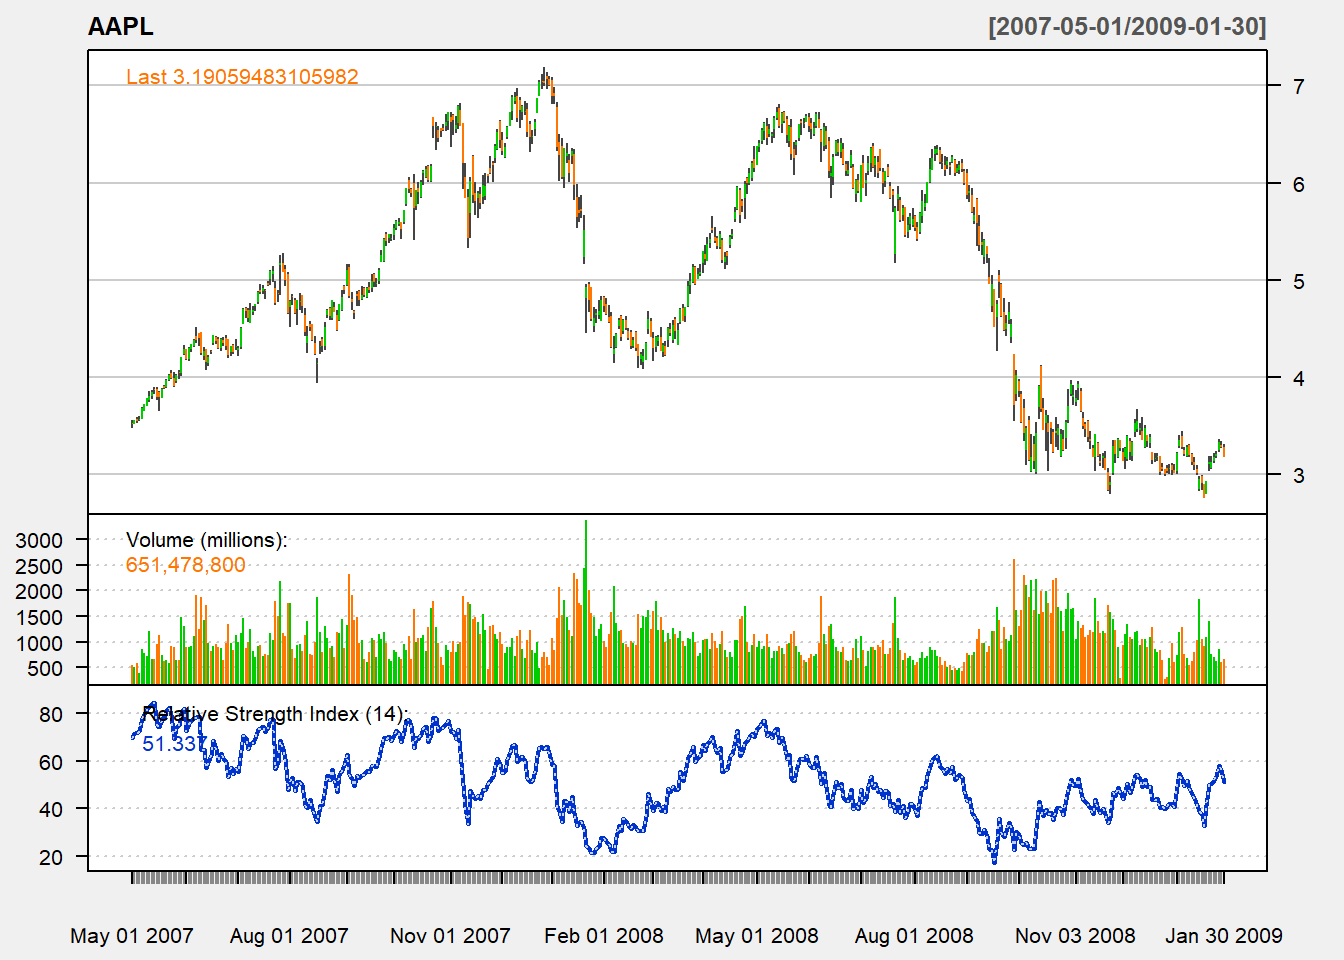
Buy signal arises when RSI is less than 30.
Sell signal arrises when RSI is higher than 30.