6.9 Two in a row
Two in a row patterns are 2-day patterns. It is completely opposite of engulfing or harami patterns. The real bodies of two day candles are completely disjoint.
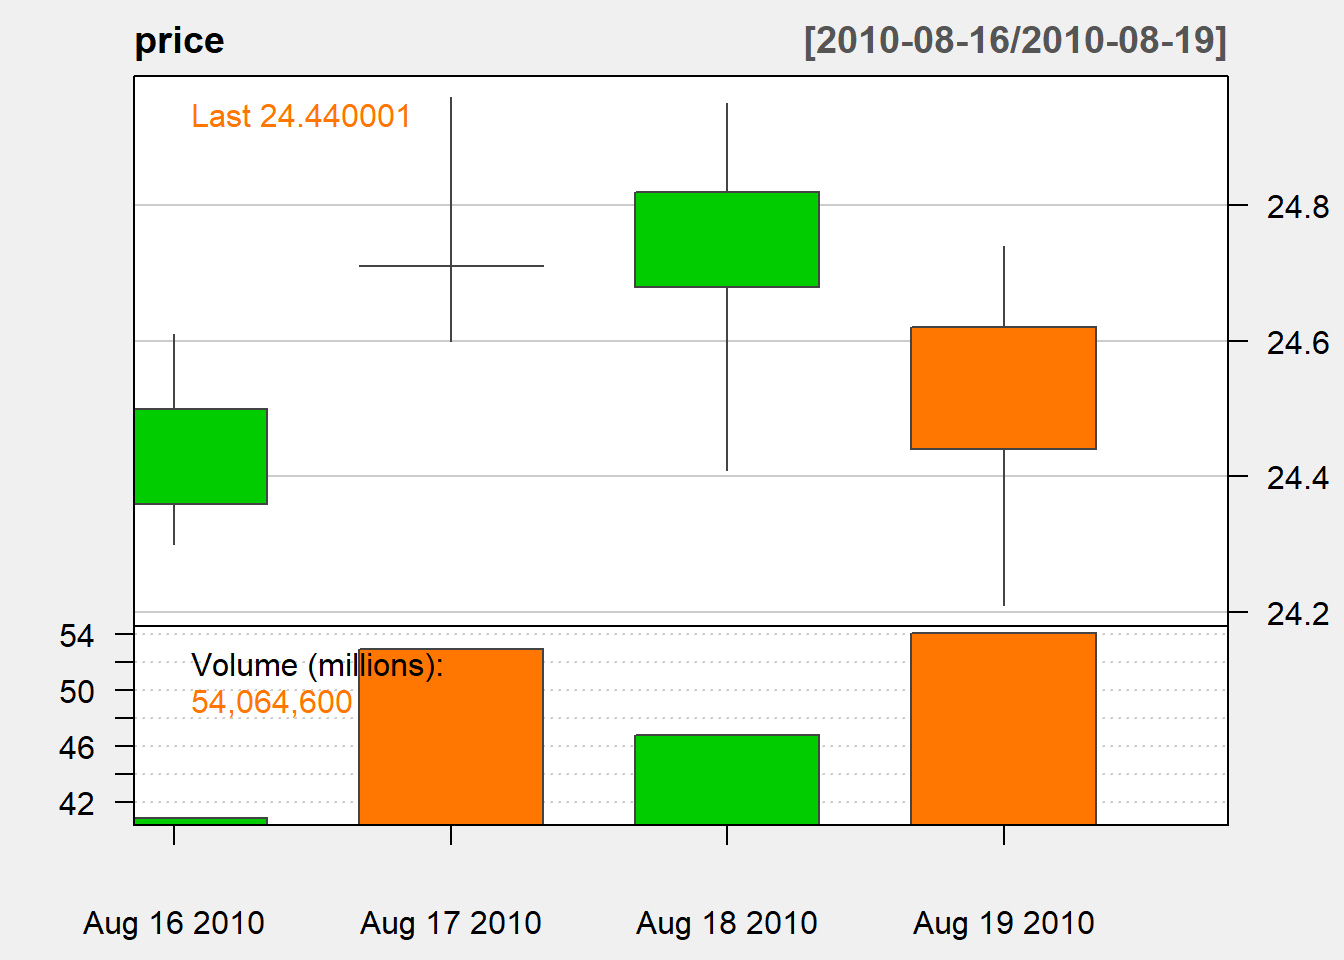
6.9.1 Kicking up
Bullish signal:
- bearish candle on day 1
- bullish candle on day 2
- gap up between day 1 and day 2
Here is an exmample:
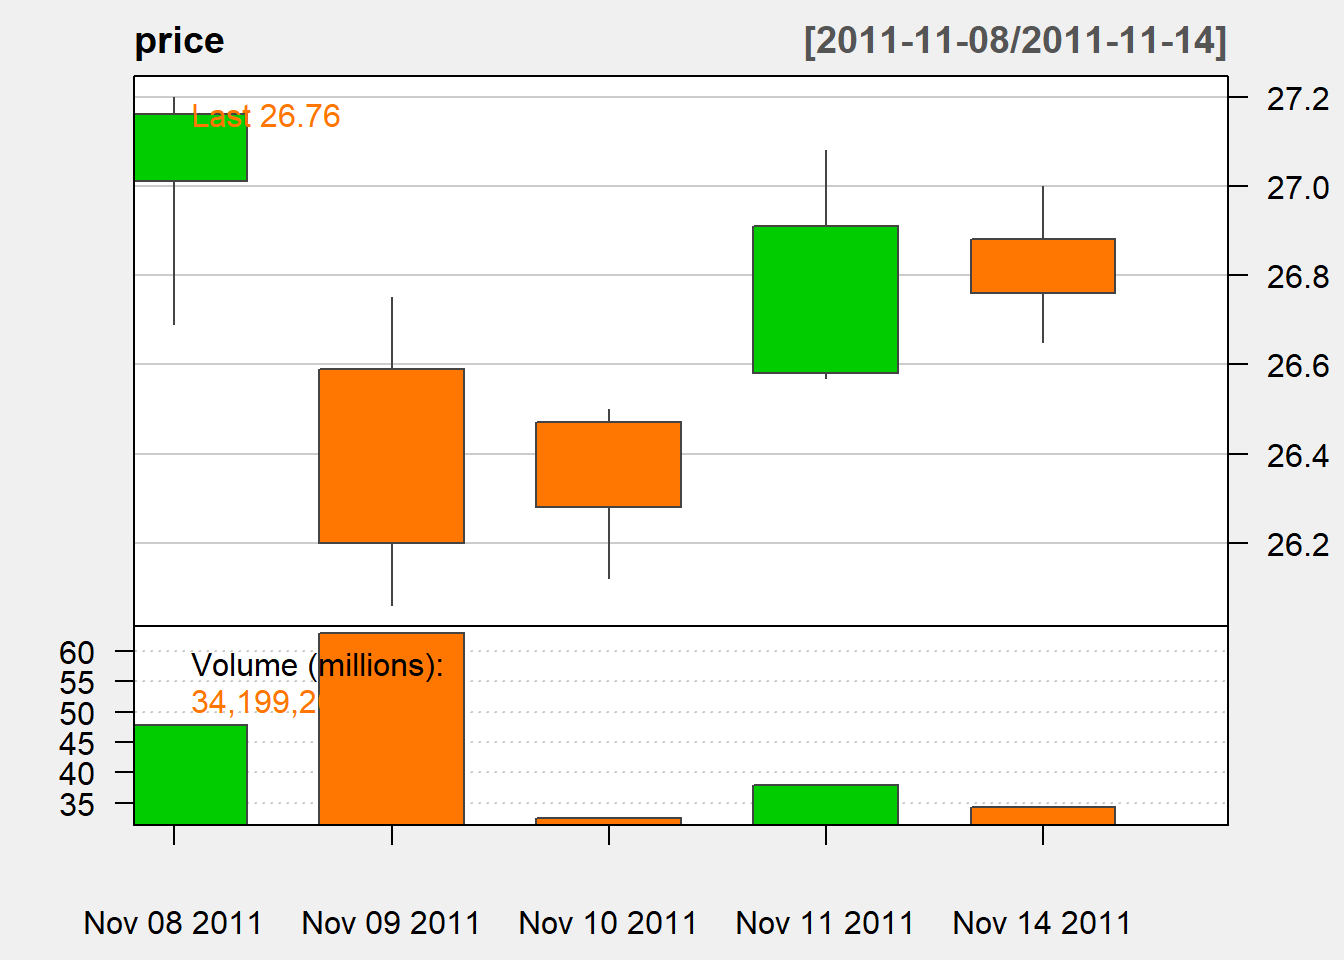
We can identify the pattern through the following code:
kick.up <-c(NA)
for (i in 2:length(Cl(MSFT))){
  if (D[i-1]>0 &&
      U[i]>0 &&
      OP[i]>=CL[i-1]){
    kick.up [i] <- 1
  } else{
    kick.up[i] <- 0
  }
}
kick.up <- reclass(kick.up,Cl(MSFT))
Let us check if our code does the job:
##            [,1]
## 2011-11-08    0
## 2011-11-09    0
## 2011-11-10    0
## 2011-11-11    1
## 2011-11-14    0