25 Lab 8 - Hypothesis Testing
25.0.1 Introduction
In the tutorial we explored the influence, or lack thereof, that weekend alcohol consumption and extra paid off campus classes had on the final math grades of two classes of Portuguese high school students in the 2005-2006 school year.
In this lab, we will consider one more factor: romantic relationships. Information about the relationship status of students in this dataset is stored in the variable romantic. This is a factor variable with two levels, yes and no, which indicate that a given student was or was not in a romantic relationship at the time this data was collected, respectively.
This is worth considering because it is widely believed, especially in China, that romantic relationships are detrimental to the academic success of high school students. Traditionally, Chinese high school students are strongly discouraged from developing romantic relationships with their classmates. Teachers and parents have been known to intervene when they suspect that two students may be acting on their feelings for each other in order to split young couples up. This is not something that is done in our program, of course, and I have not heard anything about this happening to regular track students either, but when I worked in Harbin what I just described was the norm.
Of course Portugal is not China and these two countries have very different education systems and cultures. Still, it is worth seeing if we can or cannot find some empirical evidence to support this belief. It is reasonable to believe that a romantic relationship would in fact lead to worse academic performance for just about anybody because it drains time and energy away from one’s studies. That is an effect that, if it exists, likely transcends cultures.
25.0.2 Your tasks
Load the ‘student_mat.csv’ file and filter out the data for which final math scores are missing like in the tutorial. Save the result as
math_filtered.Draw a bar plot of
romanticand label it.Split
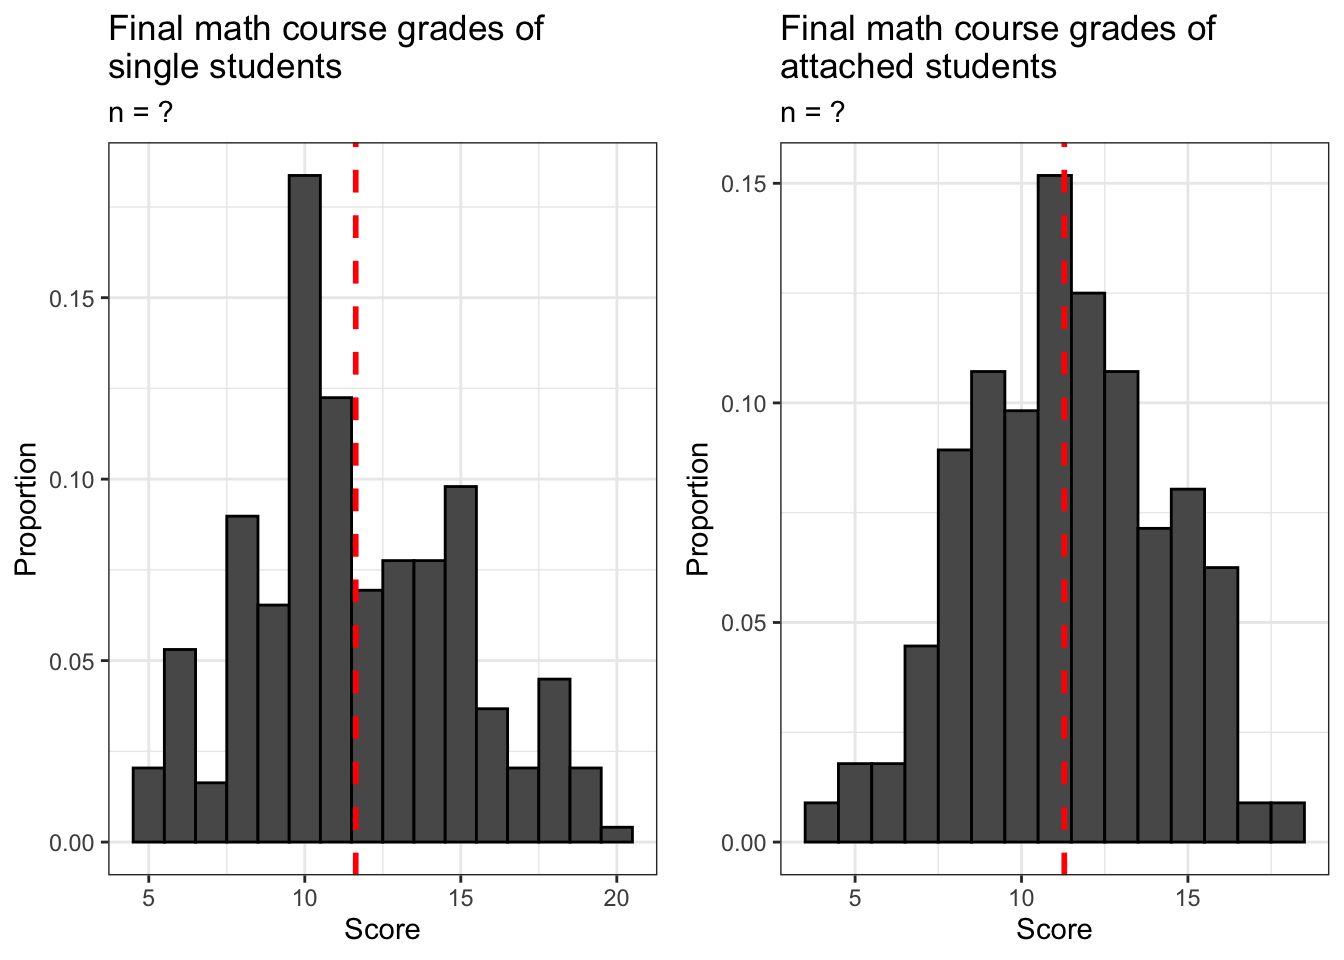
math_filteredinto two smaller datasets. The first should be calledsingleand it should contain all rows frommath_filteredfor whichromantic == 'no'. The second should be callednot_singleand it should contain all rows frommath_filteredfor whichromantic == 'yes'. Use this data to plot side-by-side histograms of the distributions of final math scores for these two groups. When you are done, your plot should look like the one below. Make sure you include the correct sample sizes in the subtitles of each histogram.
What are the average final math grades for single and attached students? Report them on a single line by placing them inside of a vector.
- Is there sufficient evidence to conclude at a 95% level of confidence (or 5% significance level) that single students have higher final math grades than attached students? Interpret the results in a few sentences.
- Hint: Use an upper tailed test