23 Lab 7: The Central Limit Theorem
23.0.1 Our data
The dslabs package contains a dataset called murders which contains data from the Federal Bureau of Investigation (FBI) about firearm murders in the 50 US states and Washington, D.C for the year 2010. A preview of the data is shown below.
##        state abb region population total
## 1    Alabama  AL  South    4779736   135
## 2     Alaska  AK   West     710231    19
## 3    Arizona  AZ   West    6392017   232
## 4   Arkansas  AR  South    2915918    93
## 5 California  CA   West   37253956  1257
## 6   Colorado  CO   West    5029196    65
23.0.2 Your tasks
- Download and install the
dslabspackage and then load themurdersdataset. Create a new variable,murders_per_100k, which gives the number of murders per 100,000 people in each state. If you have done this correctly, the first 6 rows ofmurdersshould now look identical to the output below. If you don’t already know how to calculate this value, a quick Google search will show you how.
##        state abb region population total murders_per_100k
## 1    Alabama  AL  South    4779736   135         2.824424
## 2     Alaska  AK   West     710231    19         2.675186
## 3    Arizona  AZ   West    6392017   232         3.629527
## 4   Arkansas  AR  South    2915918    93         3.189390
## 5 California  CA   West   37253956  1257         3.374138
## 6   Colorado  CO   West    5029196    65         1.292453
The national firearm murder rate is the mean of
murders_per_100kand it is reasonable to assert that this type of variable follows a Poisson distribution. Calculate the national murder rate, save this as a variable calledlambdaand printlambdaas your answer to this question.Write a function called
murder_sim()which produces a dataframe withnrows that consists of simulated national firearm murder rates that follow the appropriate distribution.
- Hint: This function is similar to
jury_sim()from the tutorial
- Using a
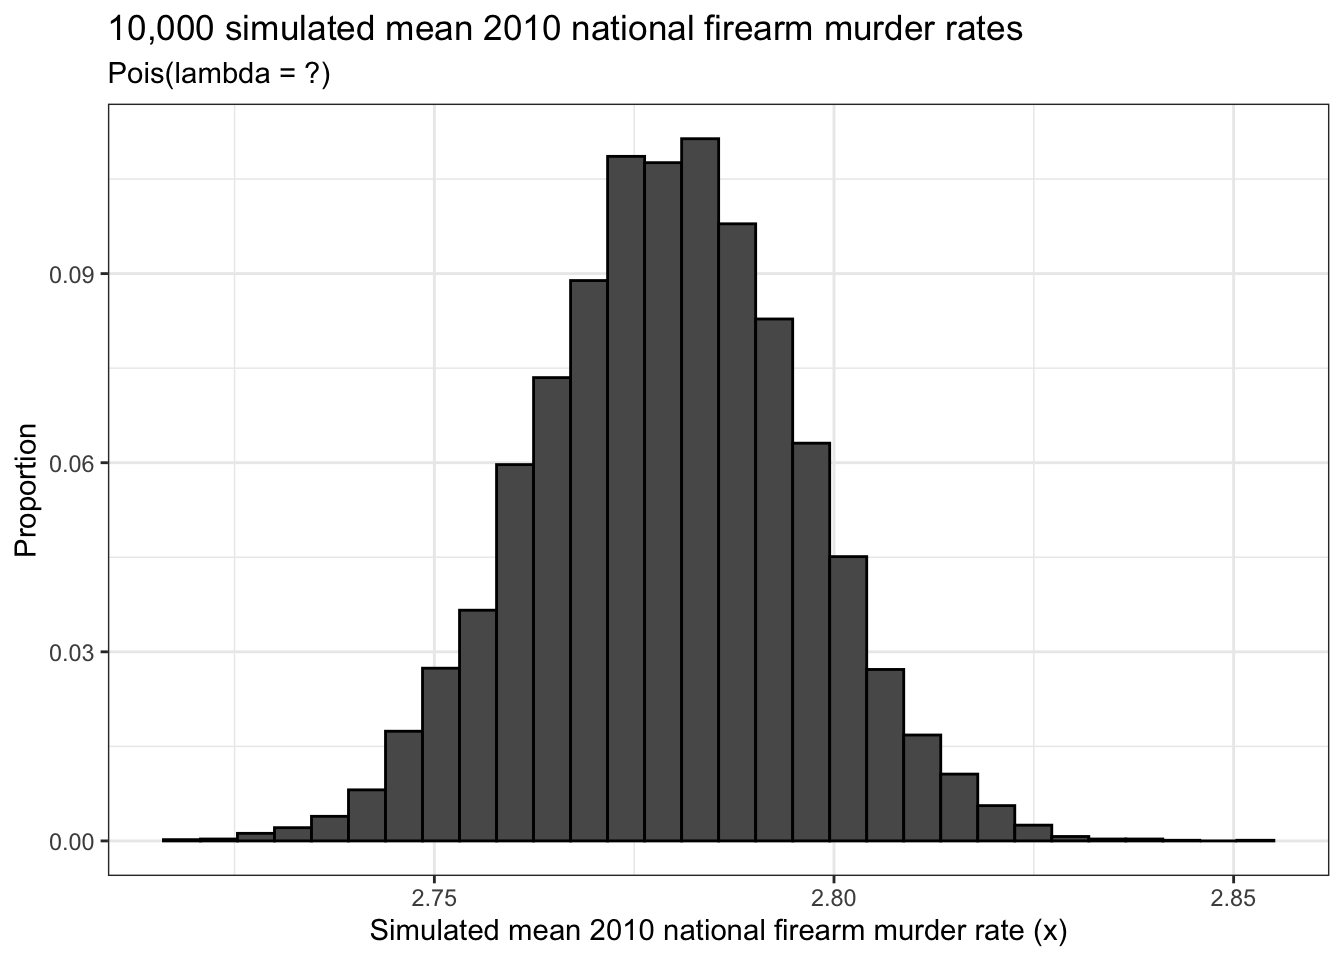
seedinteger of 10, usemurder_sim()to create 10,000 simulated national firearm murder rates. Save the resulting data as an object and then use it to create a histogram just like the one below. But make sure you put the correct value forlambdain the subtitle.
- Suppose that the year is now 2011 and you read in the newspaper that the FBI predicts that for this year, the firearm murder rate will be 2.2% higher than in 2010. Using this predicted value for the 2011 firearm murder rate as a test statistic together with your simulated data, calculate the proportion of simulated murder rates in your data that are greater than or equal to this value and explain whether or not this predicted murder rate is abnormally high compared to 2010. Illustrate this by modifying the histogram you made to answer the last question.