14 Lab 3: Conditional Probability
14.0.1 Your tasks
1. Using a proportion table, calculate the probability that a message is spam given that it contains the word ‘george’.
- Is this probability high or low? Why do you think this probability is so extreme?
2. Write a function that works the same way as p_spam_given_word() in the tutorial.
I.e., this function should return the probability that a message is spam given that it contains a certain word.
Some functions you should use when writing your function:
which(),lapply()andldply(). Remember also that we can use double brackets ([[]]) for extracting information from tables and dataframes too.This is a tough task. Don’t give up!
3. Use the function you wrote to calculate the probability that a message is spam given it contains a certain word for each of the words in the dataset. Store this information in its own dataframe, and then using relevant dplyr functions, list the 5 words with the highest probability of being spam given that they appear in a message. Do the same for the words with the 5 lowest probabilities.
- It would be best to present this information in a single table/dataframe so that these results can be compared side by side
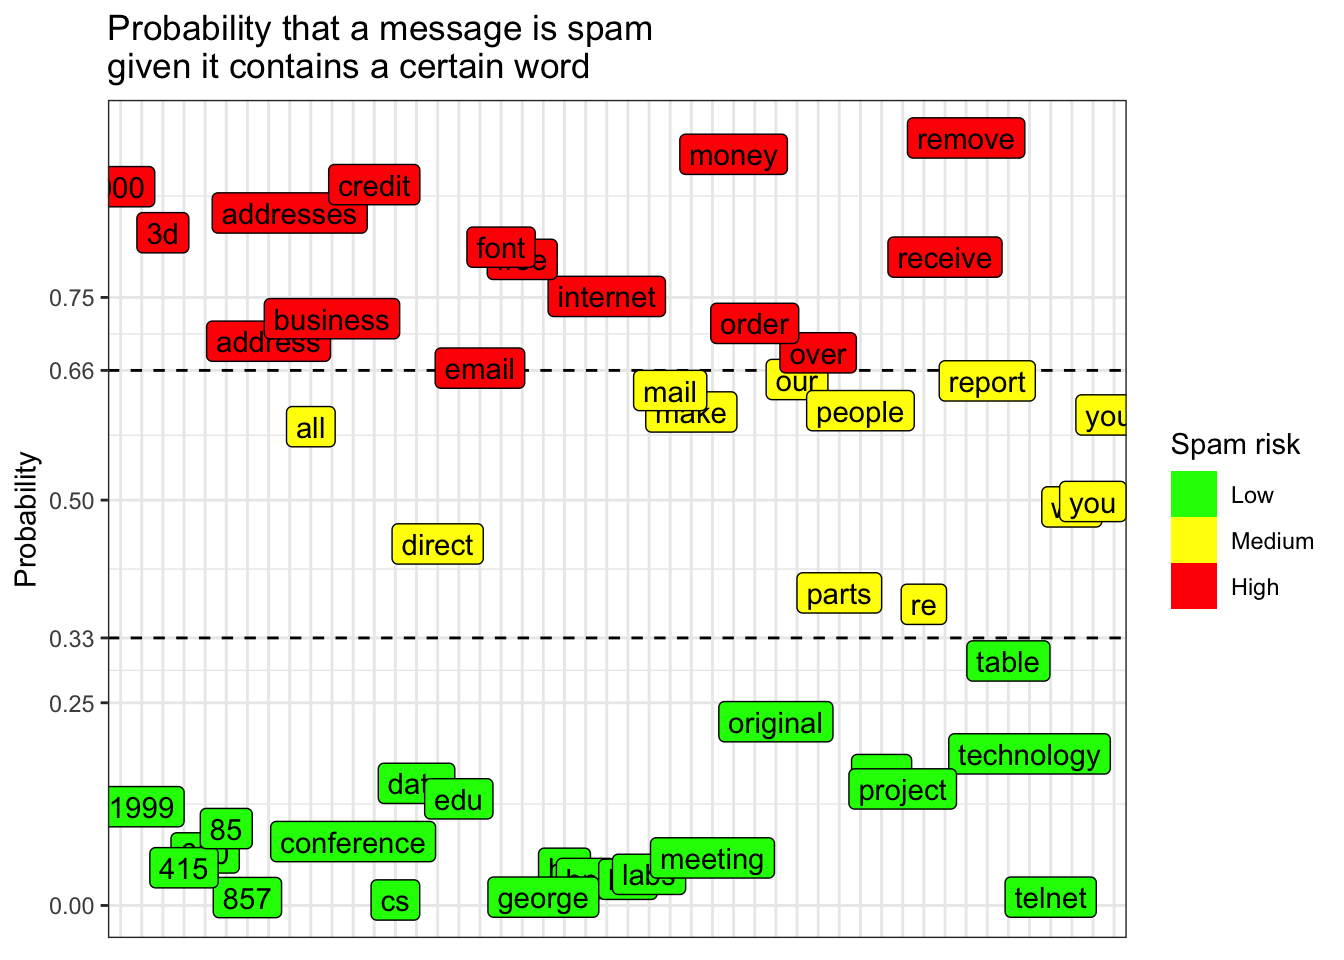
4. Create bins for your spam probabilities according to whether there is a high, medium or low probability that a message is spam given that the word appears in a message.
- There should be three bins of width 0.33 on an interval from 0 to 1. (I.e., one bin for probabilities 0%-33%, one for 33%-66% and one for 66%-100%.) Save these results as a new variable in the dataframe you made to answer the last question.
5. Using the same dataframe you made to answer questions 3 and 4, reproduce as best you can the visualization below.
- This will require a lot of googling. But you can figure out how to reproduce every detail of this plot if you are persistent enough.