9.5 Supplemental figures
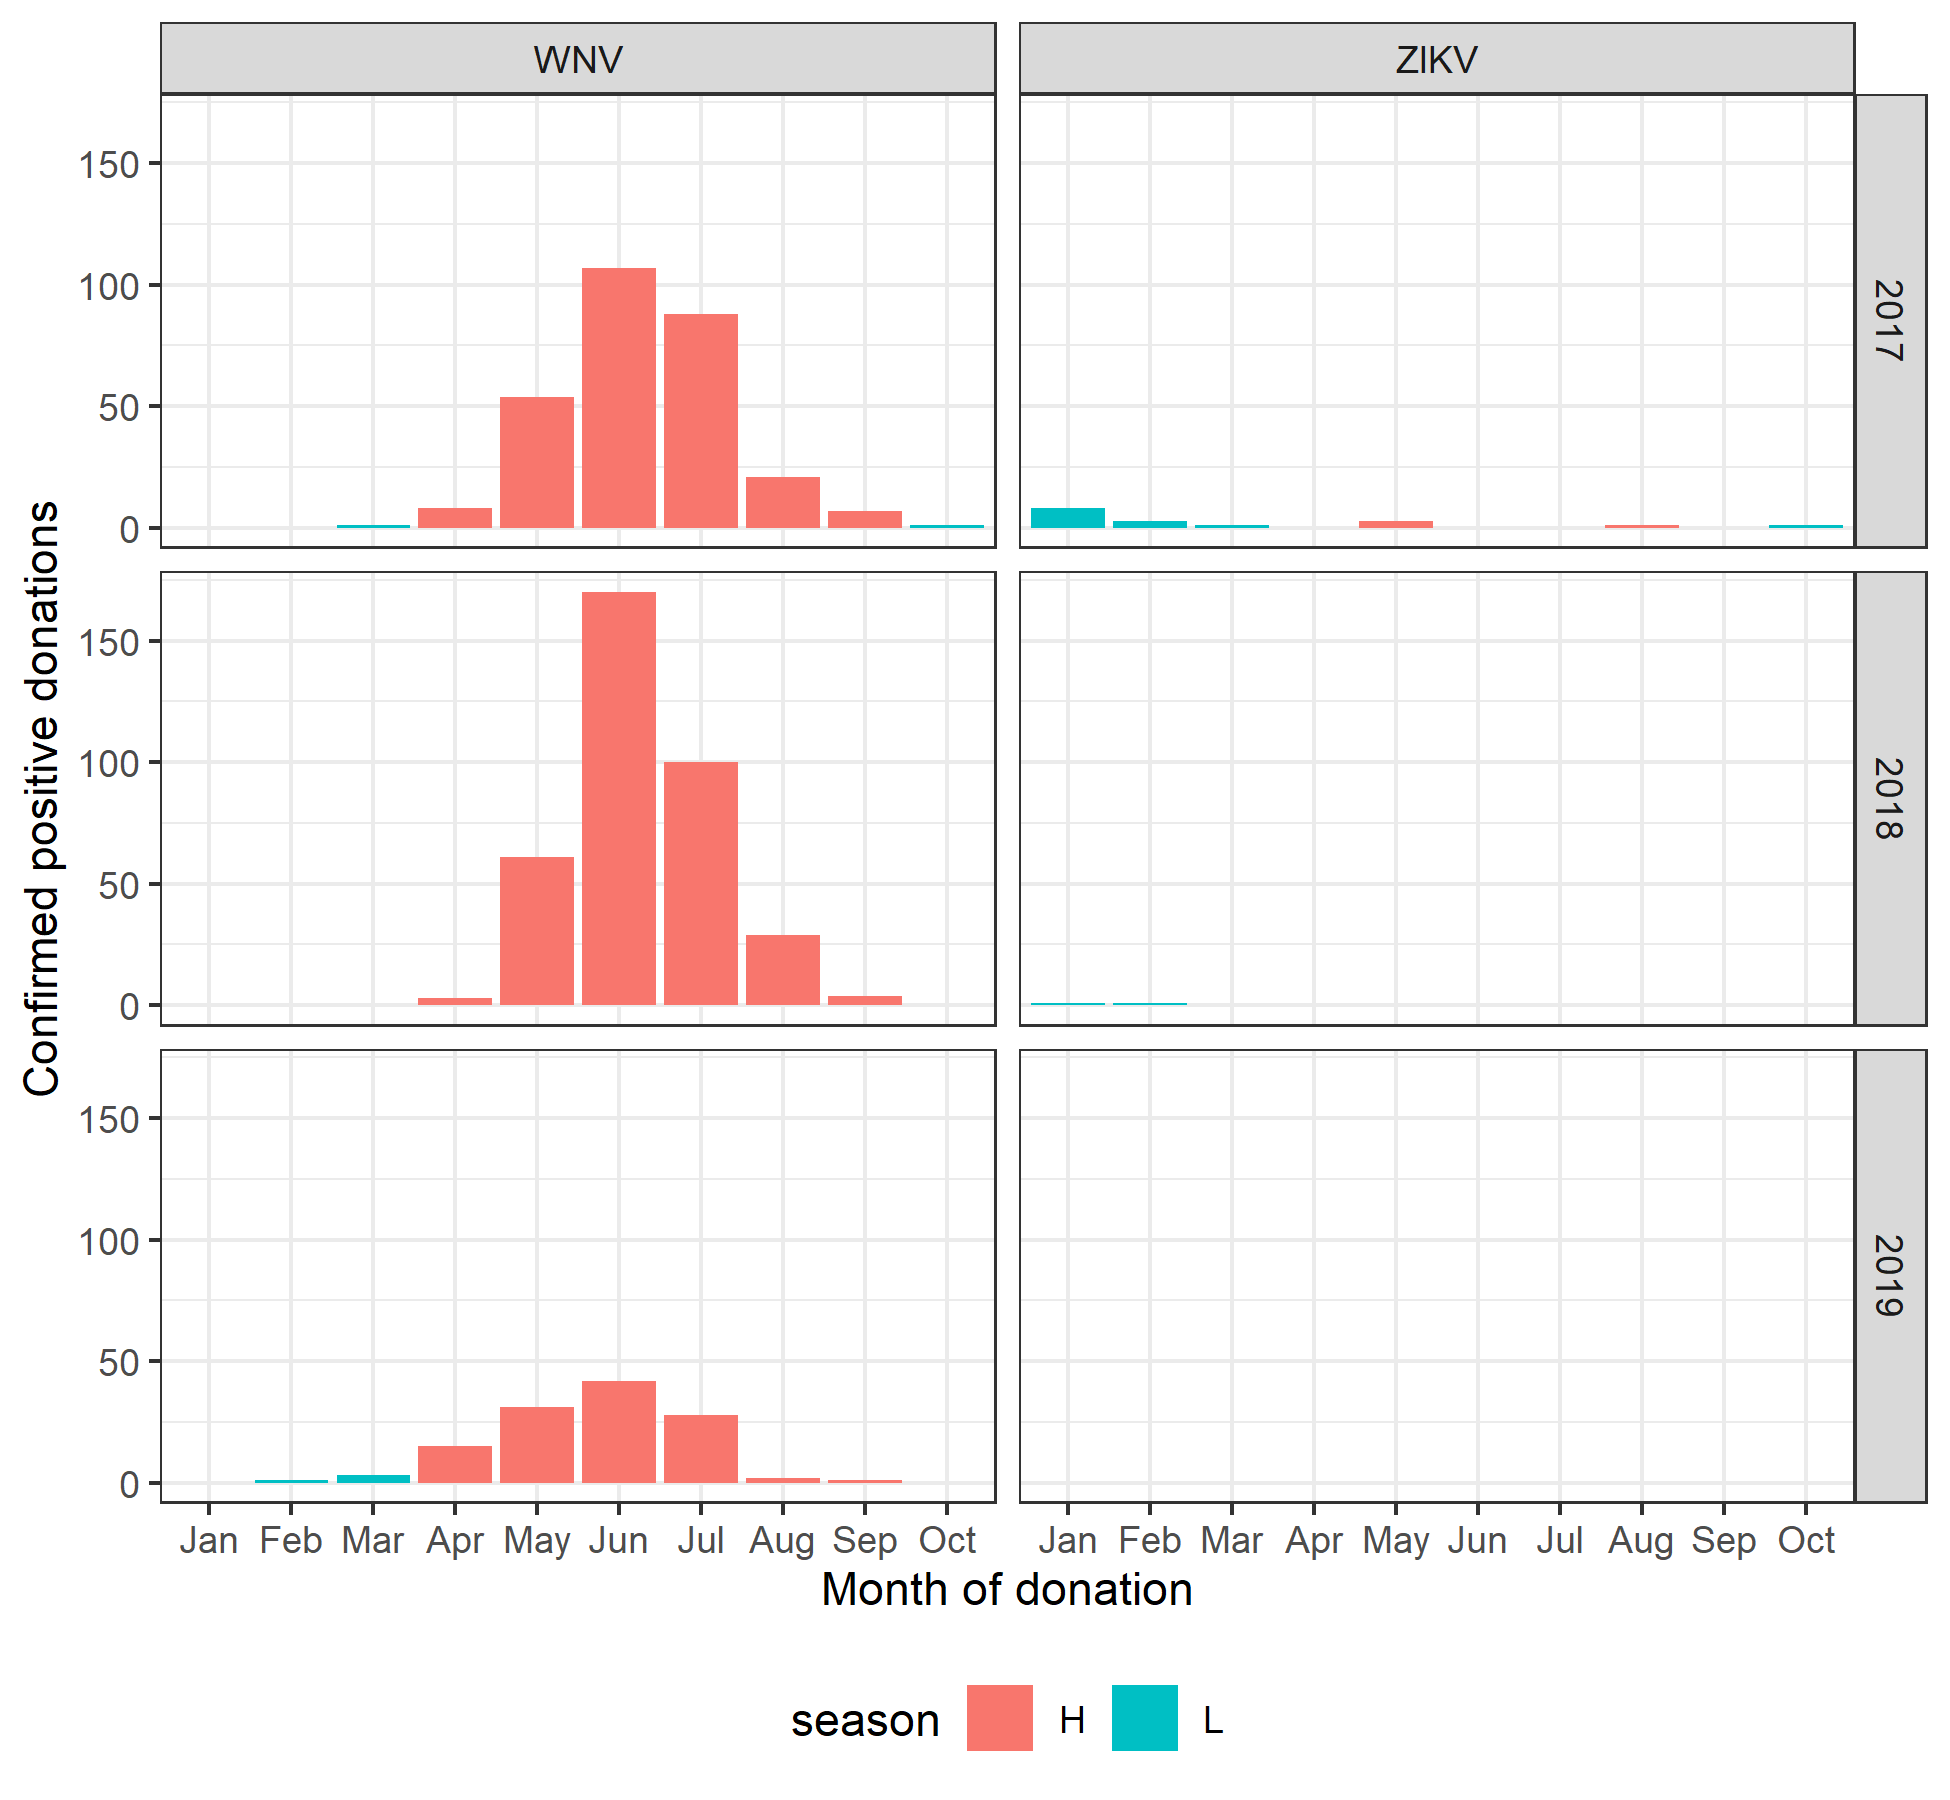
Figure 9.1: Distribution of confirmed positive blood donations by month for West Nile virus and Zika virus in 2017, 2018, and 2019.
High mosquito season was defined as April to September.
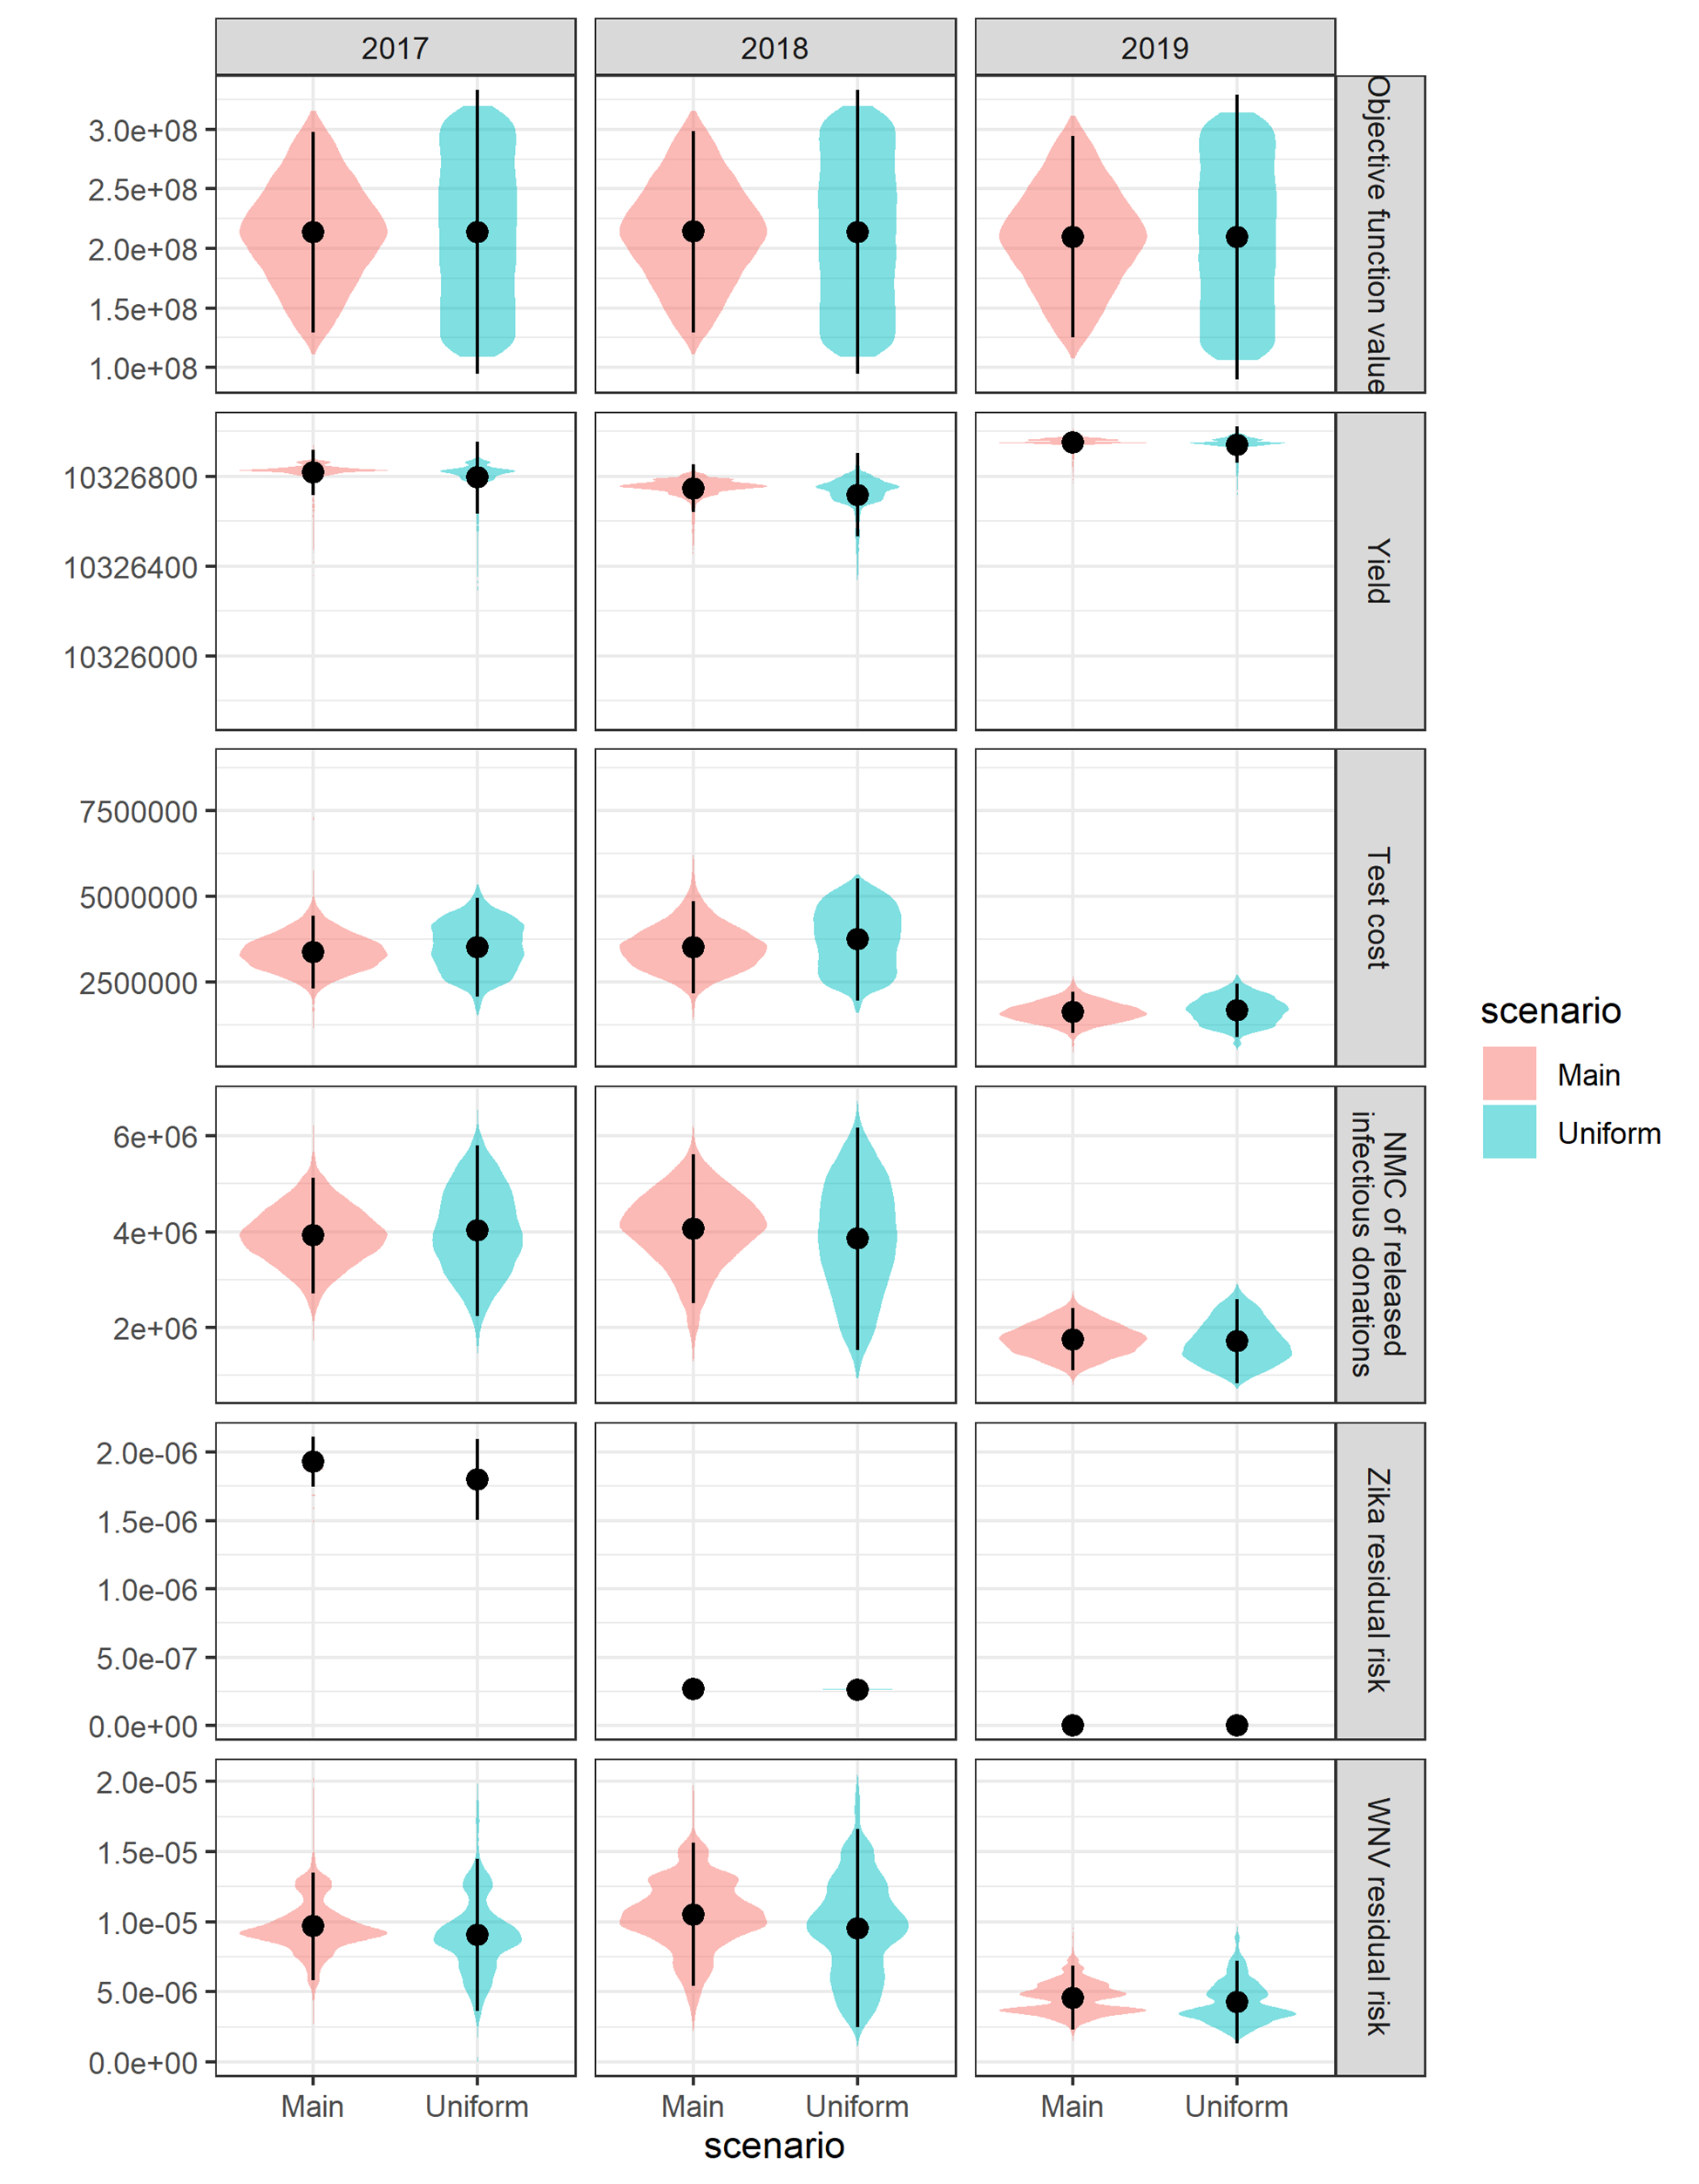
Figure 9.2: Comparison of metrics for the main probabilistic sensitivity analysis compared to a scenario analysis using uniform distributions.
NMC stands for net monetary cost
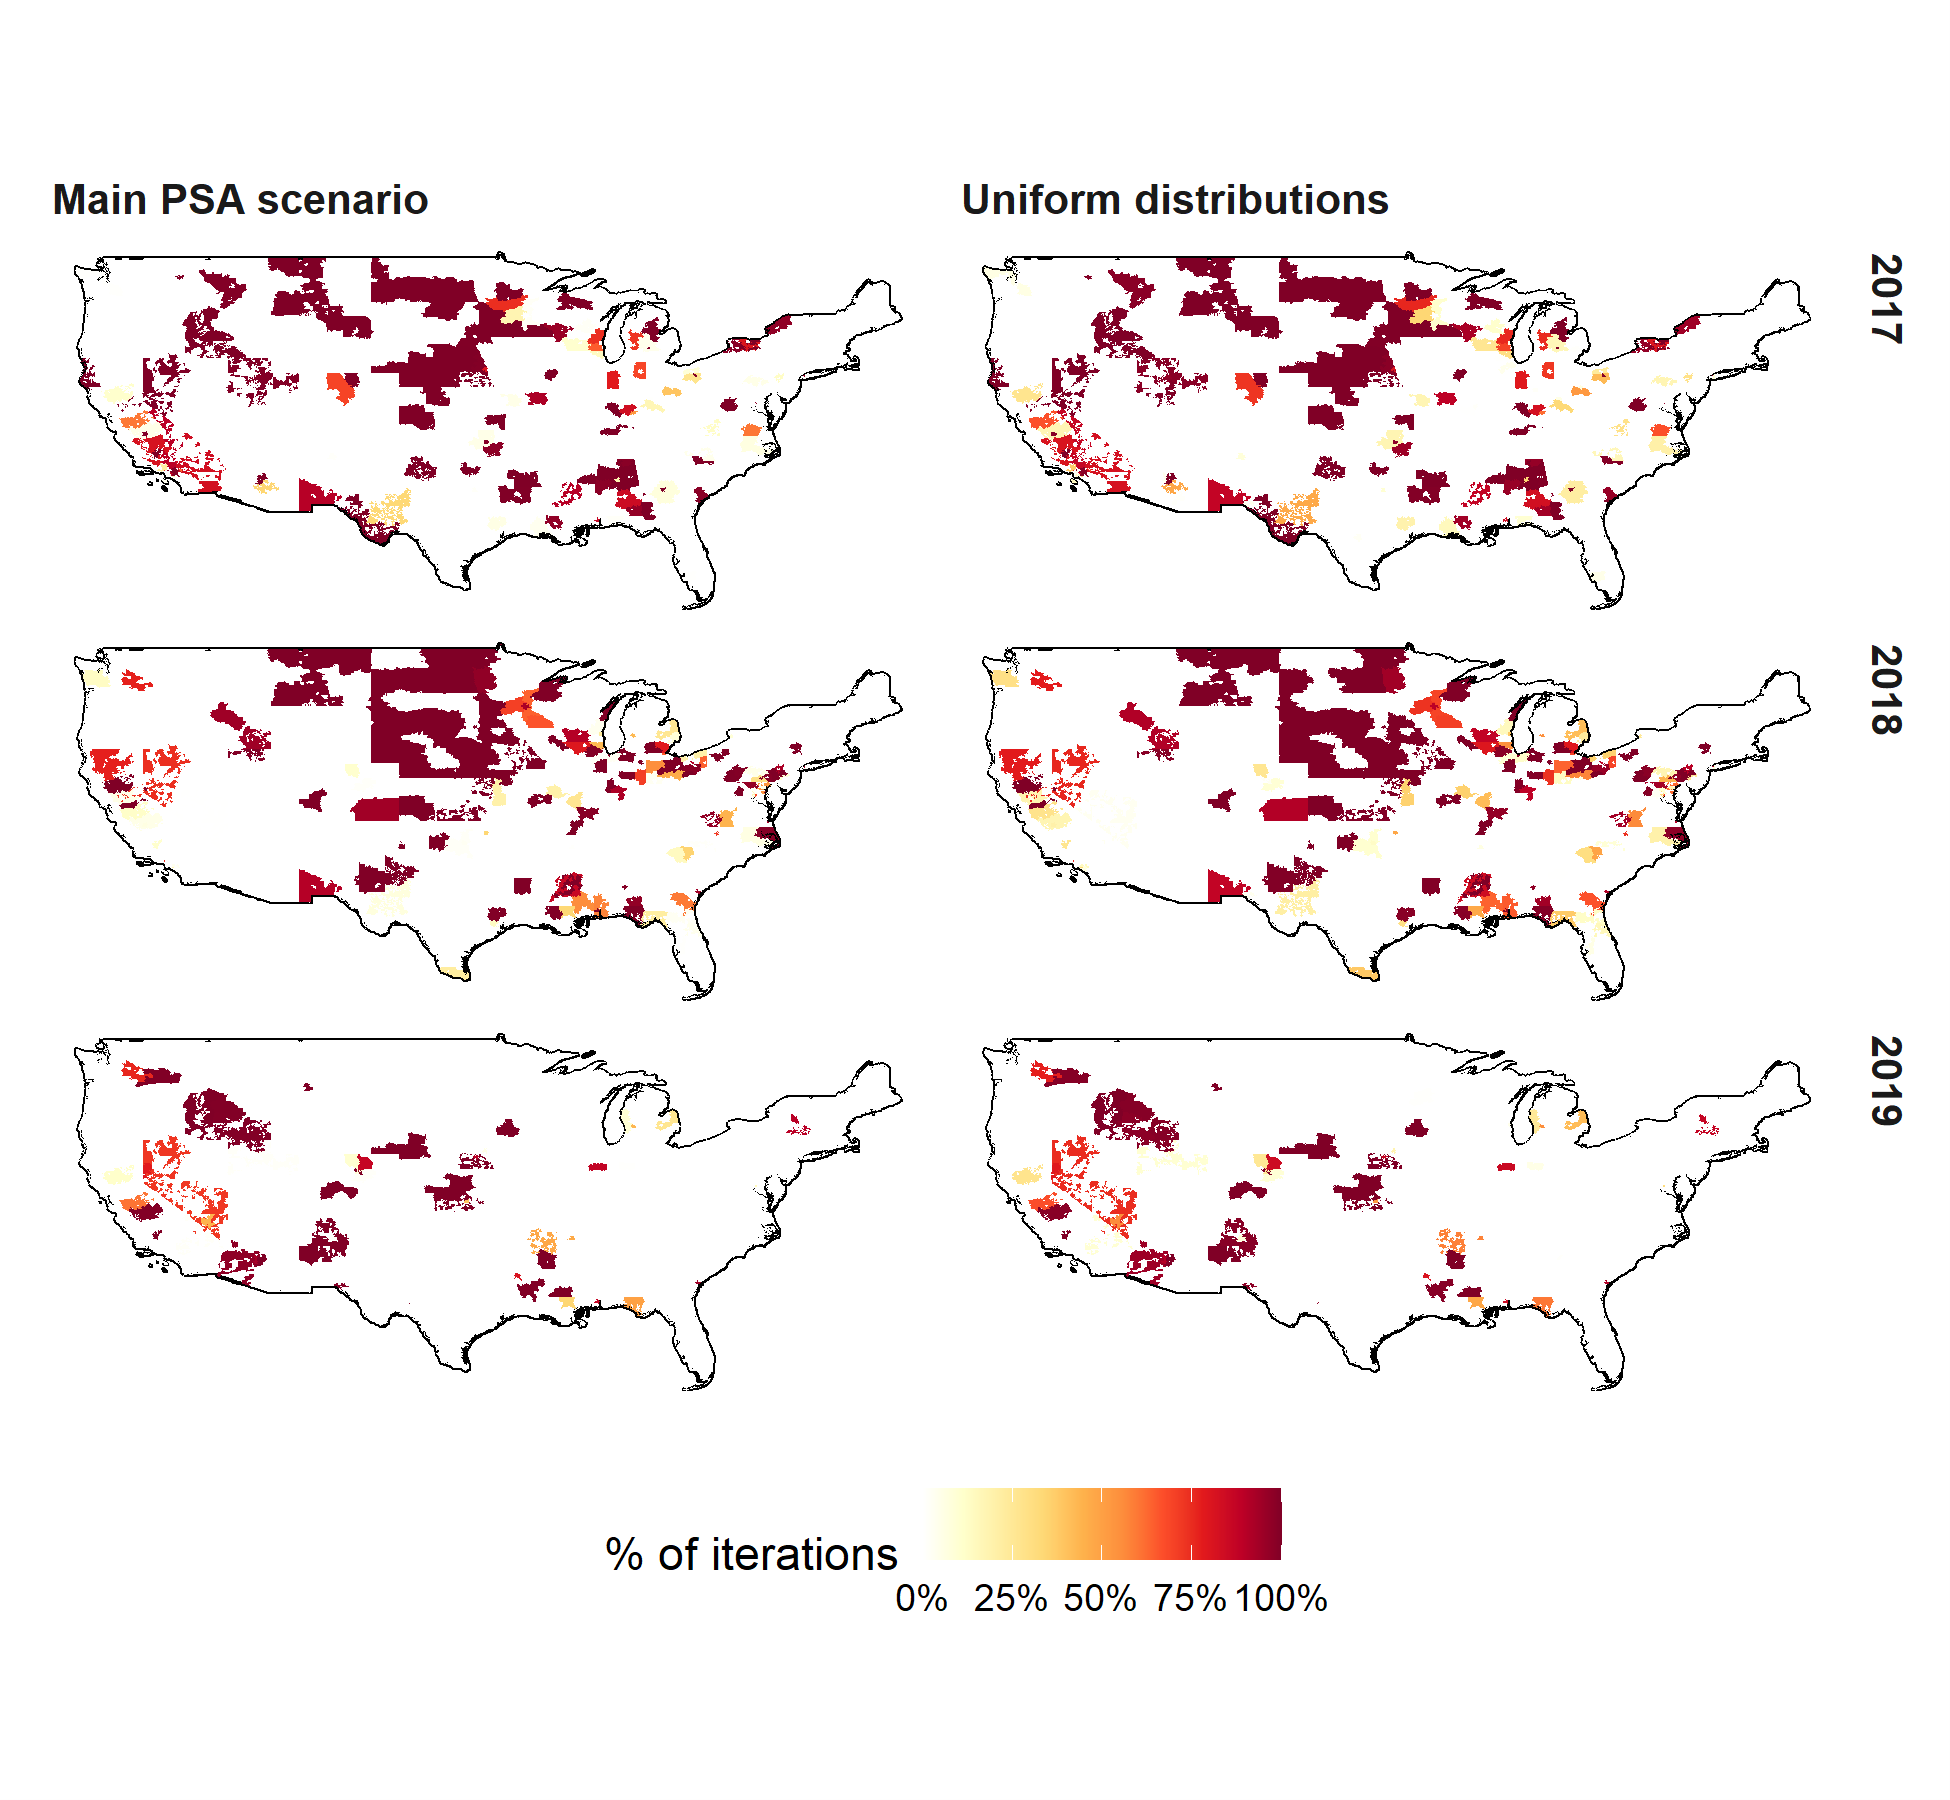
Figure 9.3: Comparison of percent iterations where West Nile Virus testing during the high mosquito season was optimal by 3-digit zip code for the main probabilistic sensitivity analysis (PSA) compared to a scenario analysis using uniform distributions.
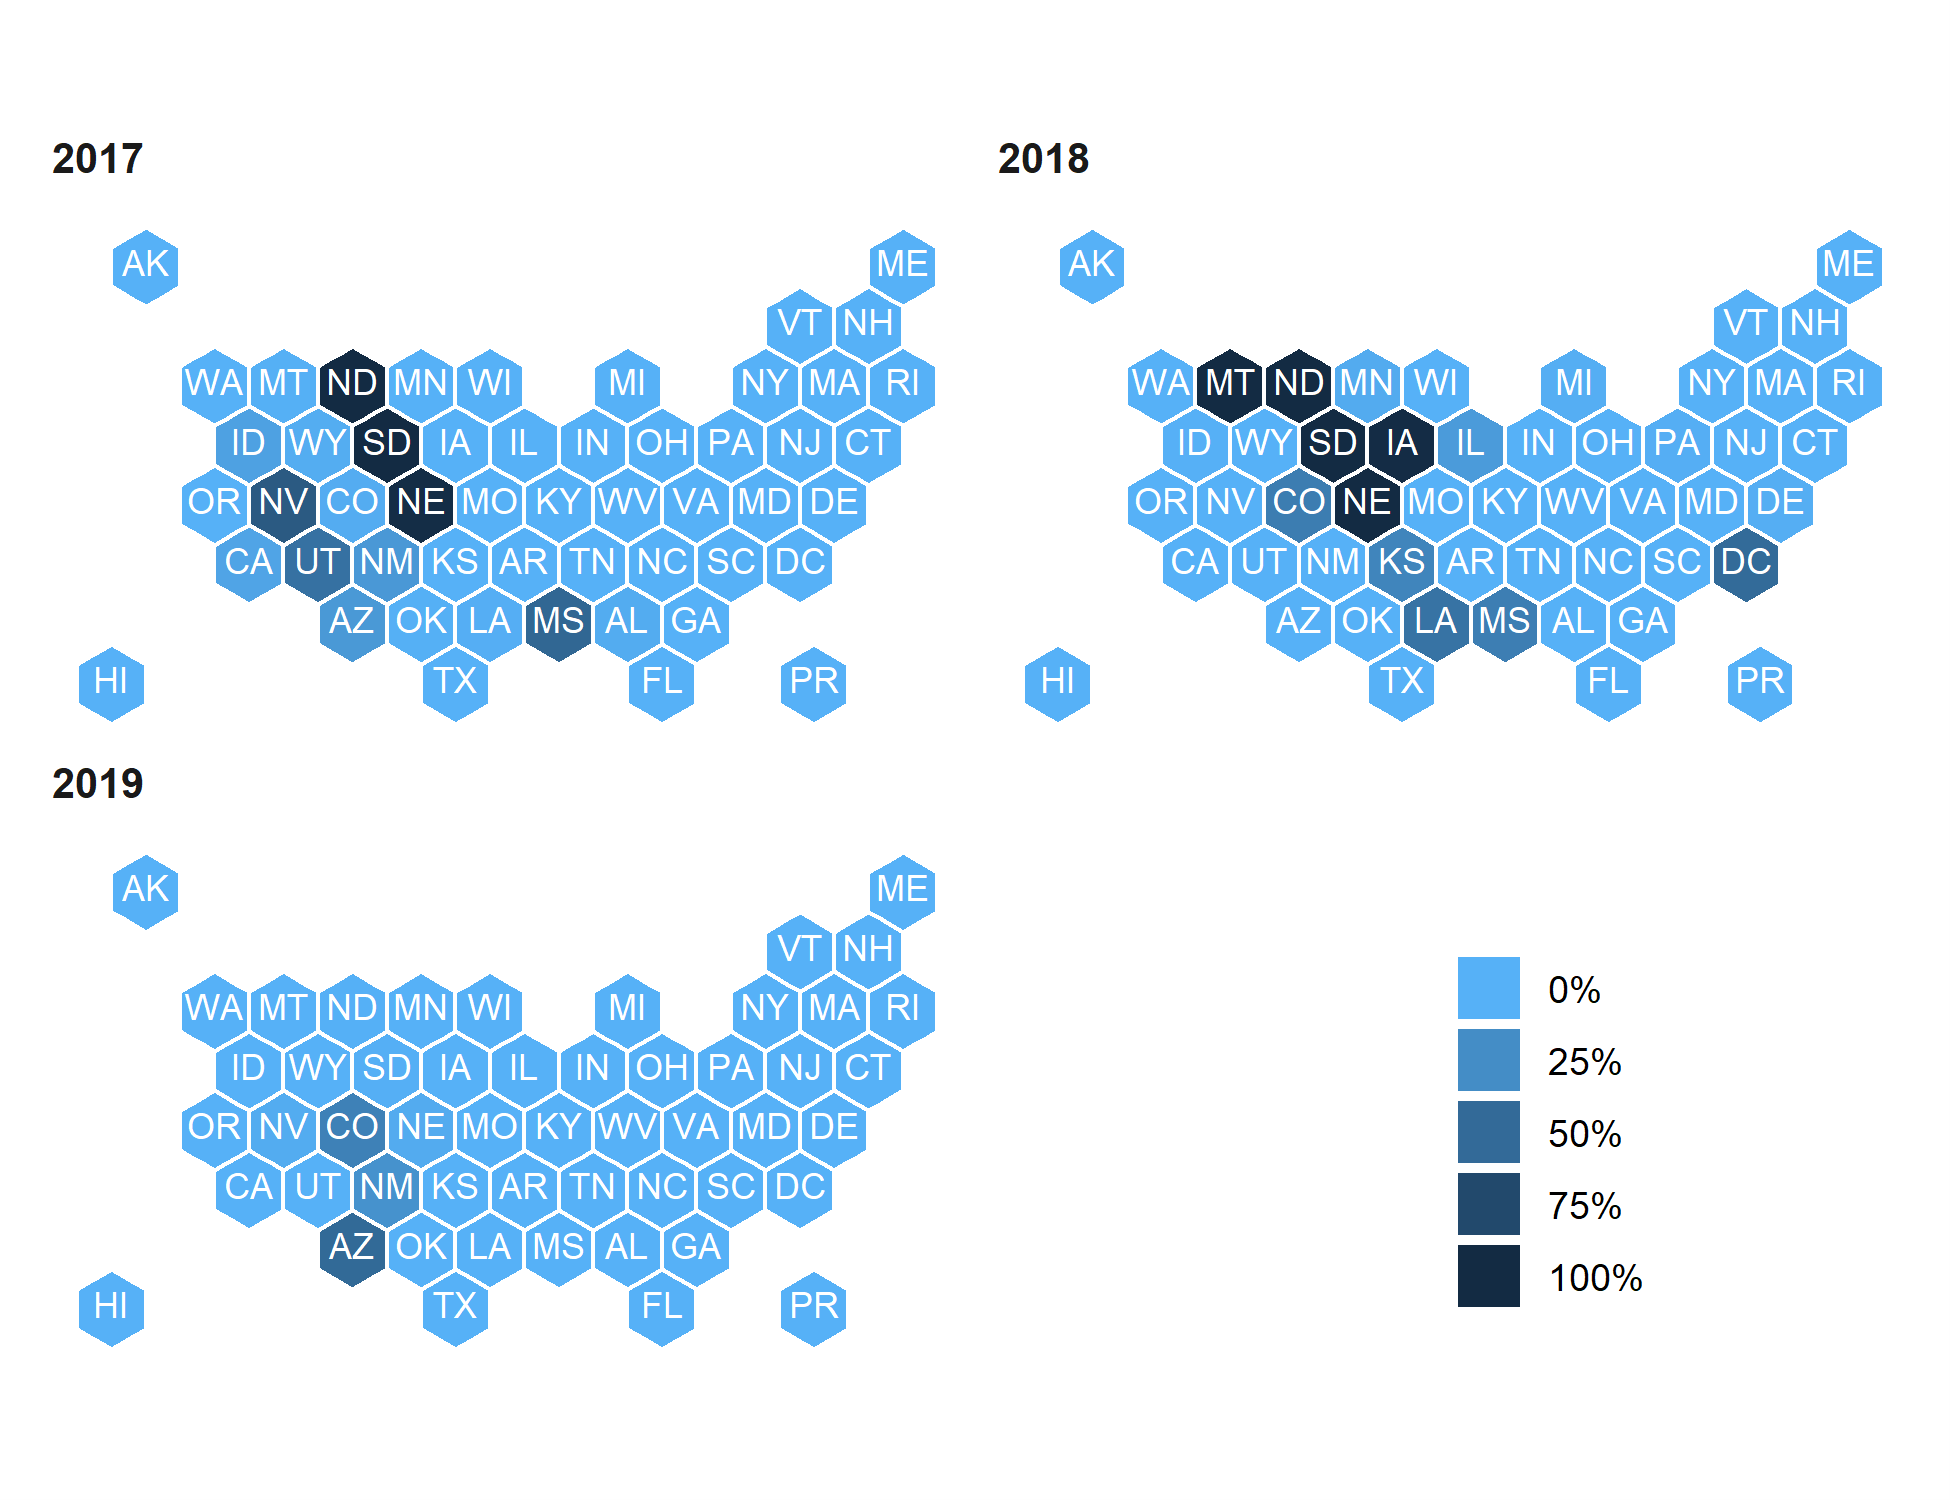
Figure 9.4: Hexbin map showing percent of probabilistic sensitivity analysis iterations for which WNV testing during high mosquito season was optimal by geographic area in 2017, 2018, and 2019.