5.3 Results
5.3.1 Data processing
In the RISE dataset, a total of 7817 donations from 1922 donors were followed by at least one follow-up visit. We removed 520 index donations because hemoglobin was not recorded, and we removed a further 18 index donations from the first return dataset because the follow-up visit was less than 56 days later. The first return dataset contained 7279 index donations labeled with the outcome of the first follow-up donation. That outcome was a hemoglobin deferral for 636 index donations; a low-iron donation for 754; an absent iron donation for 568; no adverse outcome for 1340; and a completed donation with unknown iron status for 3981. The model development dataset included 3529 unique index donations from 1543 donors. 3149 index donations were labeled with one follow-up donation, 289 were labeled twice, and 91 were labeled with 3 or more follow-up visit outcomes (maximum of 8).
5.3.2 Prediction model
We evaluated over 2,000 model configurations (model type and hyperparameter settings) across the five candidate model types. Figure 5.1 shows the average overall AUC within the 15 tuning datasets for each model configuration, and Supplemental Table 10.2 shows the top hyperparameter setting for each model type. The overall top model was a gradient boosted decision tree. It had an AUC of 75.0% – 75.8% across the 15 tuning set and a mean AUC of 76.1% as estimated using the outer cross-validation folds. As shown in Figure 5.2, discriminative performance was highest for predicting no adverse outcome donations and lowest for predicting low iron donations. In a secondary analysis, we found that use of ferritin, soluble transferrin receptor, and body iron increased the overall AUC from 77% to 82% among the subset of donations for which those values were recorded. Inclusion of these biomarkers increased discriminative performance most substantially for identifying absent iron donations and had little effect on ability to discriminate hemoglobin deferrals (Figure 5.3).
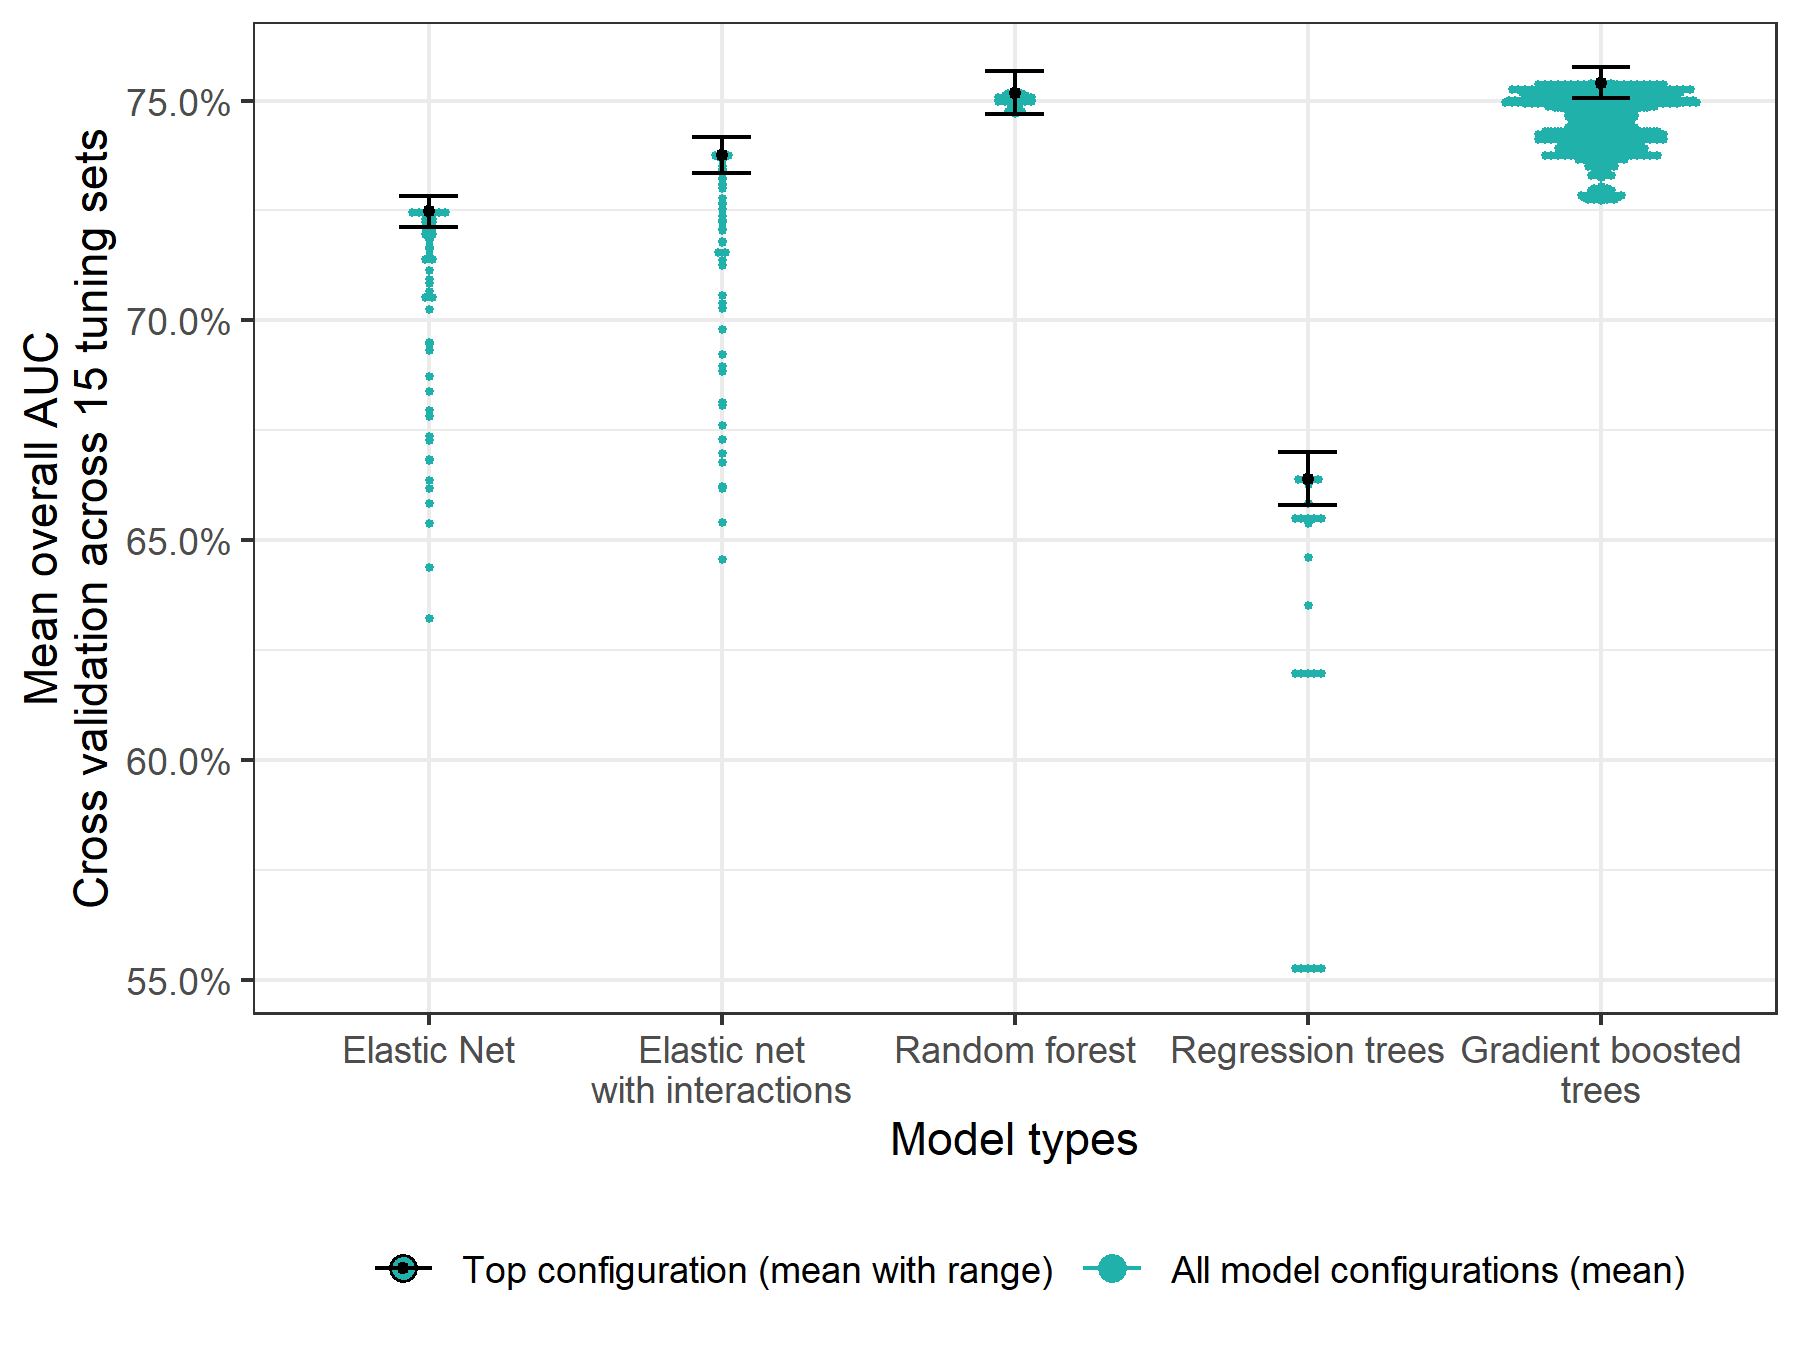
Figure 5.1: Overall AUC for each evaluated model configuration assessed using 5-fold cross validation and averaged across 15 tuning sets.
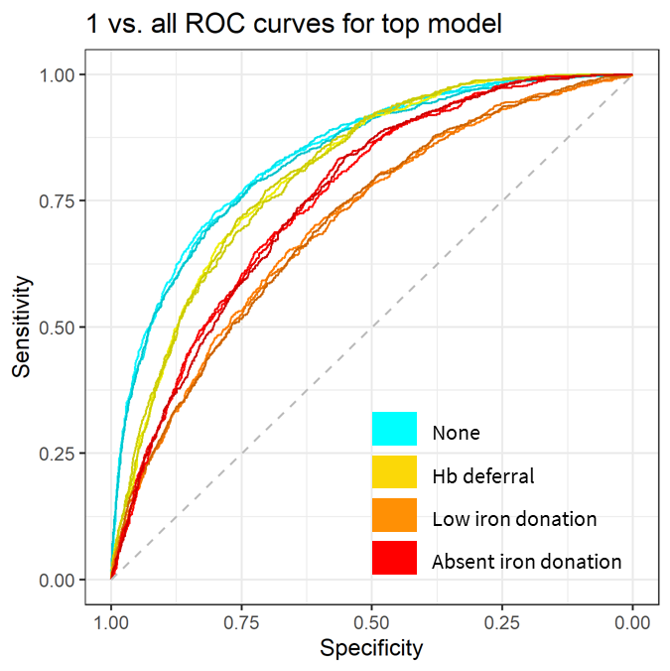
Figure 5.2: One vs. all ROC curves for discriminating each outcome.
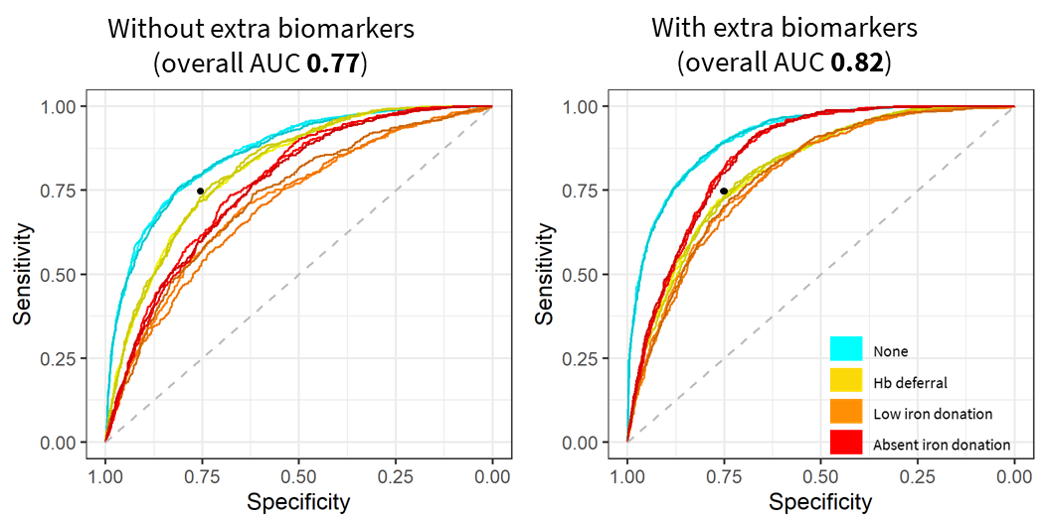
Figure 5.3: One vs. all ROC curves with and without ferritin, soluble transferrin receptor, and derived measured
Black dot at 75% sensitivity and 75% specificity for visual reference.
Variable importance for the top model in the primary analysis is shown in Figure 5.4 and for the model using extra biomarkers as predicters in Figure 5.5. In the primary analysis, hemoglobin and return time were most important for predicting the outcome of a follow-up donation. When additional biomarkers were used as predictors, ferritin became the most important.
We calculated normalization weights to calibrate the model scores to the expected distribution of outcomes in the first return dataset. They were 1.4 for the probability of no adverse outcome; 0.47 for the probability of a hemoglobin deferral; 1.1 for the probability of a low iron donation; and 1.2 for the probability of an absent iron donation.
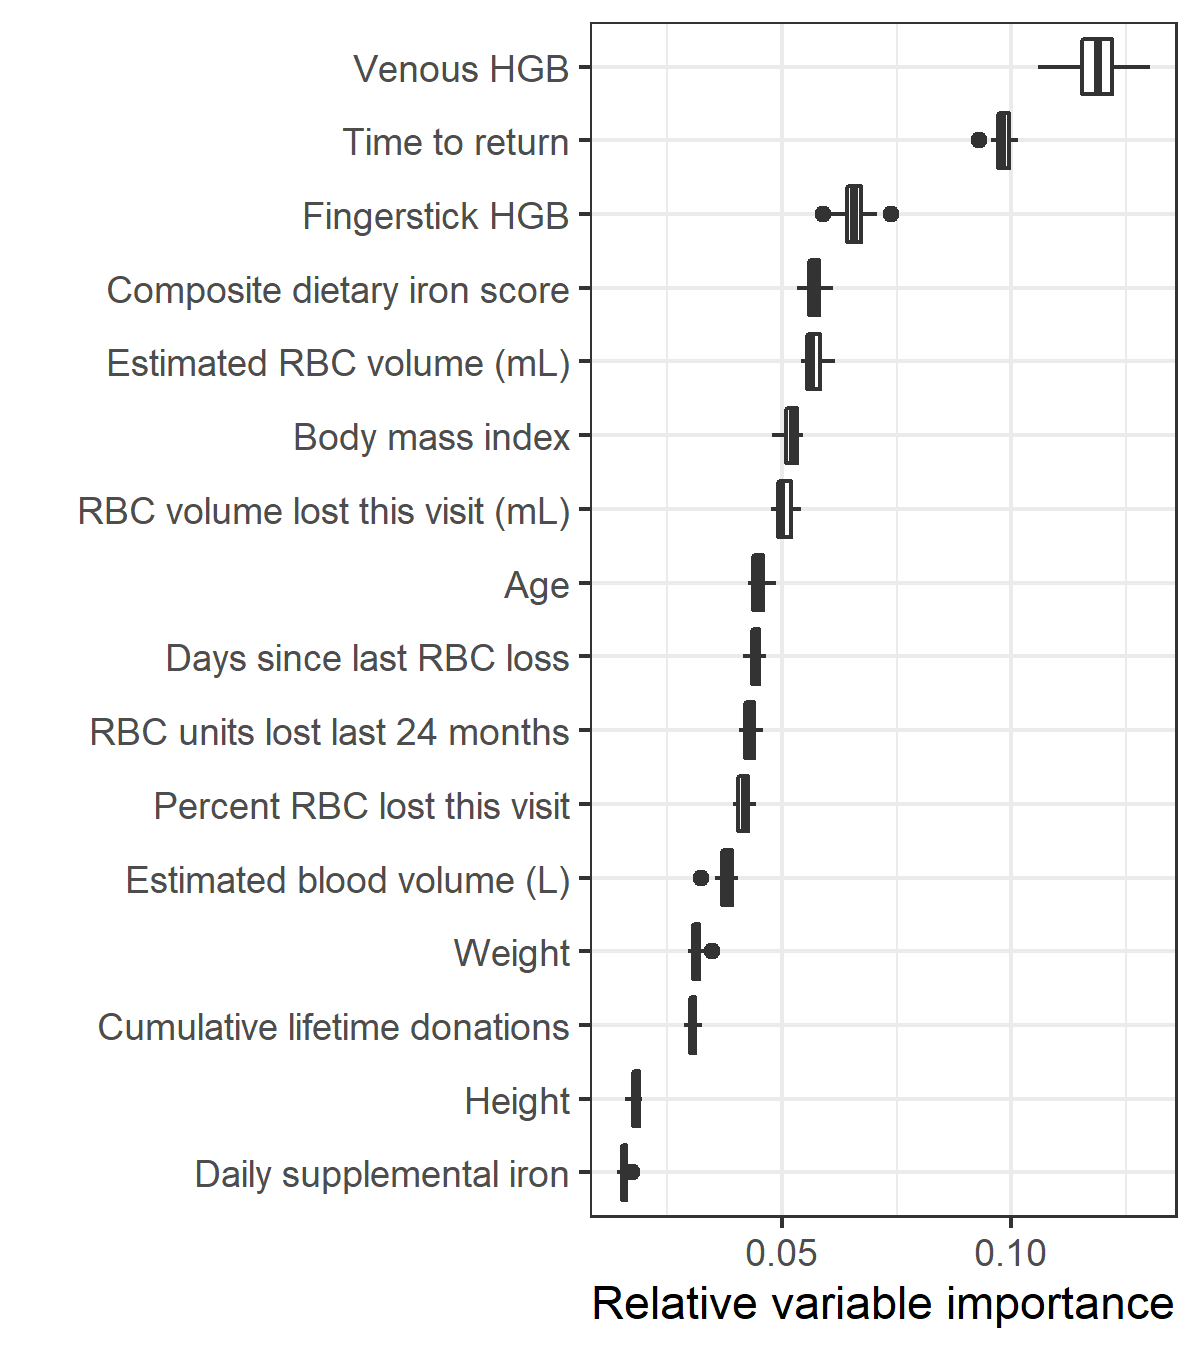
Figure 5.4: Relative variable importance for the top model in the primary analysis
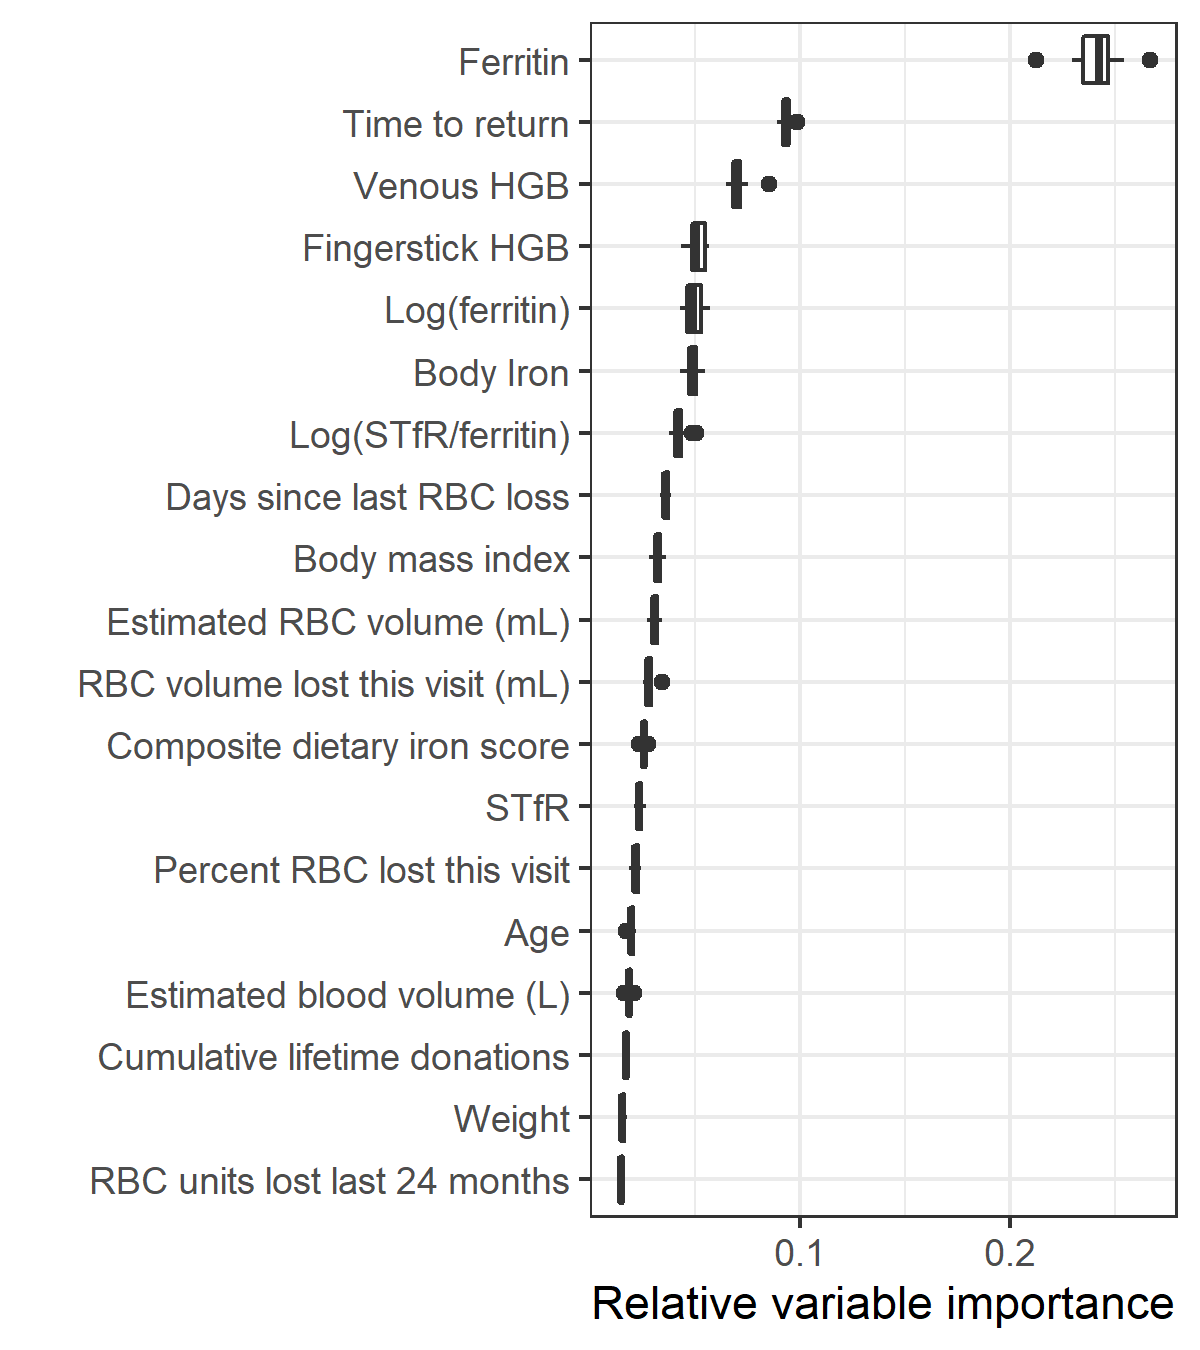
Figure 5.5: Relative variable importance for the model with ferritin, soluble transferrin receptor (STfR), and derived measures included as predictors
5.3.3 Individual risk profiles
Figure 5.6 shows the individual risk trajectories from two donations: one for a donor whose risk of an adverse outcome was high at day 56 but declined over time and another for a donor who had a low risk of adverse outcomes even at day 56. Supplemental Figure 10.1 shows the same plots for 60 randomly selected index donations from the first return dataset. Notably, estimated risk did not monotonically decrease for all adverse events for all donors. For example, the risk of a low iron donation increased as risk of hemoglobin deferral or an absent iron donation fell for some donors.
Figure 5.7 shows the probability of any adverse outcome at post-donation day 56 and post-donation day 250. The median risk of any adverse outcome at day 56 was 71% (IQR 43% – 86%), but this dropped to 23% (IQR 12% – 41%) at post-donation day 250. While risk of an adverse outcome fell for most donors, some continued to have a high risk even at post-donation day 250. For 787 donors (11%), estimated risk of any adverse outcome was above 60% at post-donation day 250, which may indicate an underlying iron-related condition unrelated to repeat blood donation.
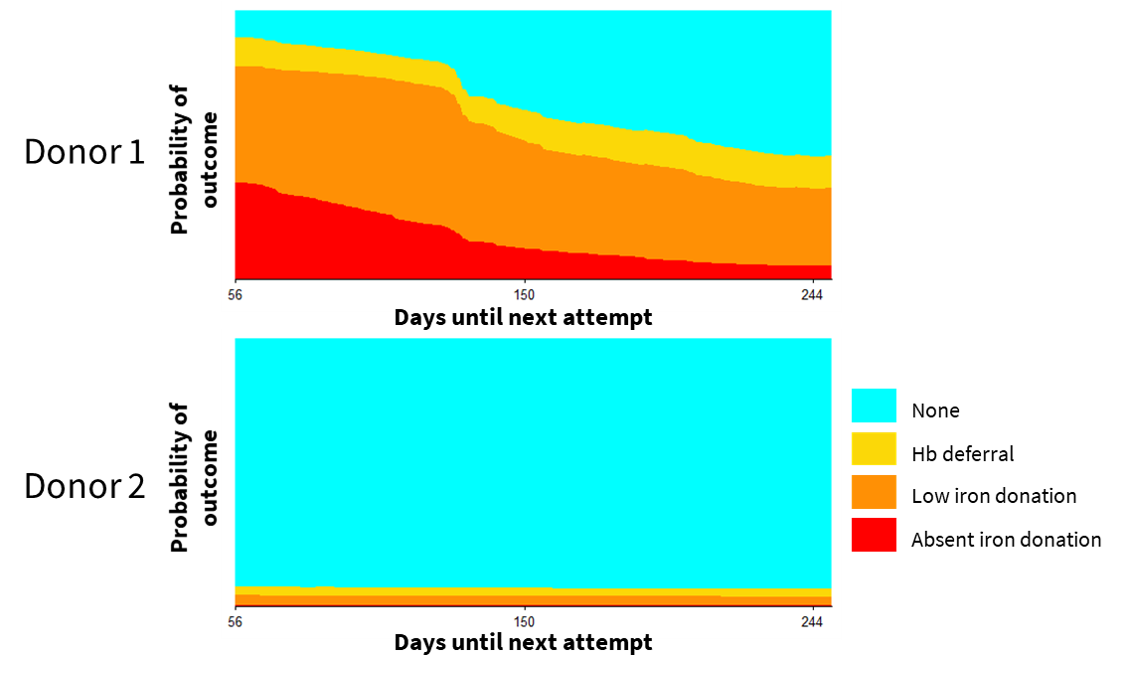
Figure 5.6: Individual risk trajectory for two example index donations
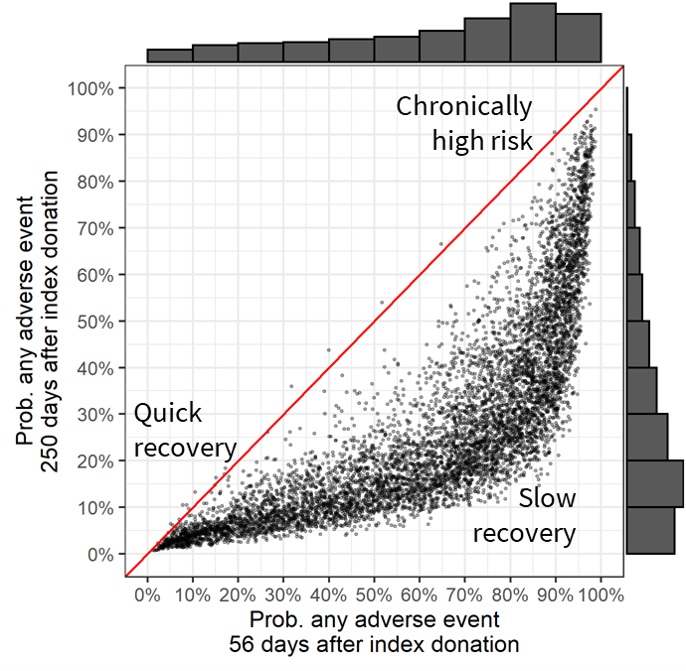
Figure 5.7: Probability of any adverse events on post-donation day 56 vs. post-donation day 250.
Marginal distributions are plotted. Index donations after which estimated risk does not decrease from post-donation day 56 to day 250 would appear on the red diagonal line. Points further below the diagonal exhibited a greater decrease in risk.
5.3.4 Policy simulation
For the cohort of donors represented in our first return dataset, we estimate 408 completed donations per 100 donor-years under the status quo, of which 126.5 would be low iron donations and 95.7 would be absent iron donations. We estimate that 43.6 hemoglobin deferrals would occur over 100 donor-years. Supplemental table 10.3 shows the expected rate of collections and adverse events for four non-tailored interval policies and 810 versions of the tailored IDI policy. Table 5.1 shows the percent reduction in collections and adverse outcomes compared to the status quo for select alternatives. In general, tailored IDIs led to larger decreases in hemoglobin deferrals and absent iron donations than did uniform policies that produced similar decreases in collections. This was not always the case for low iron donations because risk for low iron donations increased over time for some donors.
Policy | Collections | HGB deferrals | Low iron donations | Absent iron donations |
Uniform interval policies1 | ||||
Can 84W-56M | -8.7% | -27.1% | -10.2% | -17.4% |
Aus 84W-84M | -20.3% | -41.2% | -31.4% | -30.1% |
UK 112W-84M | -28.3% | -57.6% | -42.4% | -43.3% |
Tailored policies2 | ||||
Tailored 0.5H-0.5L-0.3A | -9.8% | -32.8% | -8.1% | -32.4% |
Tailored 0.3H-0.3L-0.2A | -22.3% | -57.9% | -30.5% | -53.7% |
Tailored 0.2H-0.2L-0.1A | -36.8% | -77.5% | -53.8% | -72.7% |
1Policies used in Canada, Australia, and the UK. Minimum interval in days for women (W) and for men (W) are indicated. | ||||
2Three example tailored policies. Maximum allowable risks for hemoglobin defferal (H), low iron donation (L), and absent iron donation (A) are indicated. | ||||