2.3 Results
2.3.1 Puerto Rico
With no intervention, an estimated 242.2 cases (95% CI, 194.9 to 291.5 cases) of transfusion transmission would have occurred during the first year of screening in Puerto Rico, including 44.4 cases (CI, 25.22 to 70.41 cases) of mild febrile illness, 0.064 cases (CI, 0.005 to 0.200 cases) of Guillain−Barré syndrome, and 0.030 cases (CI, 0.002 to 0.073 cases) of congenital Zika syndrome. By the alternate willingness-to-pay threshold for blood safety, universal ID-NAT was cost-effective compared with no intervention, with a CER of $338,597 per QALY (CI, $77,458 to $1,487,198 per QALY). When considered alongside other interventions, however, universal ID-NAT cost $15.4 million more per QALY gained (CI, $2.2 million to $95.2 million per QALY) than the next most effective alternative, which was ID-NAT in high mosquito season and MP-NAT in low season. Mini-pool NAT during high mosquito season and no intervention during low season was cost-effective, with an ICER of $81,123 per QALY gained (CI, $−20,013 to $516,591 per QALY). As illustrated in Figure 2.1, the 2 policies involving separate inventories for women of childbearing age were strictly dominated in Puerto Rico, meaning that a more effective and less expensive alternative was identified. Universal MP-NAT was weakly dominated, meaning that a combination of other policies provided more QALYs at a lower cost per QALY.
2.3.2 50 States and Washington, DC
With no intervention, an estimated 44.7 cases (CI, 32.1 to 59.1 cases) of transfusion transmission would have occurred during the first year of screening, including 8.2 cases (CI, 4.3 to 13.5 cases) of mild febrile illness, 0.012 cases (CI, 0.006 to 0.021 cases) of Guillain−Barré syndrome, and 0.0057 cases (CI, 0.0000 to 0.02161 cases) of congenital Zika syndrome. The positive predictive value of universal ID-NAT in the 50 states during the study period was 11.6% (CI, 7.6% to 25.9%), indicating that approximately 9 of every 10 test results that were initially reactive would be expected to be false-positive. As illustrated in Figure 2.1, policies involving separate inventories for women of childbearing age, universal MP-NAT, and ID-NAT in areas of known local transmission were strictly or weakly dominated. Location-adaptive MP-NAT, travel-adaptive MP-NAT, and travel-adaptive ID-NAT were not dominated, but no screening policy was found to be cost-effective.
Key results for Puerto Rico and the 50 states are summarized in Tables 2.2 and 2.3.
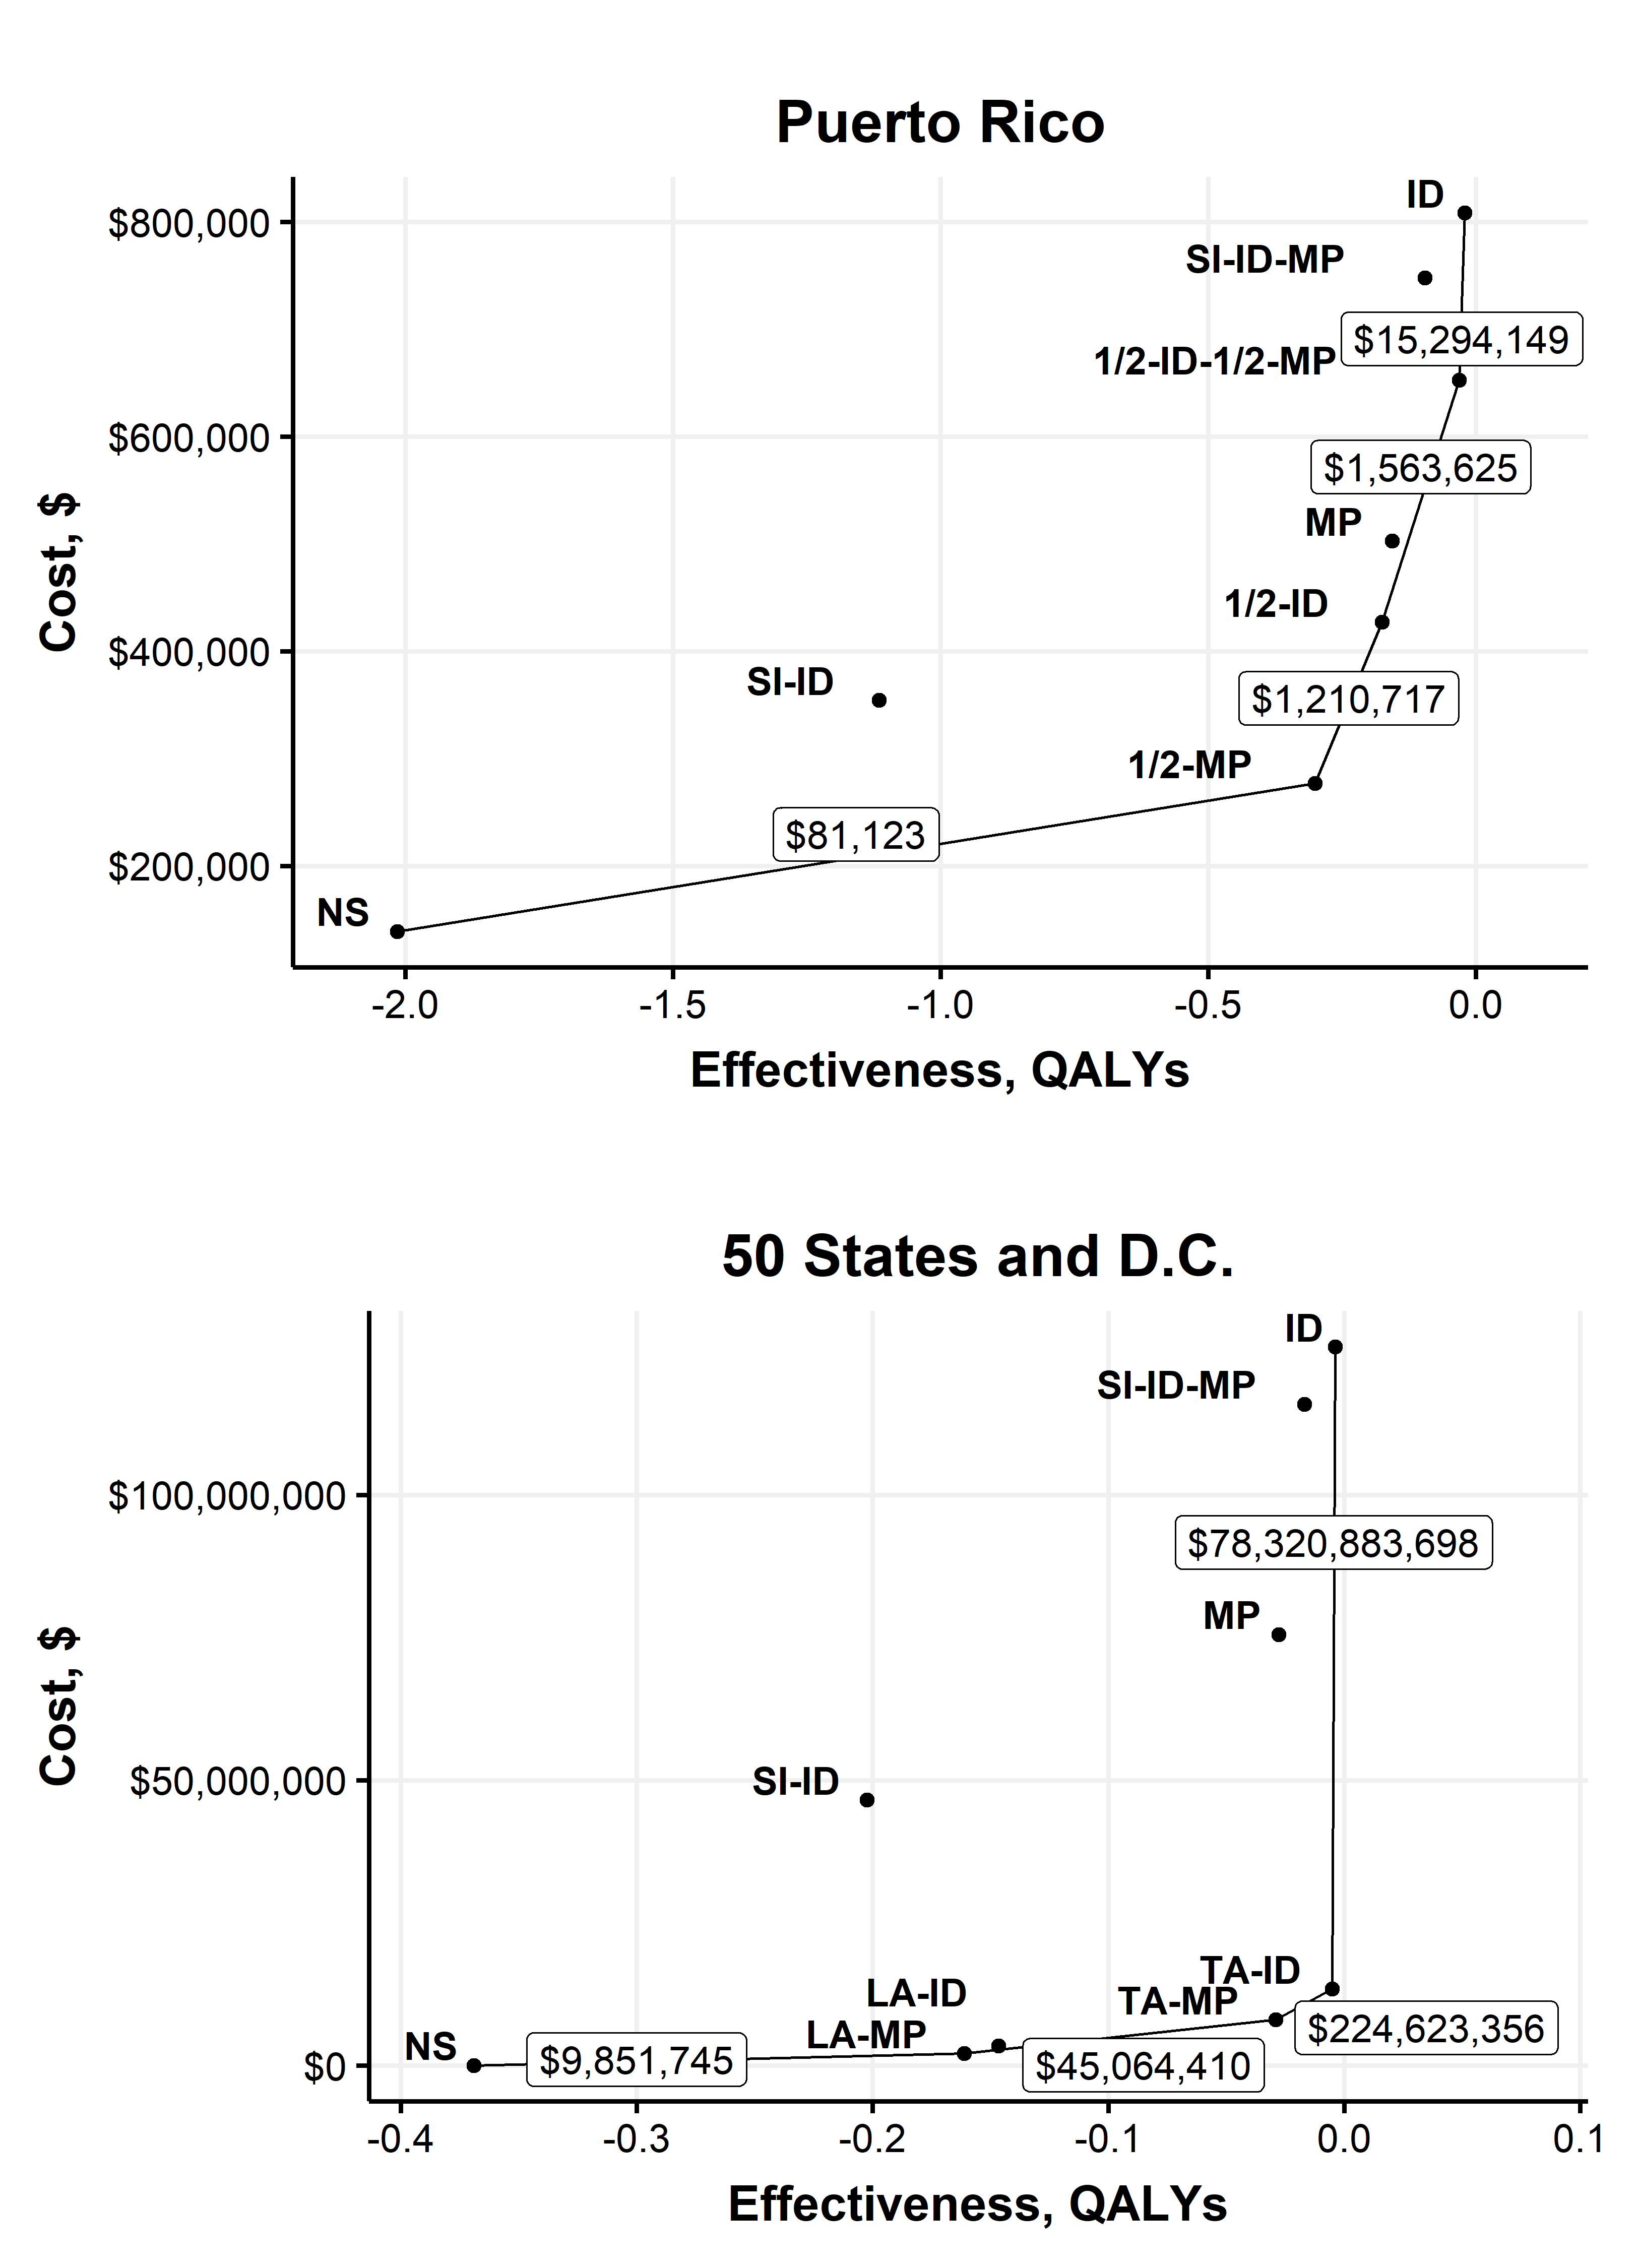
Figure 2.1: Base-case efficiency frontier plot.
Testing Strategy1 | Transfusion-transmissions | Mild febrile illness | Guillain-Barre Syndrome | Congenital Zika Syndrome | QALYs lost |
Puerto Rico | |||||
No screening | 242.4 (194.2 - 291.0) | 44.47 (24.66 - 69.76) | 0.06237 (0.04069 - 0.09193) | 0.03085 (0.00000 - 0.11165) | 2.015 (0.259 - 5.174) |
½-MP | 36.1 (23.9 - 50.1) | 6.62 (3.34 - 11.24) | 0.00946 (0.00547 - 0.01478) | 0.00456 (0.00000 - 0.01701) | 0.3 (0.036 - 0.789) |
SI-ID | 222.3 (177.8 - 267.3) | 40.77 (22.61 - 64.06) | 0.05719 (0.03748 - 0.08452) | 0.00366 (0.00000 - 0.02309) | 1.115 (0.190 - 3.222) |
½-ID | 21.1 (13.0 - 31.2) | 3.87 (1.86 - 6.77) | 0.00561 (0.00298 - 0.00911) | 0.00267 (0.00000 - 0.01023) | 0.175 (0.021 - 0.466) |
MP | 18.7 (10.0 - 29.6) | 3.44 (1.48 - 6.41) | 0.00482 (0.00234 - 0.00872) | 0.00236 (0.00000 - 0.00912) | 0.156 (0.018 - 0.426) |
½-ID-MP | 3.7 (1.4 - 8.1) | 0.68 (0.22 - 1.61) | 0.00097 (0.00034 - 0.00219) | 0.00047 (0.00000 - 0.00187) | 0.031 (0.003 - 0.093) |
SI-ID-MP | 17.4 (9.3 - 27.4) | 3.18 (1.38 - 5.92) | 0.00447 (0.00218 - 0.00809) | 0.00054 (0.00000 - 0.00272) | 0.095 (0.014 - 0.282) |
ID | 2.5 (0.3 - 7.0) | 0.46 (0.05 - 1.40) | 0.00064 (0.00007 - 0.00190) | 0.00032 (0.00000 - 0.00139) | 0.021 (0.001 - 0.074) |
50 U.S. States and DC | |||||
No screening | 44.69 (32.08 - 59.08) | 8.205 (4.257 - 13.525) | 0.01185 (0.00575 - 0.02094) | 0.00569 (0.00000 - 0.02161) | 0.369 (0.045 - 0.973) |
LA-MP | 19.43 (12.32 - 28.50) | 3.565 (1.727 - 6.249) | 0.00524 (0.00257 - 0.00888) | 0.00251 (0.00000 - 0.00935) | 0.161 (0.019 - 0.434) |
LA-ID | 17.65 (10.78 - 26.53) | 3.239 (1.519 - 5.750) | 0.00478 (0.00223 - 0.00826) | 0.00228 (0.00000 - 0.00860) | 0.147 (0.017 - 0.397) |
TA-MP | 3.51 (1.88 - 5.72) | 0.645 (0.273 - 1.204) | 0.00093 (0.00038 - 0.00181) | 0.00045 (0.00000 - 0.00171) | 0.029 (0.003 - 0.080) |
TA-ID | 0.62 (0.19 - 1.44) | 0.114 (0.031 - 0.282) | 0.00016 (0.00005 - 0.00041) | 0.00008 (0.00000 - 0.00033) | 0.005 (0.000 - 0.016) |
SI-ID | 40.96 (29.37 - 54.16) | 7.523 (3.891 - 12.388) | 0.01087 (0.00517 - 0.01937) | 0.00075 (0.00000 - 0.00532) | 0.202 (0.032 - 0.616) |
MP | 3.35 (1.75 - 5.56) | 0.616 (0.255 - 1.161) | 0.00089 (0.00035 - 0.00176) | 0.00043 (0.00000 - 0.00162) | 0.028 (0.003 - 0.076) |
SI-ID-MP | 3.11 (1.63 - 5.13) | 0.571 (0.238 - 1.073) | 0.00082 (0.00033 - 0.00164) | 0.0001 (0.00000 - 0.00056) | 0.017 (0.002 - 0.052) |
ID | 0.45 (0.05 - 1.25) | 0.082 (0.008 - 0.245) | 0.00012 (0.00001 - 0.00036) | 0.00006 (0.00000 - 0.00026) | 0.004 (0.000 - 0.013) |
11/2-ID is ID-NAT in high mosquito season and NS in low season, 1/2-ID-1/2-MP is ID-NAT in high mosquito season and MP-NAT in low season, 1/2-MP is MP-NAT in high mosquito season and NS in low season, ID is universal ID-NAT, LA-ID is ID-NAT in areas with a known local transmission only, LA-MP is MP-NAT in areas with a known local transmission only, MP is universal MP-NAT, SI-ID is an SI policy wherein donations were screened with ID-NAT for components intended to be transfused to women of childbearing age and others are not screened, SI-ID-MP is an SI policy wherein donations were screened with ID-NAT for components intended to be transfused to women of childbearing age and others are screened with MP-NAT, TA-ID is ID-NAT for donors who traveled to or resided in an area with a known local transmission only, and TA-MP is MP-NAT for donors who traveled to or resided in an area with a known local transmission only. | |||||
Testing Strategy1 | Blood Center Costs, $ | Total Costs, $ | CER, $/QALY | ICER, $/QALY |
Puerto Rico2 | ||||
No screening | 0 | 139,054 (29,139 - 497,617) | 0 | 0 |
½-MP | 255,928 (163,259 - 348,398) | 276,857 (177,953 - 377,319) | 81,123 (-51,420 - 962,264) | 81,123 (-49,138 – 978,242) |
SI-ID | 290,308 (185,383 - 396,326) | 354,400 (237,571 - 496,620) | 238,082 (-31,520 - 8,786,719) | Dominated |
½-ID | 414,689 (322,901 - 505,903) | 426,989 (332,985 - 520,014) | 157,972 (-11,183 - 1,579,396) | 1,210,717 (180,987 - 17,481,704) |
MP | 491,908 (307,695 - 675,952) | 502,694 (316,307 - 685,628) | 197,295 (387 - 1,868,748) | Dominated |
½-ID-MP | 650,670 (517,116 - 782,000) | 652,827 (518,894 - 784,574) | 261,178 (34,049 - 2,371,332) | 1,563,625 (602,055 – 16,552,332) |
SI-ID-MP | 742,325 (540,296 - 944,918) | 748,004 (546,160 - 950,375) | 319,692 (52,687 - 2,857,204) | Dominated |
ID | 807,126 (624,350 - 989,434) | 808,568 (625,666 - 991,180) | 338,597 (62,630 - 2,986,579) | 15,294,149 (2,904,119 – 175,2491064) |
50 U.S. States and DC3 | ||||
No screening | 0 | 53,551 (11,421 - 150,845) | 0 | 0 |
LA-MP | 2,079,838 (1,277,703 - 2,885,116) | 2,103,296 (1,296,823 - 2,908,682) | 9,764,188 (3,263,765 - 87,892,767) | 9,764,188 (3,263,765–87,892,767) |
LA-ID | 3,465,969 (2,657,780 - 4,270,295) | 3,487,310 (2,680,188 - 4,287,849) | 15,282,339 (5,362,535 - 139,242,896) | Dominated |
TA-MP | 8,054,528 (4,855,727 - 11,486,512) | 8,058,739 (4,857,917 - 11,490,505) | 23,269,218 (8,022,837 - 198,403,630) | 44,410,459 (15,039,158 -404,204,778) |
TA-ID | 13,425,731 (9,998,974 - 17,068,519) | 13,426,473 (9,999,287 - 17,069,172) | 36,318,496 (13,144,502 - 311,915,973) | 221,920,553 (49,527,034 - 2,487,108,892) |
SI-ID | 46,510,385 (29,205,314 - 63,446,287) | 46,542,765 (29,230,654 - 63,467,869) | 276,761,879 (80,882,010 - 9,065,174,788) | Dominated |
MP | 75,540,178 (46,390,778 - 104,954,608) | 75,544,196 (46,392,146 - 104,956,114) | 218,581,926 (77,525,263 - 1,853,332,117) | Dominated |
SI-ID-MP | 115,920,786 (83,284,293 - 148,722,291) | 115,923,413 (80,882,010 - 9,065,174,788) | 325,111,260 (136,757,865 - 1,657,777,591) | Dominated |
ID | 125,933,860 (96,514,402 - 155,206,839) | 125,934,396 (96,514,892 - 155,207,118) | 340,543,125 (125,100,983 - 2,898,116,601) | 78,410,982,785 (28,942,362,884 -719,981,482,450) |
11/2-ID is ID-NAT in high mosquito season and NS in low season, 1/2-ID-1/2-MP is ID-NAT in high mosquito season and MP-NAT in low season, 1/2-MP is MP-NAT in high mosquito season and NS in low season, ID is universal ID-NAT, LA-ID is ID-NAT in areas with a known local transmission only, LA-MP is MP-NAT in areas with a known local transmission only, MP is universal MP-NAT, SI-ID is an SI policy wherein donations were screened with ID-NAT for components intended to be transfused to women of childbearing age and others are not screened, SI-ID-MP is an SI policy wherein donations were screened with ID-NAT for components intended to be transfused to women of childbearing age and others are screened with MP-NAT, TA-ID is ID-NAT for donors who traveled to or resided in an area with a known local transmission only, and TA-MP is MP-NAT for donors who traveled to or resided in an area with a known local transmission only. | ||||
2In probabilistic sensitivity analysis for Puerto Rico, MP was dominated in 63% of iterations while ½-ID was dominated in 37% of iterations. The ICER for MP was 4,053,254 (95% CI 473,074 – 55,073,640). All other dominated strategies were dominated in over 98% of PSA iterations, and all other non-dominated strategies were non-dominated in more than 97% of PSA iterations. | ||||
3In probabilistic sensitivity analysis for the 50 states, LA-ID was dominated in 81% of iterations while TA-MP was dominated in 6% of iterations. The ICER for LA-ID was (95% CI 17,397,486 12,515,891 – 1,076,468,627). All other dominated strategies were dominated in over 97% of PSA iterations, and all other non-dominated strategies were non-dominated in more than 99% of PSA iterations. | ||||
2.3.3 Analysis of rate of ZIKV-infectious donations
In our base-case analysis, we treated all donations positive for ZIKV RNA as potentially infectious. However, donations that are positive for both ZIKV RNA and IgM generally have low viral loads or are resolved infections with neutralizing antibodies and are likely not infectious. Tables 7.14 and 7.15 and Figure 7.4 show key results with donations positive for IgM assumed to be noninfectious. Figure 2.2 shows the cost-effectiveness of ID-NAT and MP-NAT for rates of ZIKV-infectious donations between 1 in 100 million donations and 1 in 10 donations. We estimate that MP-NAT is cost-effective only in donor populations with rates above 1.2 in 1000 donations and that escalation to ID-NAT is cost-effective only in populations with rates above 9.8 in 1000 donations. Among the donor populations considered in this analysis (assuming that all donations positive for ZIKV RNA are infectious), only donors from Puerto Rico during high mosquito season had a rate of ZIKV-infectious donations that was high enough for ID-NAT or MP-NAT to be cost-effective. As shown in Figure 2.3, MP-NAT had a positive predictive value above 95% even at rates of ZIKV-infectious donations as low as 1 in 10 million donations. In contrast, ID-NAT had a positive predictive value less than 25% for rates below 1 in 100,000 donations.
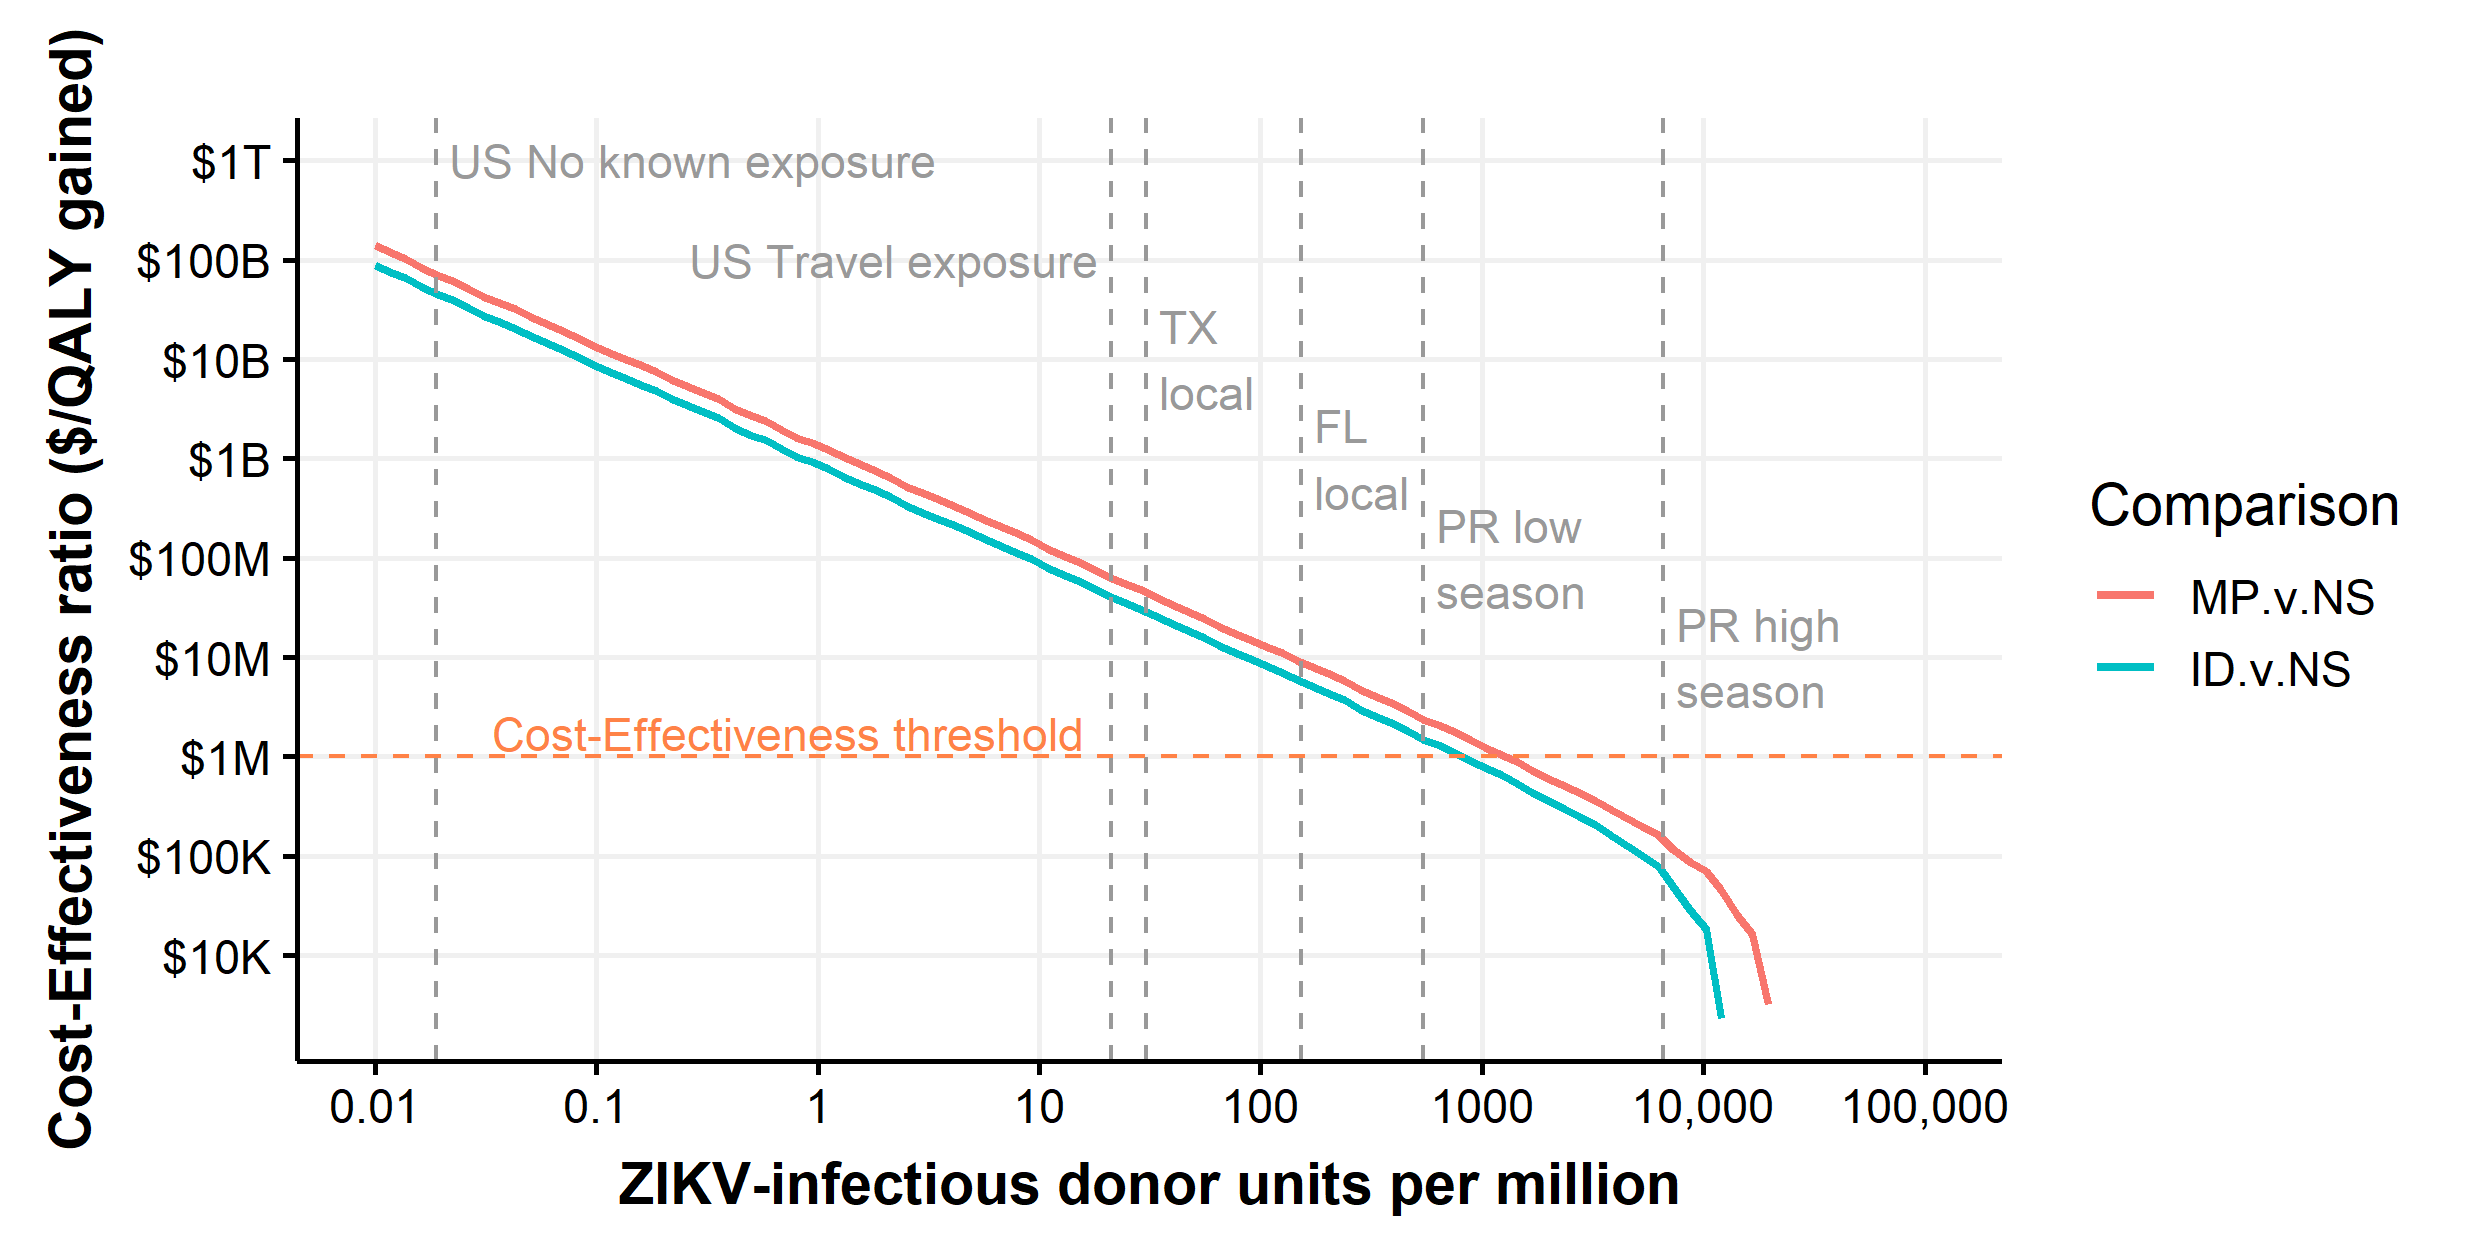
Figure 2.2: Threshold analysis showing the cost-effectiveness ratios of ID-NAT vs. MP-NAT and MP-NAT vs. no intervention as a function of the rate of ZIKV-infectious donations.
Productivity costs for the 50 states were used. Both axes are on a logarithmic scale. At sufficiently high rates of ZIKV-infectious donations, interventions become cost-saving and are no longer plotted. Vertical lines represent the estimated rate of ZIKV-infectious donations for subpopulations considered in our model.
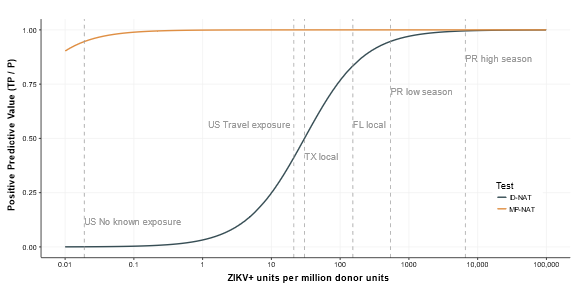
Figure 2.3: Threshold analysis showing the positive predictive value of ID-NAT and MP-NAT as a function of the rate of ZIKV infectious donations
2.3.4 Probabilistic Sensitivity Analysis
At a willingness-to-pay threshold of $1 million per QALY, MP-NAT during high mosquito season only was the preferred policy in Puerto Rico for 64% of probabilistic sensitivity analysis iterations and ID-NAT during high mosquito season only was preferred in 19% of iterations. Through linear regression meta-modeling, we found that the preferred strategy was sensitive to probability of congenital Zika syndrome given maternal infection, duration of febrile illness for recipients, cost of ID-NAT and MP-NAT, and sensitivity of MP-NAT (Figure 2.4). Neither universal ID-NAT nor universal MP-NAT was preferred under any univariate parameter change within ±2 SDs of the expected value.
In the 50 states, no intervention was found to be cost-effective in 99.99% of iterations (Figure 2.5). Linear regression meta-modeling suggested that the preference for no screening was robust to all univariate parameter changes of ±2 SDs. Supplemental Tables 7.5 to 7.12 show all meta-modeling results.
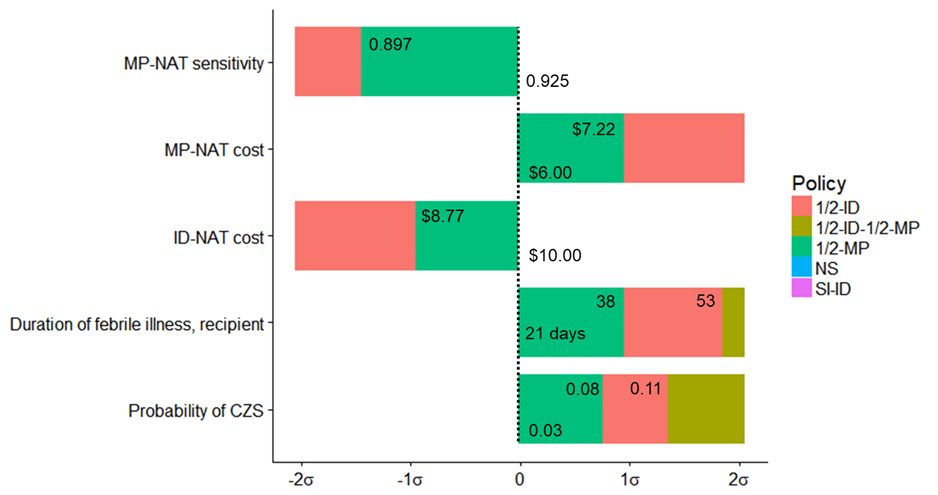
Figure 2.4: Linear regression meta-modeling threshold results for Puerto Rico
At a willingness-to-pay of $1 million per QALY, ½-MP is preferred when all parameters are at their expected value. If the probability of congenital Zika syndrome is increased by 0.8 standard-deviations to 0.077 then ½-ID is preferred. If the probability of congenital Zika syndrome is increased by 1.4 standard-deviations to 0.109 then ½-ID-½-MP is preferred. If the duration of febrile illness for recipients is increased by 1.0 standard-deviations to 38.0, then ½-ID is preferred. If the duration of febrile illness for recipients is increased by 1.9 standard-deviations to 53.5 days then ½-ID-½-MP is preferred. If the cost of ID-NAT testing is decreased by 1.0 standard-deviations, from $10 to $8.77, then SI-ID is preferred. If the cost of MP-NAT testing is increased by 1.0 standard-deviations, from $6 to $7.22, then SI-ID is preferred. If the sensitivity of MP-NAT testing is decreased by 1.5 standard-deviations, from 0.925 to 0.897, then SI-ID is preferred.
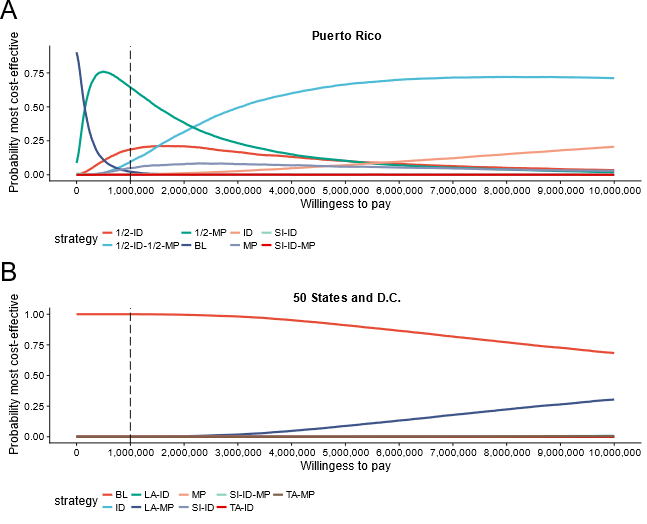
Figure 2.5: Plot showing the probability that a strategy is preferred (most cost-effective) at a given willingness-to-pay threshold.
Vertical line indicates the alternative blood safety willingness-to-pay threshold of $1 million per QALY.
2.3.5 TTZ Versus Non-TTZ Cohort Analysis
Patients who experienced transfusion-transmitted Zika (TTZ) in our simulation differed from those without TTZ. In Puerto Rico, the average number of components received (11.3 vs. 3.5 components; P < 0.001) and the proportion of components received that were plasma (36% vs. 20%; P < 0.001) were higher for recipients with TTZ. We found that recipients with TTZ were less likely to be younger than 5 years (P = 0.005) or older than 75 years (P < 0.001) than those without TTZ. We also found that patients with TTZ had a lower expected survival time at baseline (1.3 years lower baseline survival; CI, 1.2 to 1.4). Table 7.13 shows similar findings for the 50 states, and Figure 2.6 compares the distributions of key characteristics between recipients with TTZ and other recipients.
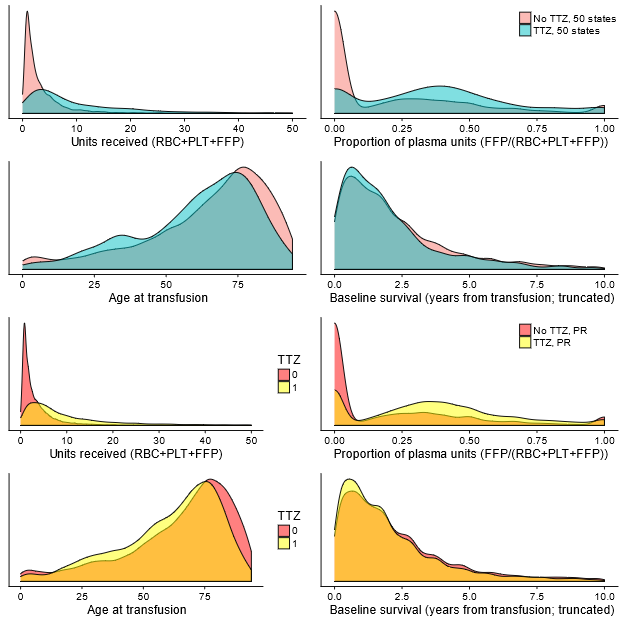
Figure 2.6: Density plots for recipients experiencing transfusion-transmission versus other recipients.
Top four plots are for 50 states, bottom four plots are for Puerto Rico.
2.3.6 Two-year follow-up
Two months after the publication of the original analysis, the Blood Products Advisory Committee (BPAC) recommended continuing universal screening, citing uncertainty in the risk of serious complications, and the committee agreed to reassess one year later [84]. The April 2020 BPAC meeting had been indefinitely postponed as of December 2020 due to the current COVID-19 pandemic. Universal screening yielded 3 presumed viremic donations in 2018 and zero in 2019-20 as of December 3, 2020 [61].
Without screening, mild febrile illness caused by TT-Zika would have occurred at an estimated rate of one case every 1.4 months (98% Credible Interval [CrI] every 0.9 – 2.7 months) during the original period of analysis (2016-17). For 2018, the estimated rate of mild febrile illness in 2018 without screening was below one case every 1.3 years in 99% of simulations (Figure 2.7).
Serious TT-Zika complications were unlikely. For the rate of congenital Zika syndrome to exceed one case per decade, the rate of Zika-infectious donations needed to exceed 96 per million (98% CrI 33 – 673 per million), 23 times larger than the rate observed in the first year of screening. For the rate of Guillain-Barré syndrome to exceed one case per decade, the rate of Zika-infectious donations needed to exceed 34 per million (98% CrI 23 – 54 per million), 8 times larger than the rate observed in the first year of screening. In 99% of simulations, the estimated rate of congenital Zika syndrome cases was below one case every 1483 years at the 2018 Zika-infectious donation rate, and the rate of Guillain-Barré syndrome cases was below one case every 1035 years. In 2018, universal minipooled testing cost $5.1 billion per quality-adjusted life year gained compared to no screening (98% CrI $0.77 – 16 billion; Figure 2.8).
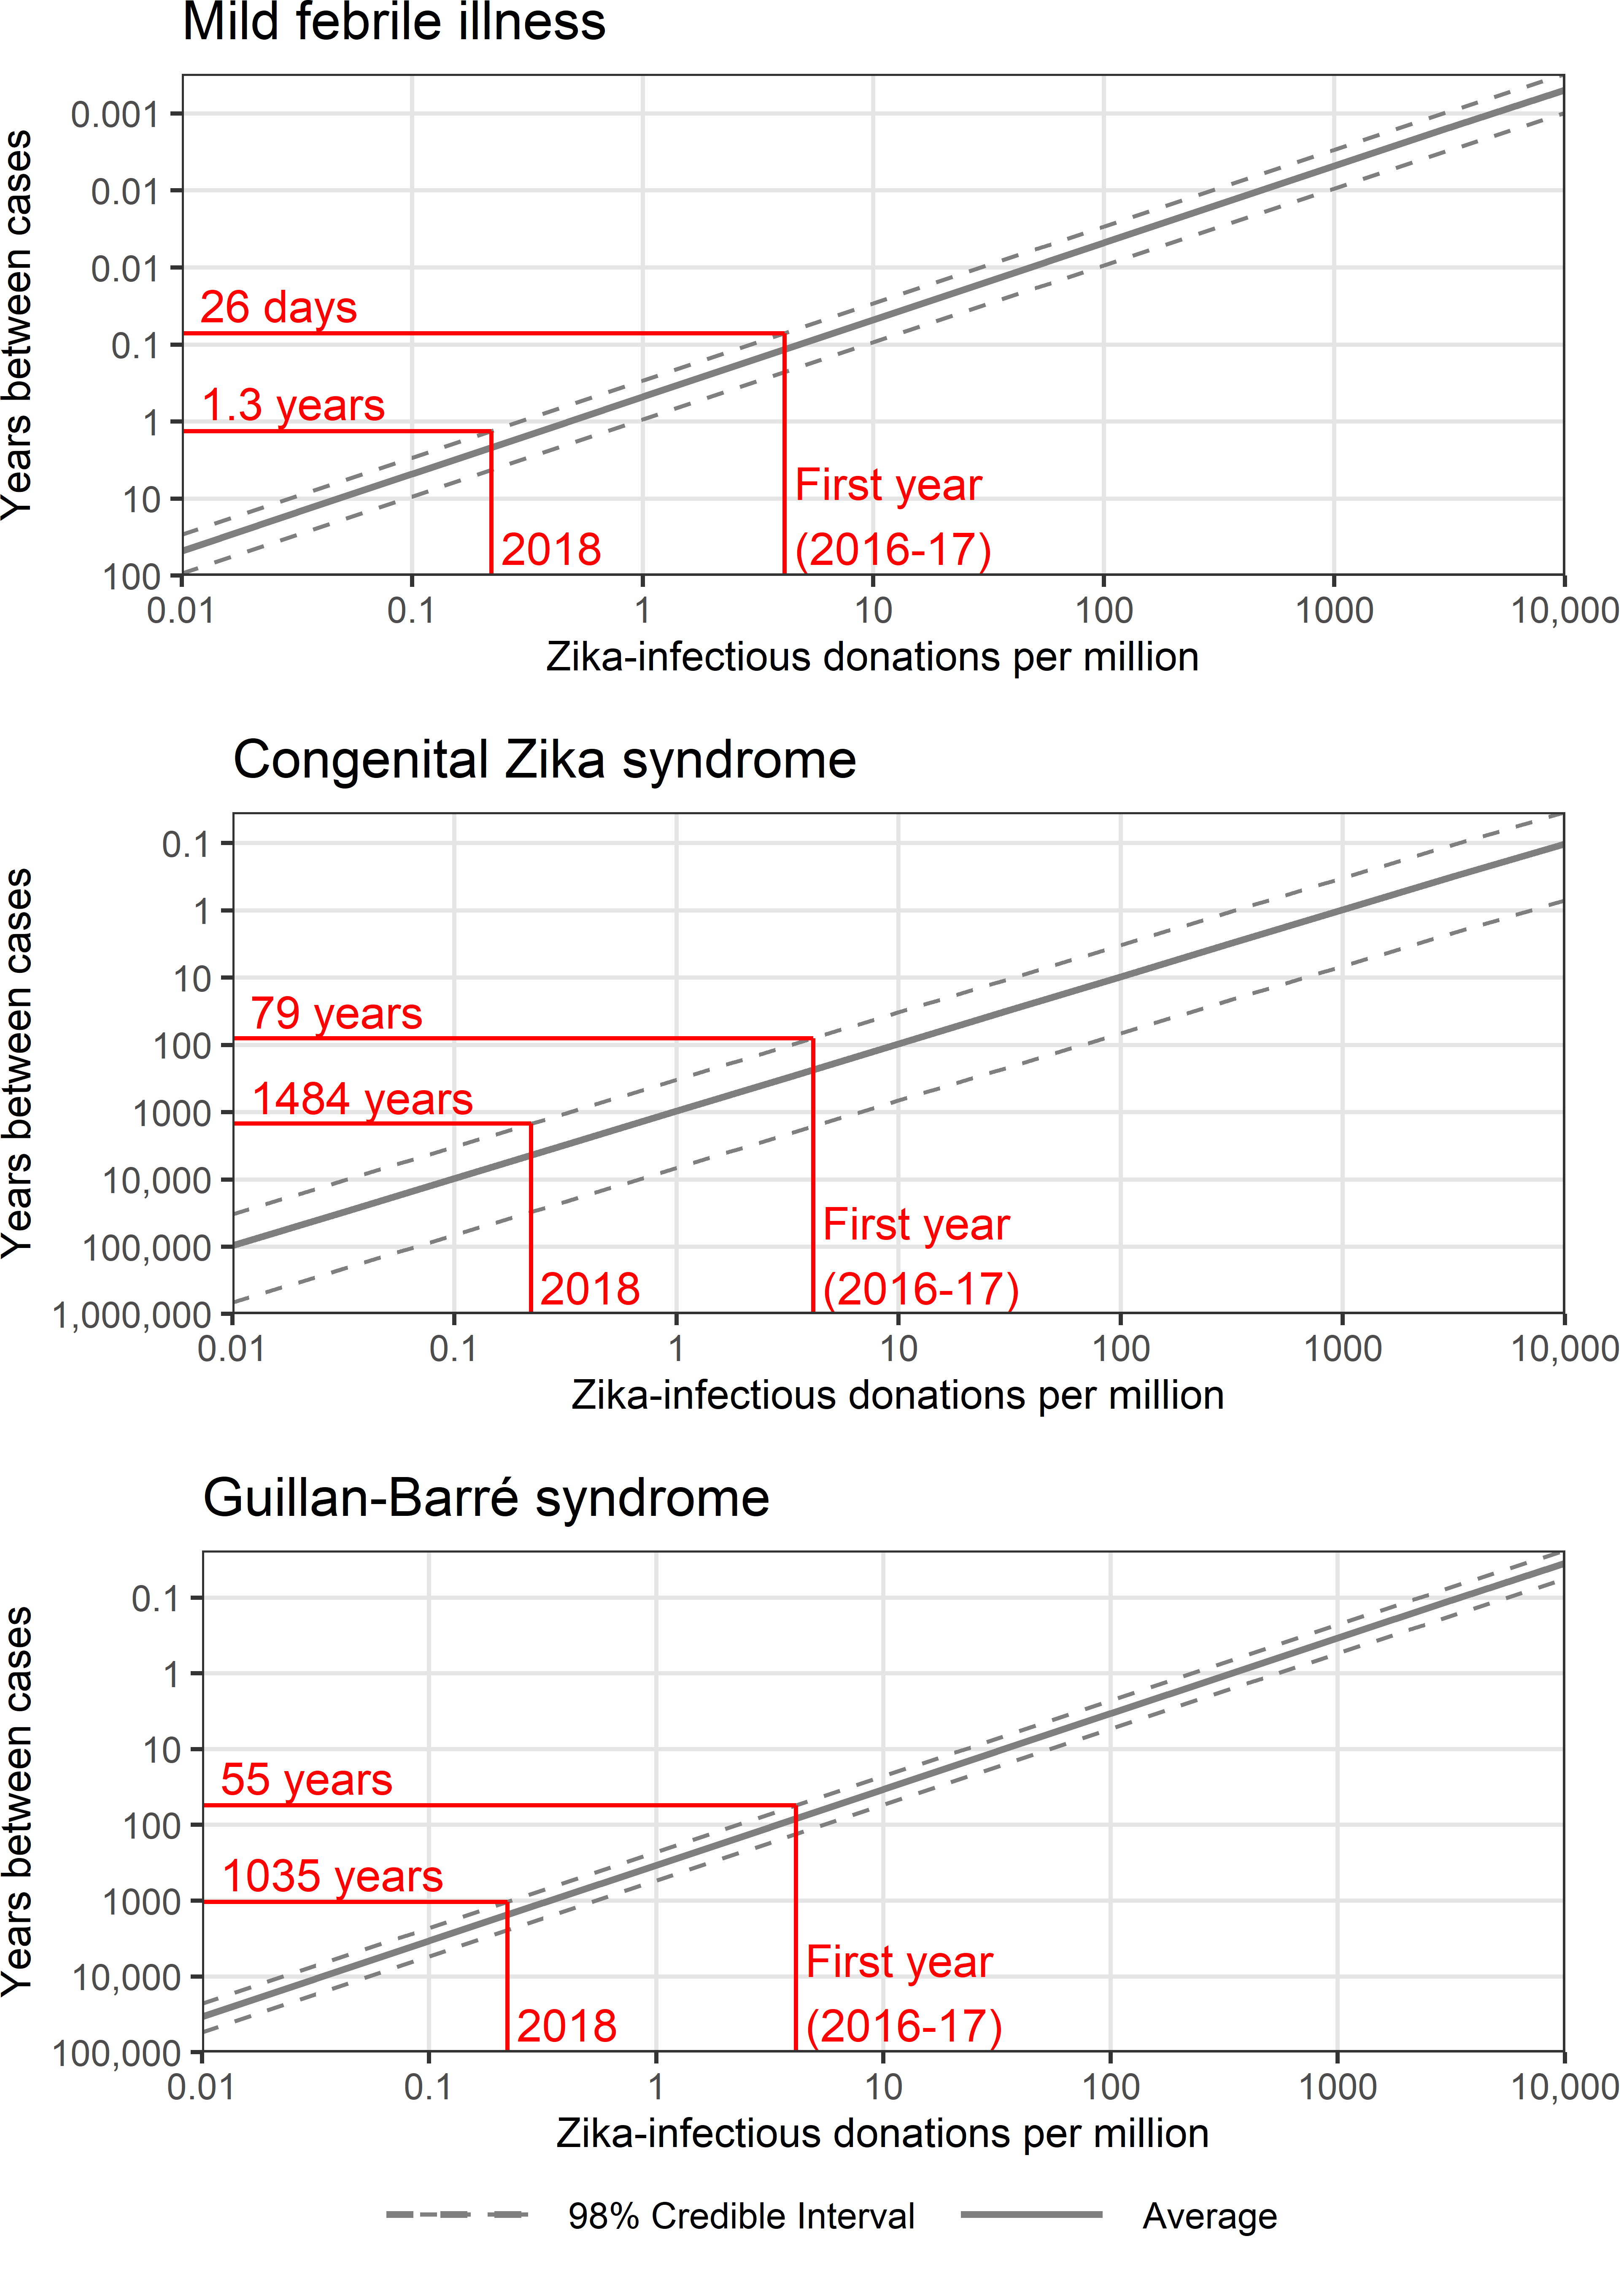
Figure 2.7: The expected rate of transfusion-transmitted Zika adverse outcomes based on the rate of Zika-infectious donations.
In red, two example Zika-infectious donation rates are indicated with the corresponding 99th percentile estimates of the rate of adverse outcomes.
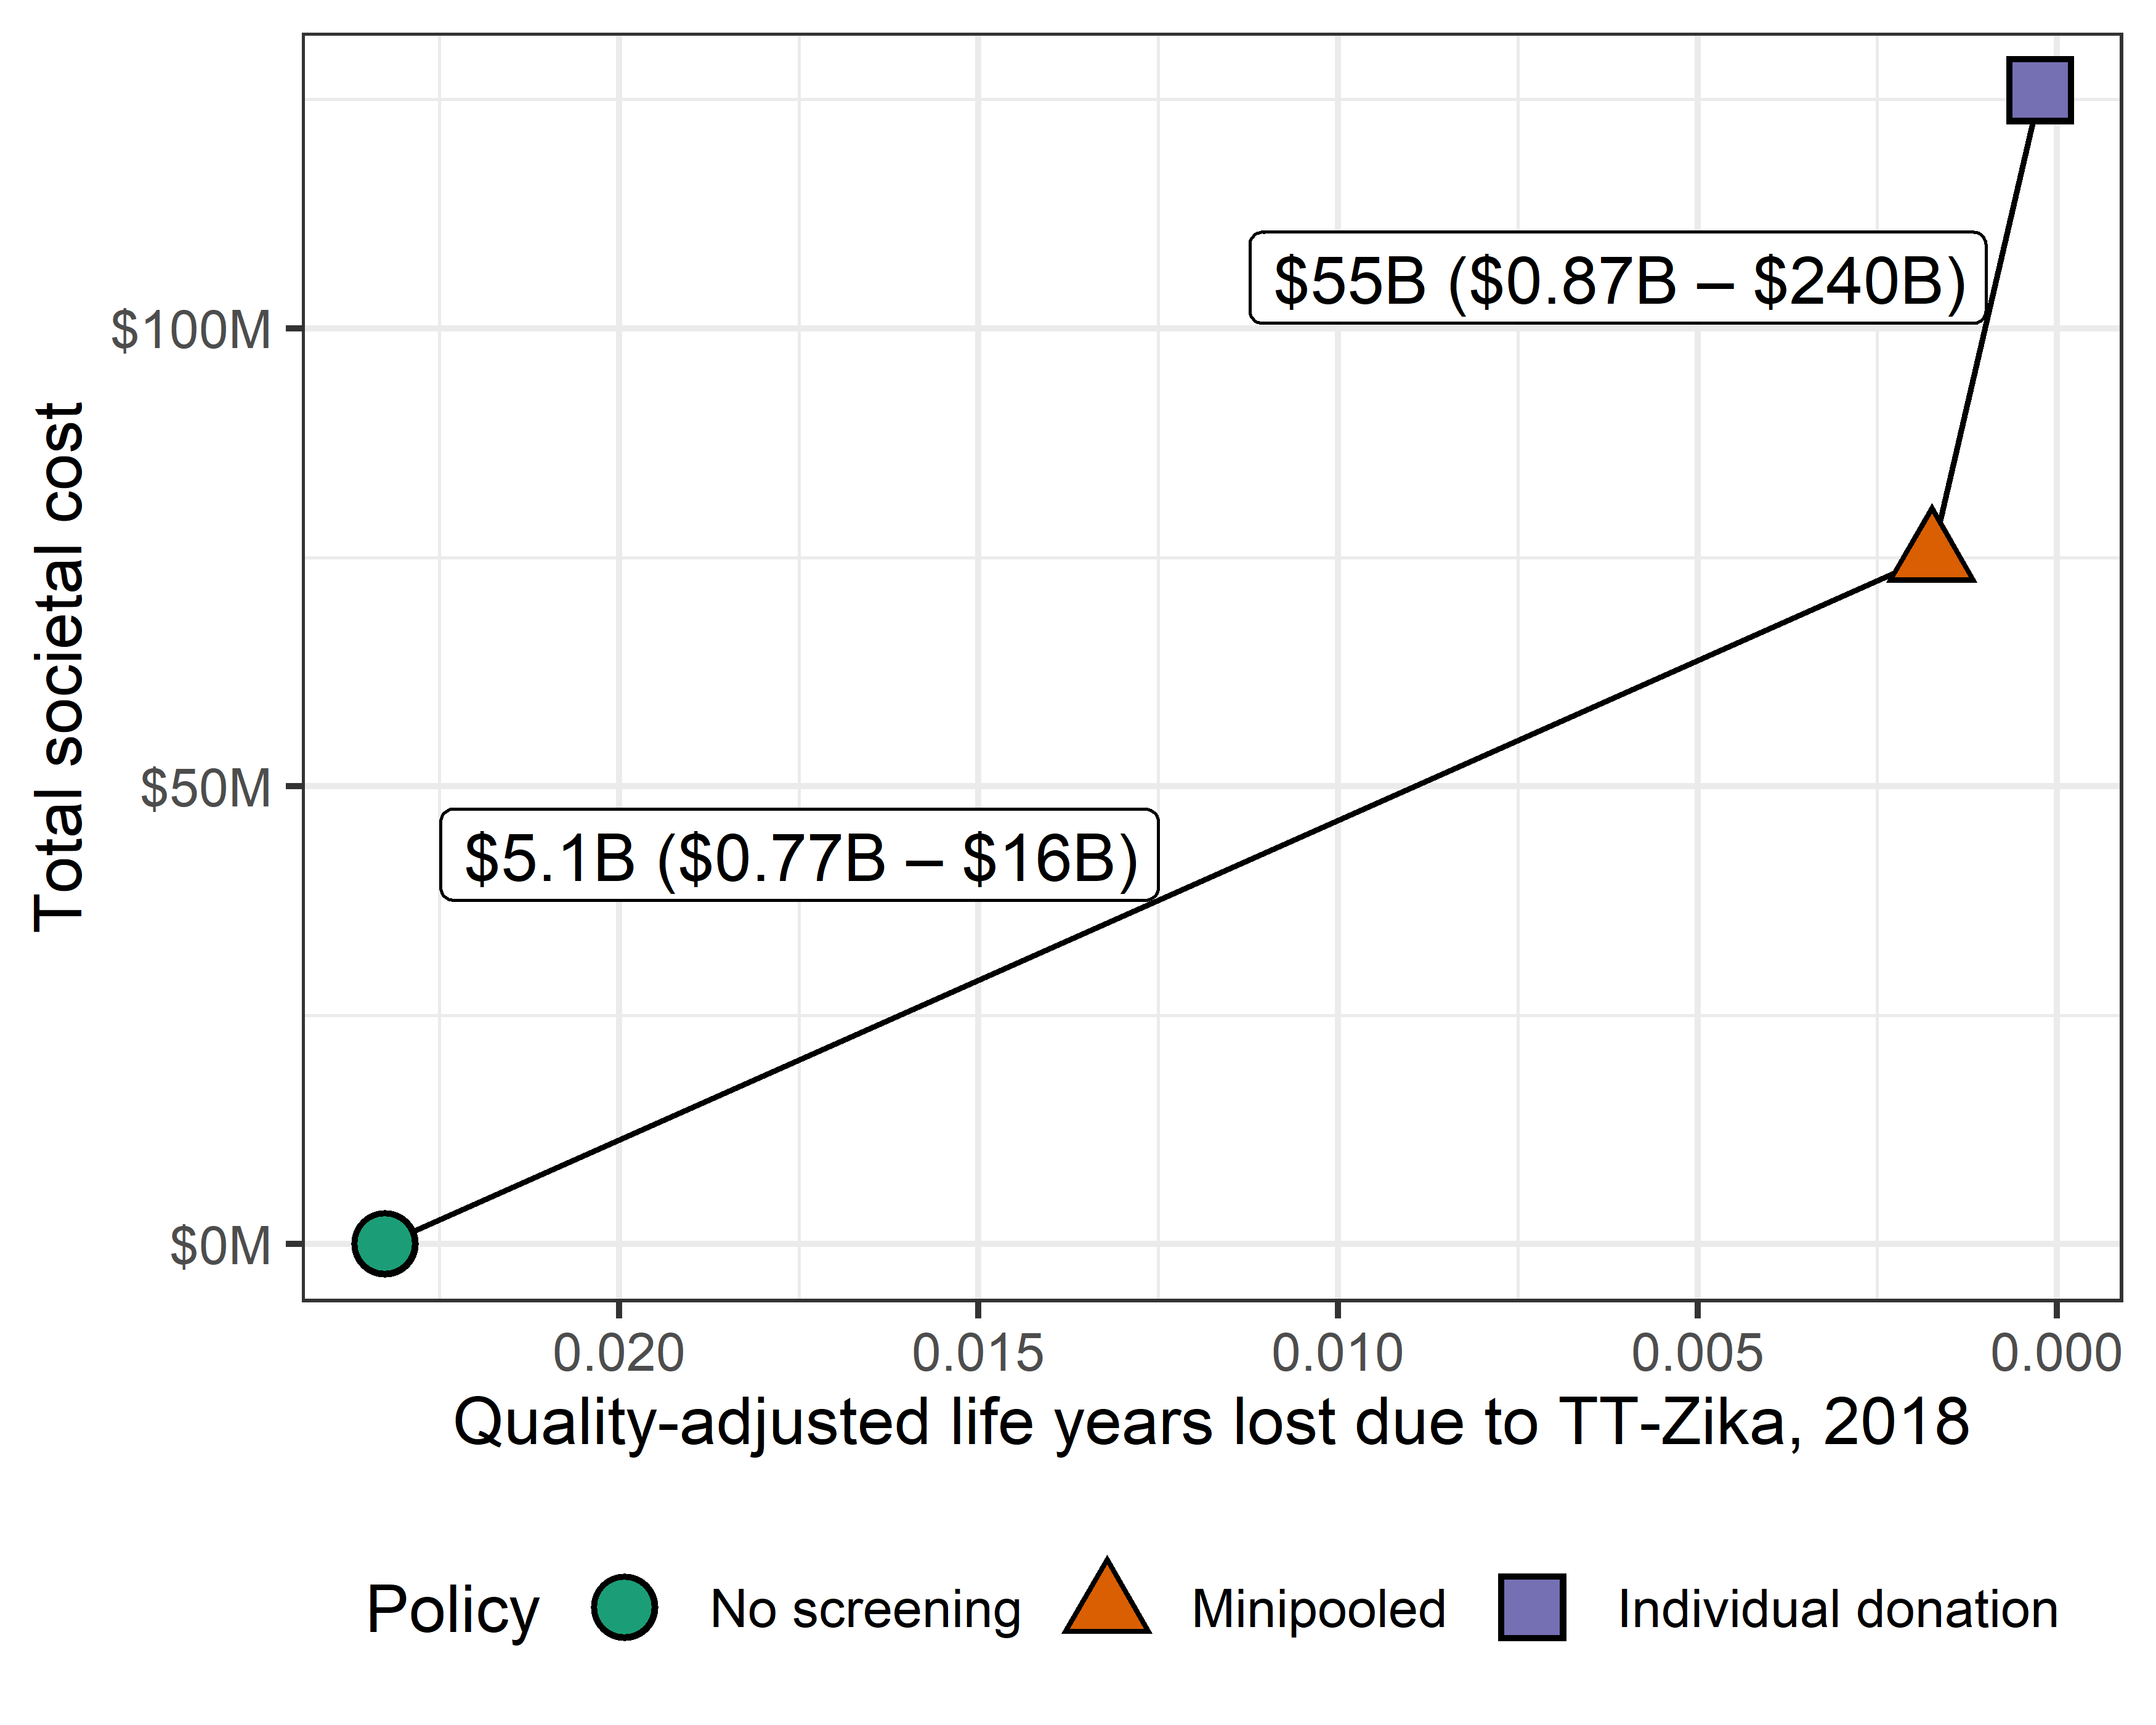
Figure 2.8: Incremental cost-effectiveness ratio (ICER) in cost per quality-adjusted life years gained of minipooled screening compared to no screening and of individual donation screening compared to minipooled screening based on the 2018 rate of Zika-infectious donations.
The average cost and effectiveness of 10,000 simulations are plotted. Connecting ICER lines are labeled with the average and 98% credible interval ICER estimates.