4.4 Case study: West Nile and Zika Virus in the U.S.
Both West Nile virus (WNV) and Zika virus are most often transmitted by mosquitos but can also be transmitted by blood transfusion [35]. For both diseases, more than 70% of infected individuals never exhibit symptoms [67,125], creating a high risk of collecting a donation from a donor who is unaware of their infection. Incidence of both viruses varies geographically, seasonally, and annually, largely due to differences in mosquito populations, necessitating regular reassessment of blood safety policy. Available interventions include nucleic acid testing (NAT), pathogen inactivation, and donor deferral. Currently, the United States mandates year-round mini-pooled (MP-)NAT testing for both Zika and WNV in all areas and requires that regions temporarily escalate to individual donation (ID-)NAT for WNV following the detection of a confirmed positive donation [63,126].
4.4.1 Model instantiation
We applied our model to identify the optimal combinations of blood safety interventions for preventing transfusion-transmitted Zika and WNV in blood products derived from whole blood donations in the U.S. We considered four screening tests (ID-NAT and MP-NAT for Zika and WNV) and one risk-reducing modification (pathogen inactivation in plasma components). We segmented donors into groups based on location and season: season and geography are major risk factors for both diseases, and the time of year and location of a blood donation can be directly observed. We identified the optimal portfolio separately for 2017, 2018, and 2019, and we compared these portfolios to no intervention and to universal MP-NAT for Zika and WNV. Parameter values, shown in Table 4.3 <[34,37,83,127–130]>, were derived from the academic literature, reports from AABB and the Centers for Disease Control and Prevention (CDC), and personal communications with blood safety experts. The optimization model was programmed in R. To estimate the harms of releasing a Zika- or WNV-infectious donation into the blood supply we developed microsimulation models of transfusion recipient outcomes in Python.
Parameter12ABCD | Value (range) | Distribution | Source* |
Donation replacement cost, d | $90 (45–135) | Tri | A |
Donation processing cost, w | $20 (10–30) | Tri | A |
Donation disposal cost (excluding replacement), g - d | $60 (30–90) | Tri | A |
Zika ID-NAT cost per donation, φ1 | $10 (5–15) | Tri | Ellingson 2017a |
Zika MP-NAT cost per donation, φ2 | $6 (3–9) | Tri | Ellingson 2017a |
WNV ID-NAT cost per donation, φ3 | $10 (5–15) | Tri | B |
WNV MP-NAT cost per donation, φ4 | $6 (3–9) | Tri | B |
Sensitivity of Zika ID-NAT for Zika, R1,2 | 0.999 (0.998–1) | Tri | C |
Sensitivity of Zika MP-NAT for Zika, R | 0.98 (0.961–0.999) | Tri | C |
Sensitivity of WNV ID-NAT for WNV, R | 0.99 (0.98–1) | Tri | C |
Sensitivity of WNV MP-NAT for WNV, R | 0.95 (0.91–0.99) | Tri | C |
Specificity of Zika ID-NAT for Zika, Q | 0.9997 (0.9994–1) | Tri | C |
Specificity of Zika MP-NAT for Zika, Q | 0.999999999 (0.999999998–1) | Tri | C |
Specificity of WNV ID-NAT for WNV, Q | 0.9997 (0.9994–1) | Tri | C |
Specificity of WNV MP-NAT for WNV, Q | 0.999999999 (0.999999998–1) | Tri | C |
Cost of FFP PI, ψ1 | $81 (40.64–121.92) | Tri | Ellingson 2017b |
Risk reducing multiplier of FFP PI for Zika, H1,1 | 0.64566 (0.51653–0.7748) | Tri | D |
Risk reducing multiplier of FFP PI for WNV, H1,2 | 0.64288 (0.5143–0.77146) | Tri | D |
Red blood cell units transfused per donation † | 0.944 (0.908–0.98) | Tri | D |
Platelet units transfused per donation † | 0.015 (0.012–0.018) | Tri | D |
Plasma units transfused per donation † | 0.541 (0.4328–0.6492) | Tri | D |
Transmissibility of WNV in RBC components † | 1 | Custer 2005 | |
Transmissibility of WNV in PLT components † | 1 | Custer 2005 | |
Transmissibility of WNV in FFP components † | 1 | Custer 2005 | |
Transmissibility of Zika in RBC components † | 0.5 (0.3–0.7) | Tri | Russell 2019 |
Transmissibility of Zika in PLT components † | 0.5 (0.3–0.7) | Tri | Russell 2019 |
Transmissibility of Zika in FFP components † | 0.9 (0.8–1) | Tri | Russell 2019 |
1Abbreviations: FFP, fresh frozen plasma; ID-, individual donation; MP-, minipooled; NAT, nucleic acid testing; PI, pathogen inactivation; Tri, triangular distribution; WNV, West Nile virus. | |||
2These parameters are used in the calculation of c, the net monetary cost of failing to interdict an infectious donation, together with output from the recipient-level microsimulation. | |||
AAssumption based in part on de Kort 2014. | |||
BAssumed costs same as Zika. | |||
CPersonal communication with Dr. Michael Busch from Vitalant Research Institute/UCSF. | |||
DCalculated from Ellingson 2017 and Custer 2010. | |||
4.4.1.1 Tests and modifications
We evaluated ID-NAT and MP-NAT for both WNV and Zika. In MP-NAT, the test is run on a pooled sample of 6 or 16 donations, reflecting the pool size in the two high-throughput NAT platforms used for blood donation testing in the United States (Grifols Panther and Roche Cobas), with subsequent individual donation testing for any minipool that is initially reactive. The two platforms used for MP-NAT have a similar cost per reportable result and similar sensitivity and specificity, so we consider them interchangeably as a generic MP-NAT testing intervention. MP-NAT can reduce the number of tests run per sample and therefore has a lower per-donation cost than ID-NAT [128], but also a lower sensitivity. However, because the minipooled testing procedure requires both a reactive minipool and a subsequent reactive ID-NAT test, the risk of a false positive is much smaller than with ID-NAT.
Pathogen inactivation (PI) is a modification that can greatly reduce the transmission risk for many types of viruses and bacteria, including lipid-enveloped RNA viruses like Zika and WNV [90]. PI is currently only approved in the U.S. for treating plasma or platelet components, not whole blood donations or red cell components. Because platelet PI is typically done for apheresis rather than whole blood-derived platelets in the U.S., we only included PI of whole blood-derived plasma as a possible blood safety intervention. We assumed that PI decreases risk of transmission by plasma exposure by 99% for both Zika and WNV. Based on our calculations using the 2015 National Blood Collection and Utilization Survey [34], plasma exposure accounts for 36% of the transfusion-transmission risk of an infectious whole blood donation, yielding a per-donation risk reduction multiplier of approximately 65%.
4.4.1.2 Donor groups
Donor segmentation should be based on factors that are easy to observe or elicit from potential donors, well-correlated with disease risk, and allow risk estimation across donor groups. AABB biovigilance reports contain the donation date and zip code for all donations reactive for WNV or Zika for the years 2017, 2018, and 2019 [131,132]. We segmented U.S. donors, including those in Puerto Rico, geographically by 3-digit zip code because prevalence estimation would be less robust with a more granular segmentation, and a less granular segmentation would allow for less distinction by risk. We also segmented donors seasonally. Based on an analysis of confirmed positive cases, we defined the high mosquito season as April to September (Supplemental Figure 9.1). To estimate the number of people in each 3-digit zip code for each year 2017-2019, we multiplied 2010 U.S. census population estimates by the estimated population change for each state [133]. We estimated the total number of annual whole blood donations from the 2015 National Blood Collection and Utilization Survey (NBCUS) [34] for the 50 states and the District of Columbia and from a previous analysis for Puerto Rico [37]. We assumed that the number of donations collected in each zip code was proportional to population and evenly distributed across the high and low mosquito seasons. We treated initially reactive donations that did not undergo confirmatory testing as fractions of a case, equal to the positive predictive value for that TTI in that year.
To analyze how donor segmentation impacts the optimal portfolio, we also performed an analysis where donors were segmented by state instead of by 3-digit zip code. In this analysis Puerto Rico and Washington D.C. were treated as states, and the probability of an infectious blood donation each year was based on CDC data on viremic blood donations interdicted by testing [61,134]. The risk assigned to a state was assumed to be proportional to the number of CDC-reported symptomatic cases for that area [61,134]. Supplemental Table 9.3 shows data for the state-level donor groups. Similar data for zip code-level donor groups are available at [TO do: add link].
4.4.1.3 Costs and QALYs
A 2014 analysis in the Netherlands estimated that the cost of a donation visit resulting in deferral cost the donor €16 in lost time and transportation and cost the blood center €2.65 – €31.82 depending on whether the donor was a routine donor or a first-time donor who needed to be recruited [20]. The cost of recruiting, inviting, and evaluating a replacement donor was €2.58 – €31.25, yielding a total deferral cost of €21.23 for routine donors and €79.07 for first-time donors. Donors who are deferred are less likely to present to donate in the future than those who donate successfully [135], an additional cost not captured in the 2014 analysis. No data were available for the U.S., so we assumed that the replacement cost for a deferred donor in the U.S. was $90. We also assumed a donation processing cost of $20 and a donation disposal cost of $60, which reflects confirmatory testing and donor notification costs.
To estimate the societal costs (medical expenses and productivity loss due to illness and death) and QALYs lost that result from transfusion transmission, we developed separate microsimulations for each disease (Zika and WNV). Figure 4.1 shows the decision tree structures for the two models and Supplemental Tables ?? <[37,136]> and ?? <[[9]; [129]; [130]; USBLS2020]> show all model parameters. In these models, adapted from a prior study [37], we simulated individual transfusion recipients whose age, sex, and number of red blood cell, platelet, and plasma components transfused followed a similar distribution to transfusion recipients in the U.S. The expected post-transfusion survival for each recipient was calculated as a function of age and the number and type of blood components transfused [37]. For the Zika model, we adapted parameters including probabilities, costs, and QALY multipliers for Zika fever and more severe sequelae from the prior publication, updating costs to 2019 US dollars using the personal healthcare component of the National Health Expenditure Data provided by the Centers for Medicare and Medicaid Services [137]. We used Consumer Expenditure Surveys from the U.S. Bureau of Labor Statistics [136] to estimate age-specific productivity loss due to illness or premature death (for premature death, consumption was netted from productivity). The Zika model also captured costs and QALY losses due to secondary sexual or congenital transmission of Zika to a transfusion recipient’s sexual partner or offspring. For the WNV model, recipients could experience asymptomatic infection, acute WNV fever, or one of three neurological diseases (meningitis, encephalitis, or acute flaccid paralysis). Secondary transmission was not modeled. Transfusion recipients experiencing acute disease were also at risk for long-term disability. We developed the WNV model using parameter values from a recent cost-effectiveness analysis of a WNV vaccine [129] and a study of the costs of WNV infection [130], updating costs to 2019 US dollars. In both microsimulations, future costs and QALYs lost were discounted to the present using an annual discount rate of 3% [122].
The recipient microsimulations estimate the outcomes for recipients who receive different numbers and types of whole blood-derived components. We estimated the average outcome by component type with the following weighted average approach:
\[ \bar{O^k_u} = \frac{ \sum_i h^u_i O^k_i}{\sum_{i} h_i^u} \quad \text{for} \quad u=1,2,3 \]
where outcome \(O^k\) is cost incurred or QALYs lost due to disease \(k\), \(u\) is the blood component type, \(i\) indexes individual transfusion recipients, and \(h_i^u\) is the number units of component \(u\) transfused to recipient \(i\). To estimate the expected net health costs of releasing an infectious donation, the average number of components transfused per whole blood donation collected was estimated from the 2015 NBCUS [34] and the component-specific probability of transfusion transmission for both WNV and Zika was estimated from prior studies [37,127]. The expected value of the outcomes (cost and QALY loss) per donation were calculated as follows:
\[ \bar{O}^{k} = \sum_u ( \zeta^k_u )( \lambda_u) \bar{O}^k_u \] where \(\zeta^k_u\) is the probability that disease \(k\) is transmitted to a recipient exposed to an infectious component of type \(u\), and \(\lambda_u\) is the average number of units of component type \(u\) produced per whole blood donation. We used this method to estimate both costs and QALYs lost, which were used to calculate net health cost assuming a willingness-to-pay threshold of $1 million per QALY in the base case [83].
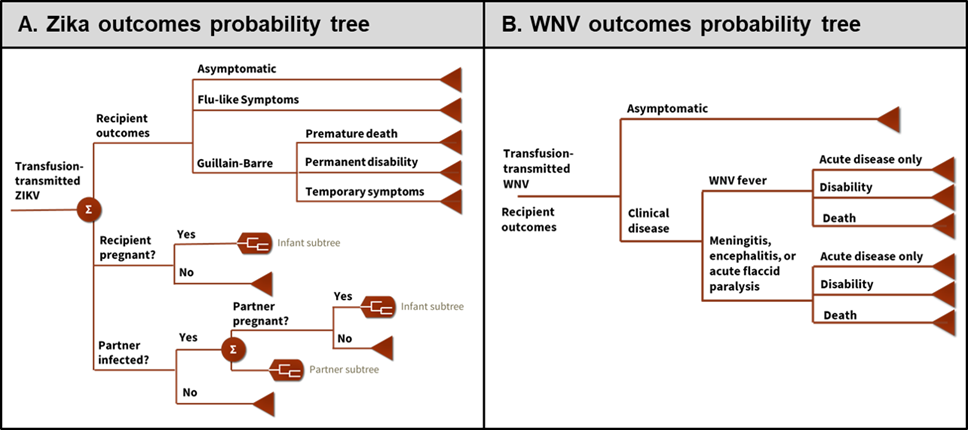
Figure 4.1: Probability trees simulated in the recipient outcomes microsimulation for Zika (A) and for West Nile virus (B).
4.4.1.4 Uncertainty analysis
We performed probabilistic sensitivity analysis by repeating the analysis 10,000 times using input parameters randomly sampled from the probability distributions listed in Tables 4.3, 9.1, and 9.2. We calculated performance metrics and tracked how often each intervention was part of the optimal portfolio for each donor group across all 10,000 iterations. Prevalence and willingness-to-pay were not varied in probabilistic sensitivity analysis but were analyzed in scenario analysis. To do so, we first estimated the optimal policy for a single donor group as a function of WNV and Zika prevalence by computing the optimal policy for 10,000 pairs of WNV and Zika prevalence values. To assess the impact of varying willingness-to-pay, we repeated this analysis for values of $100,000 and $10,000,000 per QALY, in addition to the base case value of $1,000,000 per QALY. In another scenario analysis, we assessed the impact of using the linear approximation described above, which ignores the impact of removing donations testing positive. For this analysis we estimated the optimal policy as a function of prevalence, and we compared the optimal policy by zip code identified using the linear approximation to that identified using the full cost function. Lastly, we performed a scenario analysis using uniform distributions on all of the optimization model parameters. For that scenario, we sampled the net monetary cost of a releasing a WNV- or Zika-infectious donation from a uniform distribution between the 1st and 99th percentiles of the outputs of the microsimulations.
4.4.2 Results of case study
Releasing a Zika-infectious donation would result in an estimated average loss of 0.0082 QALYs (95% CrI, 0.0011 – 0.028 QALYs) and $1,574 in societal costs (95% CrI, $347 – $4,676). Releasing a WNV-infectious donation would result in an estimated average loss of 0.031 QALYs (95% CrI, 0.024 – 0.046 QALYs) and $6,595 in societal costs (95% CrI, $1,241 – $10,239). Using a willingness-to-pay of $1 million per QALY gained, the estimated expected net monetary cost of releasing an infectious donation for transfusion was $9,739 (95% CrI, $1,452 – $32,312) for Zika and $37,992 (95% CrI, $26,495 – $52,499) for WNV.
Each year there were 9.13e2411 possible portfolios tailored by season and 3-digit zip code. Linear separability allowed us to identify the optimal portfolio by evaluating 32 policies for each of the 1780 zip code and season combinations. We further reduced the number of policies evaluated by pre-determining that the optimal policy in donor groups with no Zika or WNV-infectious donations must be no intervention, which was the case for most zip codes during the high mosquito season (76% in 2017, 72% in 2018, and 91% in 2019) and for even more zip codes during the low mosquito season (95% in 2017, 96% in 2018, and 99% in 2019). The number of remaining donor groups for which all policies were evaluated was 257 for 2017, 285 for 2018, and 82 for 2019.
In the base case analysis, WNV testing was optimal in many of the remaining zip codes during the high mosquito season (118 zip codes in 2017; 134 in 2018; 40 in 2019) and was optimal during the low mosquito season in one zip code each year. In most cases WNV MP-NAT was optimal; ID-NAT was optimal in a small number of zip codes that had higher WNV risk during the high mosquito season (1 in 2017; 8 in 2018; 1 in 2019). In probabilistic sensitivity analysis (PSA), all four tests were part of the optimal portfolio in some iterations for some years, and the geographical distribution of areas for which screening was optimal varied considerably from year to year (Figure 4.2; Supplemental Table 9.4). Pathogen inactivation and donor deferral were not part of the optimal portfolio in the base case nor in any PSA iteration.
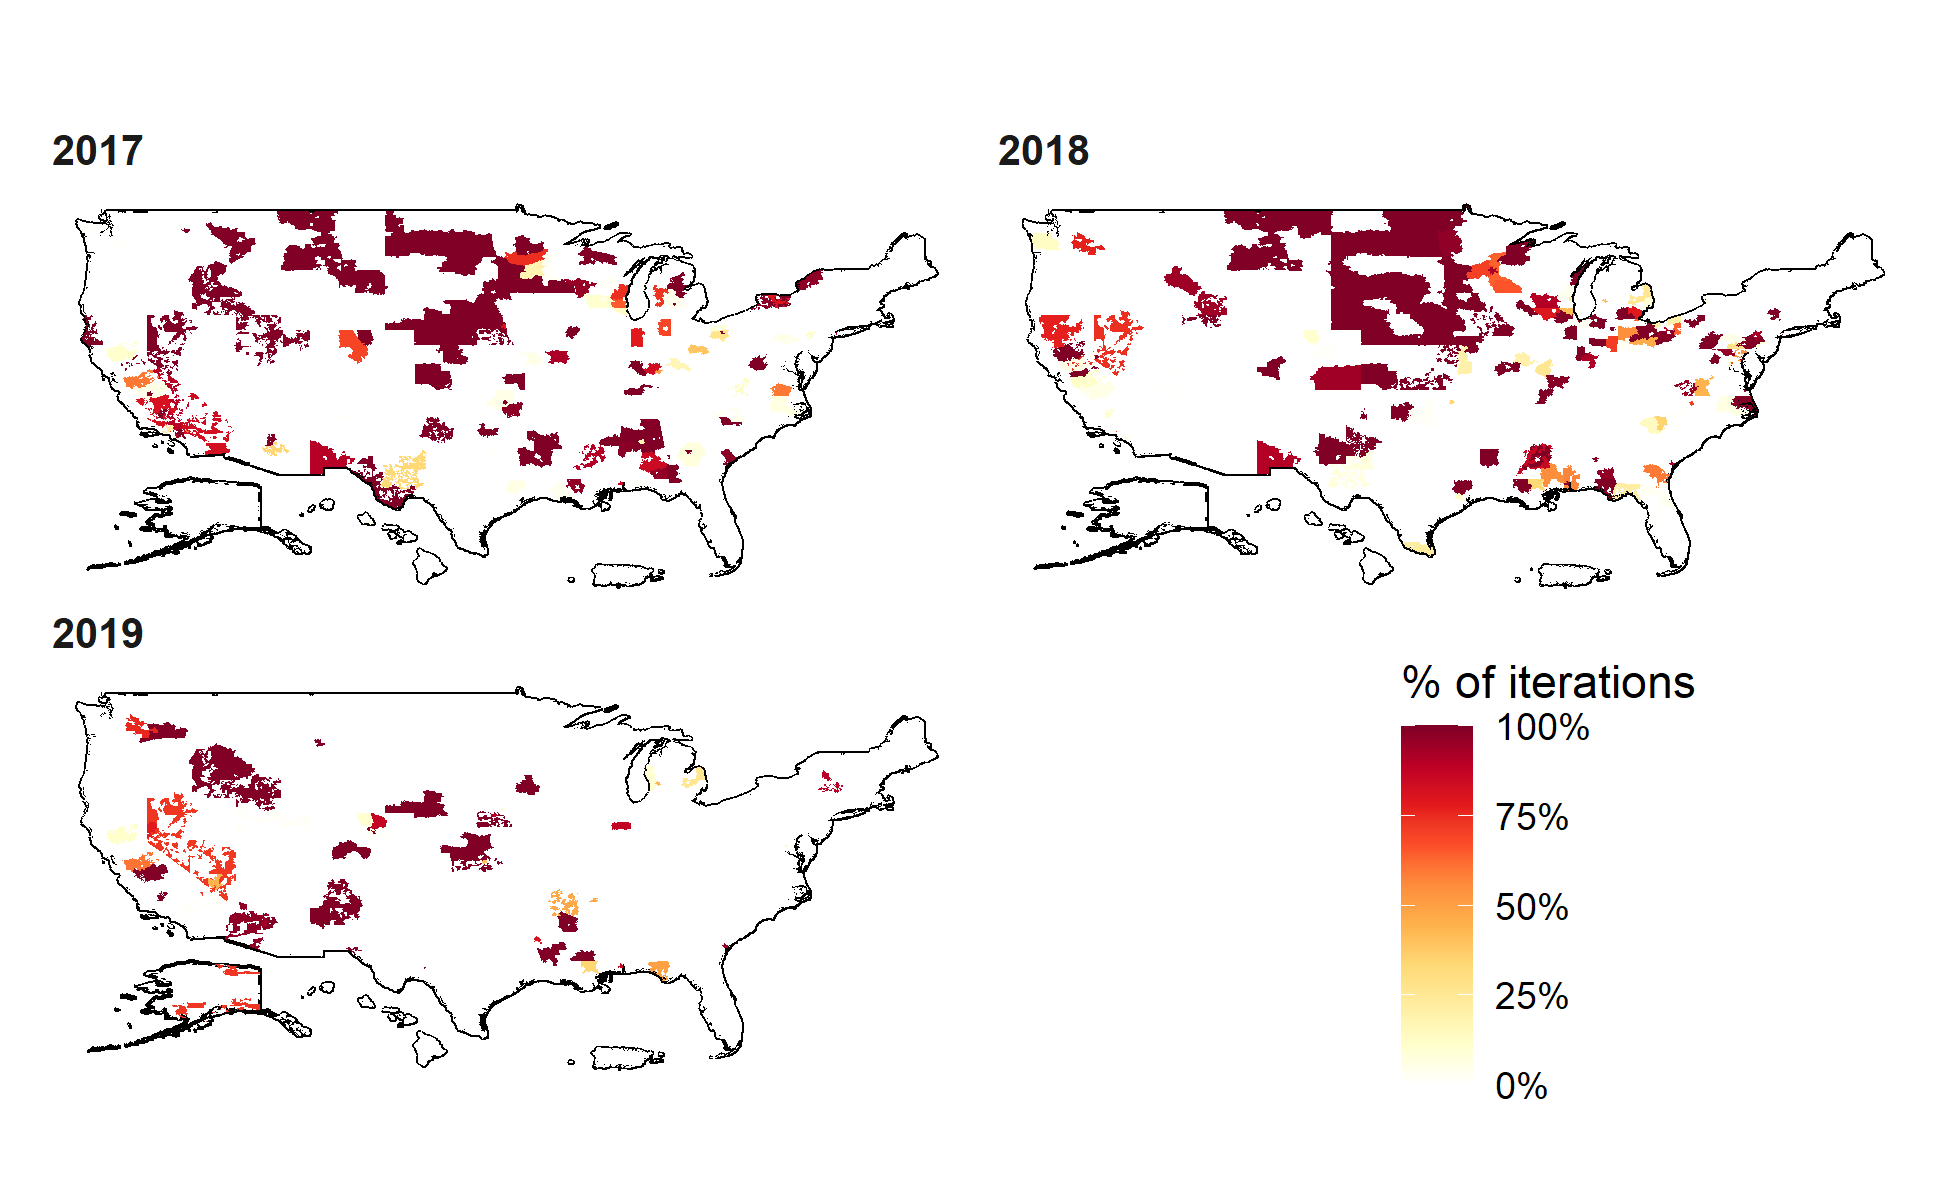
Figure 4.2: Distribution of confirmed positive blood donations by month for West Nile virus and Zika virus in 2017, 2018, and 2019.
High mosquito season was defined as April to September.
Table 4.4 compares the performance of the optimal policy each year to no intervention and universal MP-NAT. The optimal portfolio reduced test costs by more than 95% compared to universal MP-NAT screening each year and prevented fewer infectious donations from being released (0% – 14% each year for Zika; 51% – 83% each year for WNV) than did universal MP-NAT (97% – 99% each year for Zika; 92% – 98% each year for WNV). Sensitivity analysis showed that when using uniform distributions, the expected value of each metric was similar to the original distributions, although the standard deviation around each estimate was slightly larger (Supplemental Figure 9.2). The optimal policy by zip code was also similar between the primary and the uniform distribution scenarios (Supplemental Figure 9.3).
Year | Optimal | No intervention | Universal MP-NAT |
Objective function value1 | |||
2017 | $214M ($134M–$294M) | $219M ($138M–$299M) | $331M ($243M–$419M) |
2018 | $214M ($134M–$294M) | $221M ($141M–$302M) | $331M ($243M–$419M) |
2019 | $210M ($130M–$290M) | $212M ($132M–$292M) | $331M ($243M–$419M) |
Test cost | |||
2017 | $3.53M ($2.39M–$4.44M) | $0M ($0M–$0M) | $124M ($89.50M–$159M) |
2018 | $3.55M ($2.34M–$4.96M) | $0M ($0M–$0M) | $124M ($89.50M–$159M) |
2019 | $1.57M ($1.04M–$2.23M) | $0M ($0M–$0M) | $124M ($89.50M–$159M) |
Net monetary cost of released infectious donations | |||
2017 | $3.88M ($2.72M–$5.10M) | $12.10M ($8.49M–$16.70M) | $0.60M ($0.21M–$1.08M) |
2018 | $4.19M ($2.32M–$5.41M) | $14.90M ($10.40M–$20.60M) | $0.74M ($0.26M–$1.35M) |
2019 | $1.86M ($1.15M–$2.38M) | $5.15M ($3.59M–$7.11M) | $0.26M ($0.09M–$0.47M) |
Zika residual risk | |||
2017 | 1.97e-06 (1.68e-06–1.97e-06) | 1.97e-06 (1.97e-06–1.97e-06) | 3.94e-08 (1.07e-08–6.86e-08) |
2018 | 2.64e-07 (2.64e-07–2.64e-07) | 2.64e-07 (2.64e-07–2.64e-07) | 5.28e-09 (1.43e-09–9.20e-09) |
2019 | 0.00e+00 (0.00e+00–0.00e+00) | 0.00e+00 (0.00e+00–0.00e+00) | 0.00e+00 (0.00e+00–0.00e+00) |
WNV residual risk | |||
2017 | 9.38e-06 (5.94e-06–1.35e-05) | 3.04e-05 (3.04e-05–3.04e-05) | 1.52e-06 (5.69e-07–2.45e-06) |
2018 | 1.06e-05 (5.10e-06–1.54e-05) | 3.79e-05 (3.79e-05–3.79e-05) | 1.89e-06 (7.10e-07–3.06e-06) |
2019 | 4.75e-06 (2.81e-06–7.14e-06) | 1.31e-05 (1.31e-05–1.31e-05) | 6.56e-07 (2.46e-07–1.06e-06) |
Zika-infectious donations released | |||
2017 | 20.35 (17.39–20.35) | 20.35 (20.35–20.35) | 0.41 (0.11–0.71) |
2018 | 2.73 (2.73–2.73) | 2.73 (2.73–2.73) | 0.05 (0.01–0.10) |
2019 | 0.00 (0.00–0.00) | 0.00 (0.00–0.00) | 0.00 (0.00–0.00) |
WNV-infectious donations released | |||
2017 | 96.84 (61.35–139.69) | 313.73 (313.73–313.73) | 15.68 (5.87–25.33) |
2018 | 109.69 (52.71–158.83) | 391.67 (391.67–391.67) | 19.56 (7.33–31.61) |
2019 | 49.03 (29.02–73.78) | 135.50 (135.50–135.50) | 6.77 (2.54–10.94) |
1Base case values reported with 95% credible interval from probabilistic sensitivity analysis. Abbreviations: MP-NAT, minipooled nucleic acid testing; WNV, West Nile virus. | |||
The optimal policy for each donor group was a function of Zika and WNV prevalence (Figure 4.3). When prevalence for both diseases was low, using no intervention was optimal, and when prevalence became sufficiently high, it became optimal to defer donors. Various testing combinations were optimal for intermediate prevalence levels, and the optimal policy was to switch to more expensive, more sensitive tests as prevalence increased. As Figure 3 shows, increasing the willingness-to-pay threshold makes it optimal to apply more aggressive interventions at lower prevalence levels.
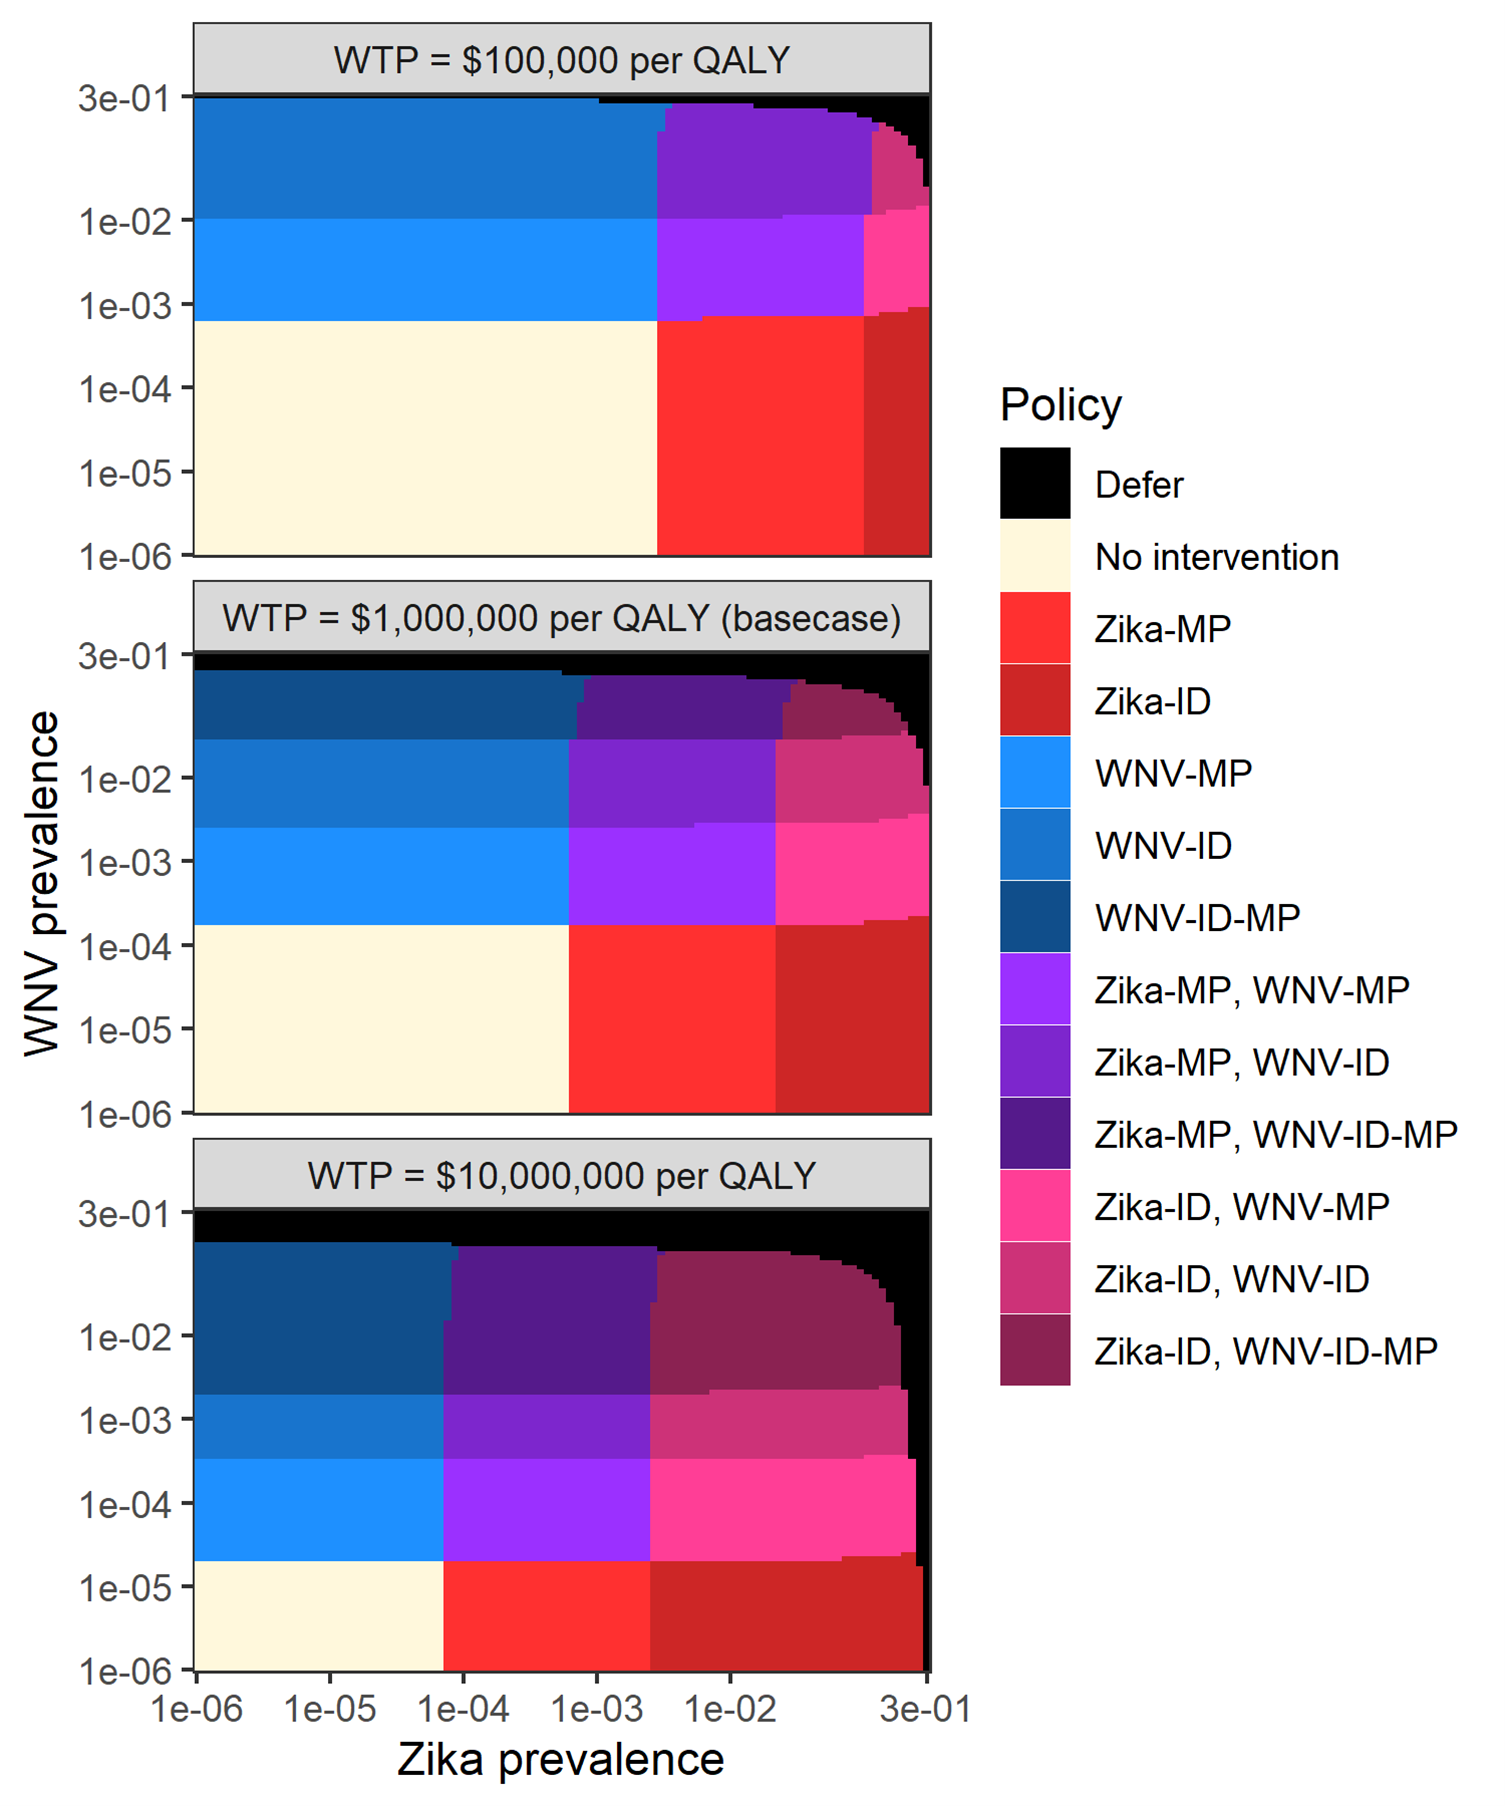
Figure 4.3: Optimal policy as a function of West Nile virus and Zika prevalence for various willingness-to-pay levels.
The optimal policy for an individual donor group was identified for all 10,000 combinations of 100 Zika and 100 WNV prevalence values, evenly spaced on a logarithmic scale from 1e-6 to 0.3. In the three scenarios, net monetary cost of releasing a Zika- or WNV-infectious donation was re-calculated with a different willingness to pay per QALY gained.
Figure 4.4 shows six per-donation performance measures for the optimal policy as a function of Zika and WNV prevalence. This figure shows how residual risk for Zika and WNV gradually increases with prevalence, although discontinuities in these metrics exist at the boundaries where the optimal testing policy changes. The downstream net monetary cost exhibits similar discontinuities because it is a function of the residual risk for each disease. The overall objective function value can range from the donation processing cost ($20) when TTI prevalence is 0 to the donor deferral replacement cost ($90) at sufficiently high TTI prevalence. By definition, the objective function value of two policies is equal at the boundary between the policy regions for which they are optimal. Therefore, the objective function value plot does not exhibit discontinuities at the boundaries where the optimal policy changes as with the other performance metrics.
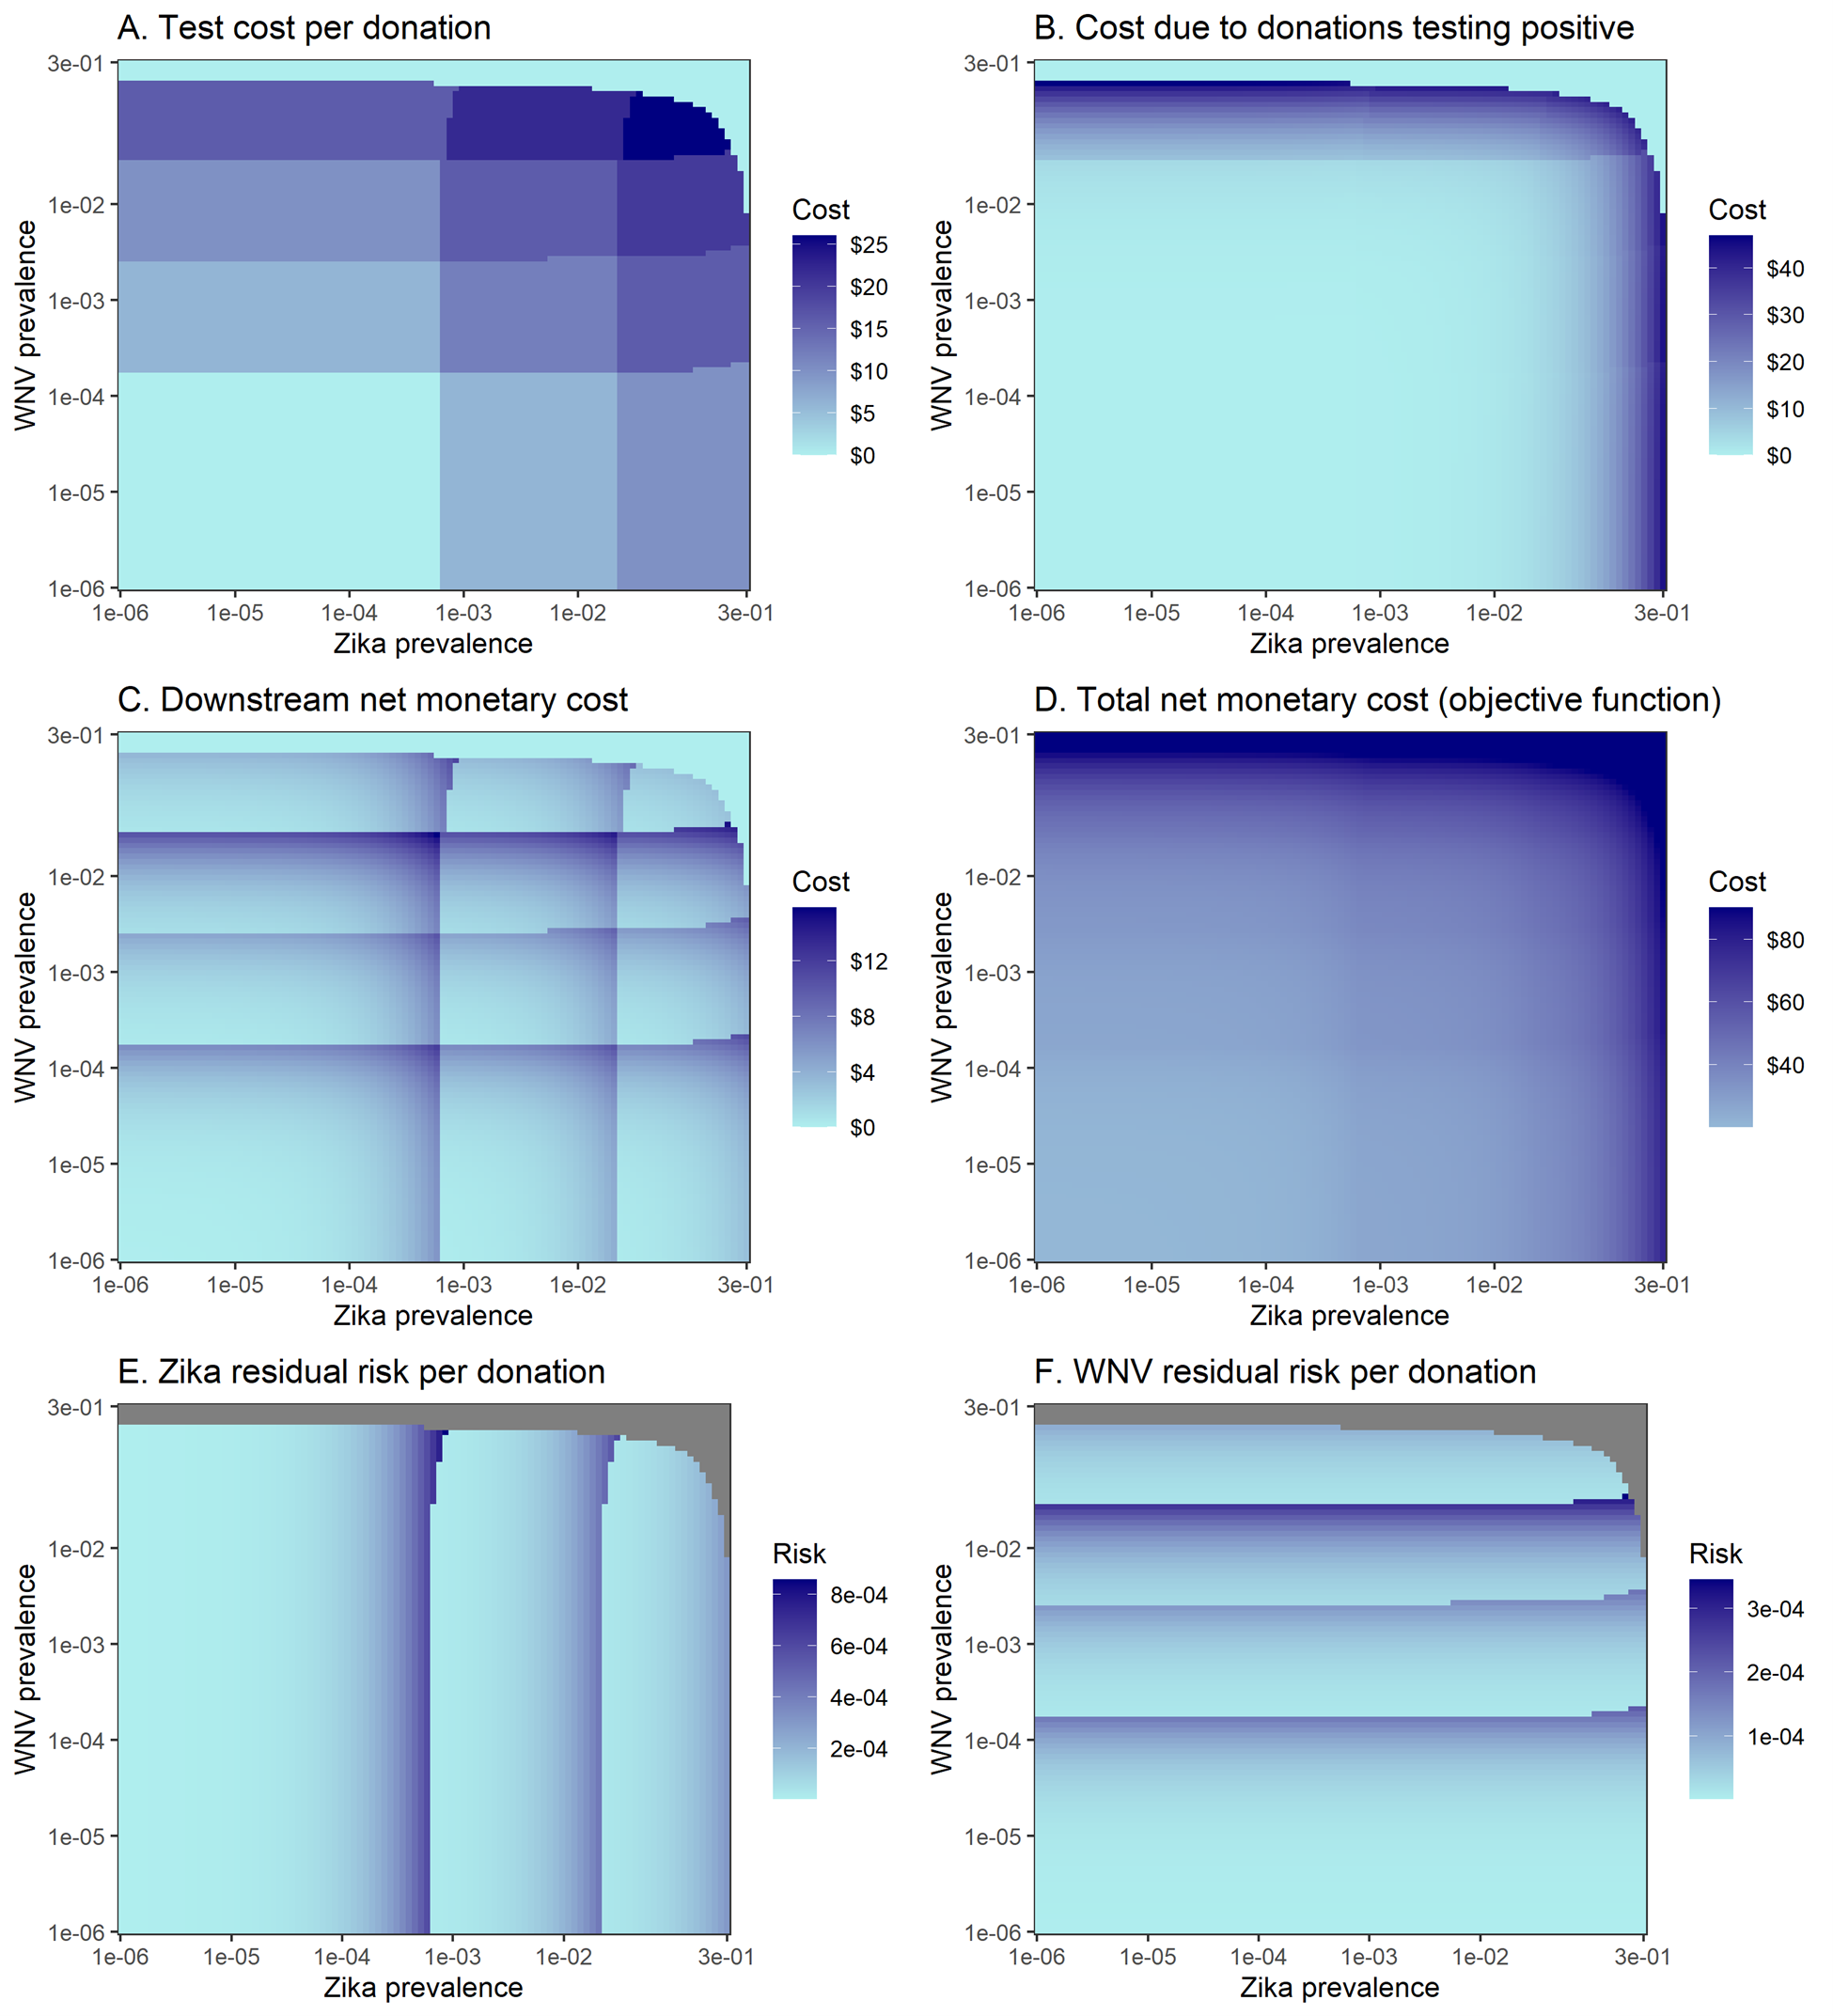
Figure 4.4: Per-donation performance metrics for the optimal portfolio as a function of Zika and West Nile virus prevalence.
Grey indicates that the performance measure is undefined for those sets of Zika and WNV prevalence.
The linear approximation excludes costs associated with removing donations that test positive, shown in Figure 4.4B. At lower prevalence levels, these costs were close to zero and the linear approximation yielded the same solution as the full cost function (Figure 4.5). As the prevalence of Zika and WNV approached levels that triggered donor deferral in the full model solution, these costs grew. As a result, the linear approximation solution differed from the solution to the full cost function at high prevalence levels because it was not optimal to switch to a donor deferral policy. However, the differences between the full and approximate solutions were negligible for the prevalence levels seen in our zip code- and season-based donor groups; the approximate and full cost functions led to the same optimal policy for every donor group across all years 2017-2019 (Figure 4.5). This suggests that the linear approximation may yield optimal or near-optimal solutions in many applications of the framework.
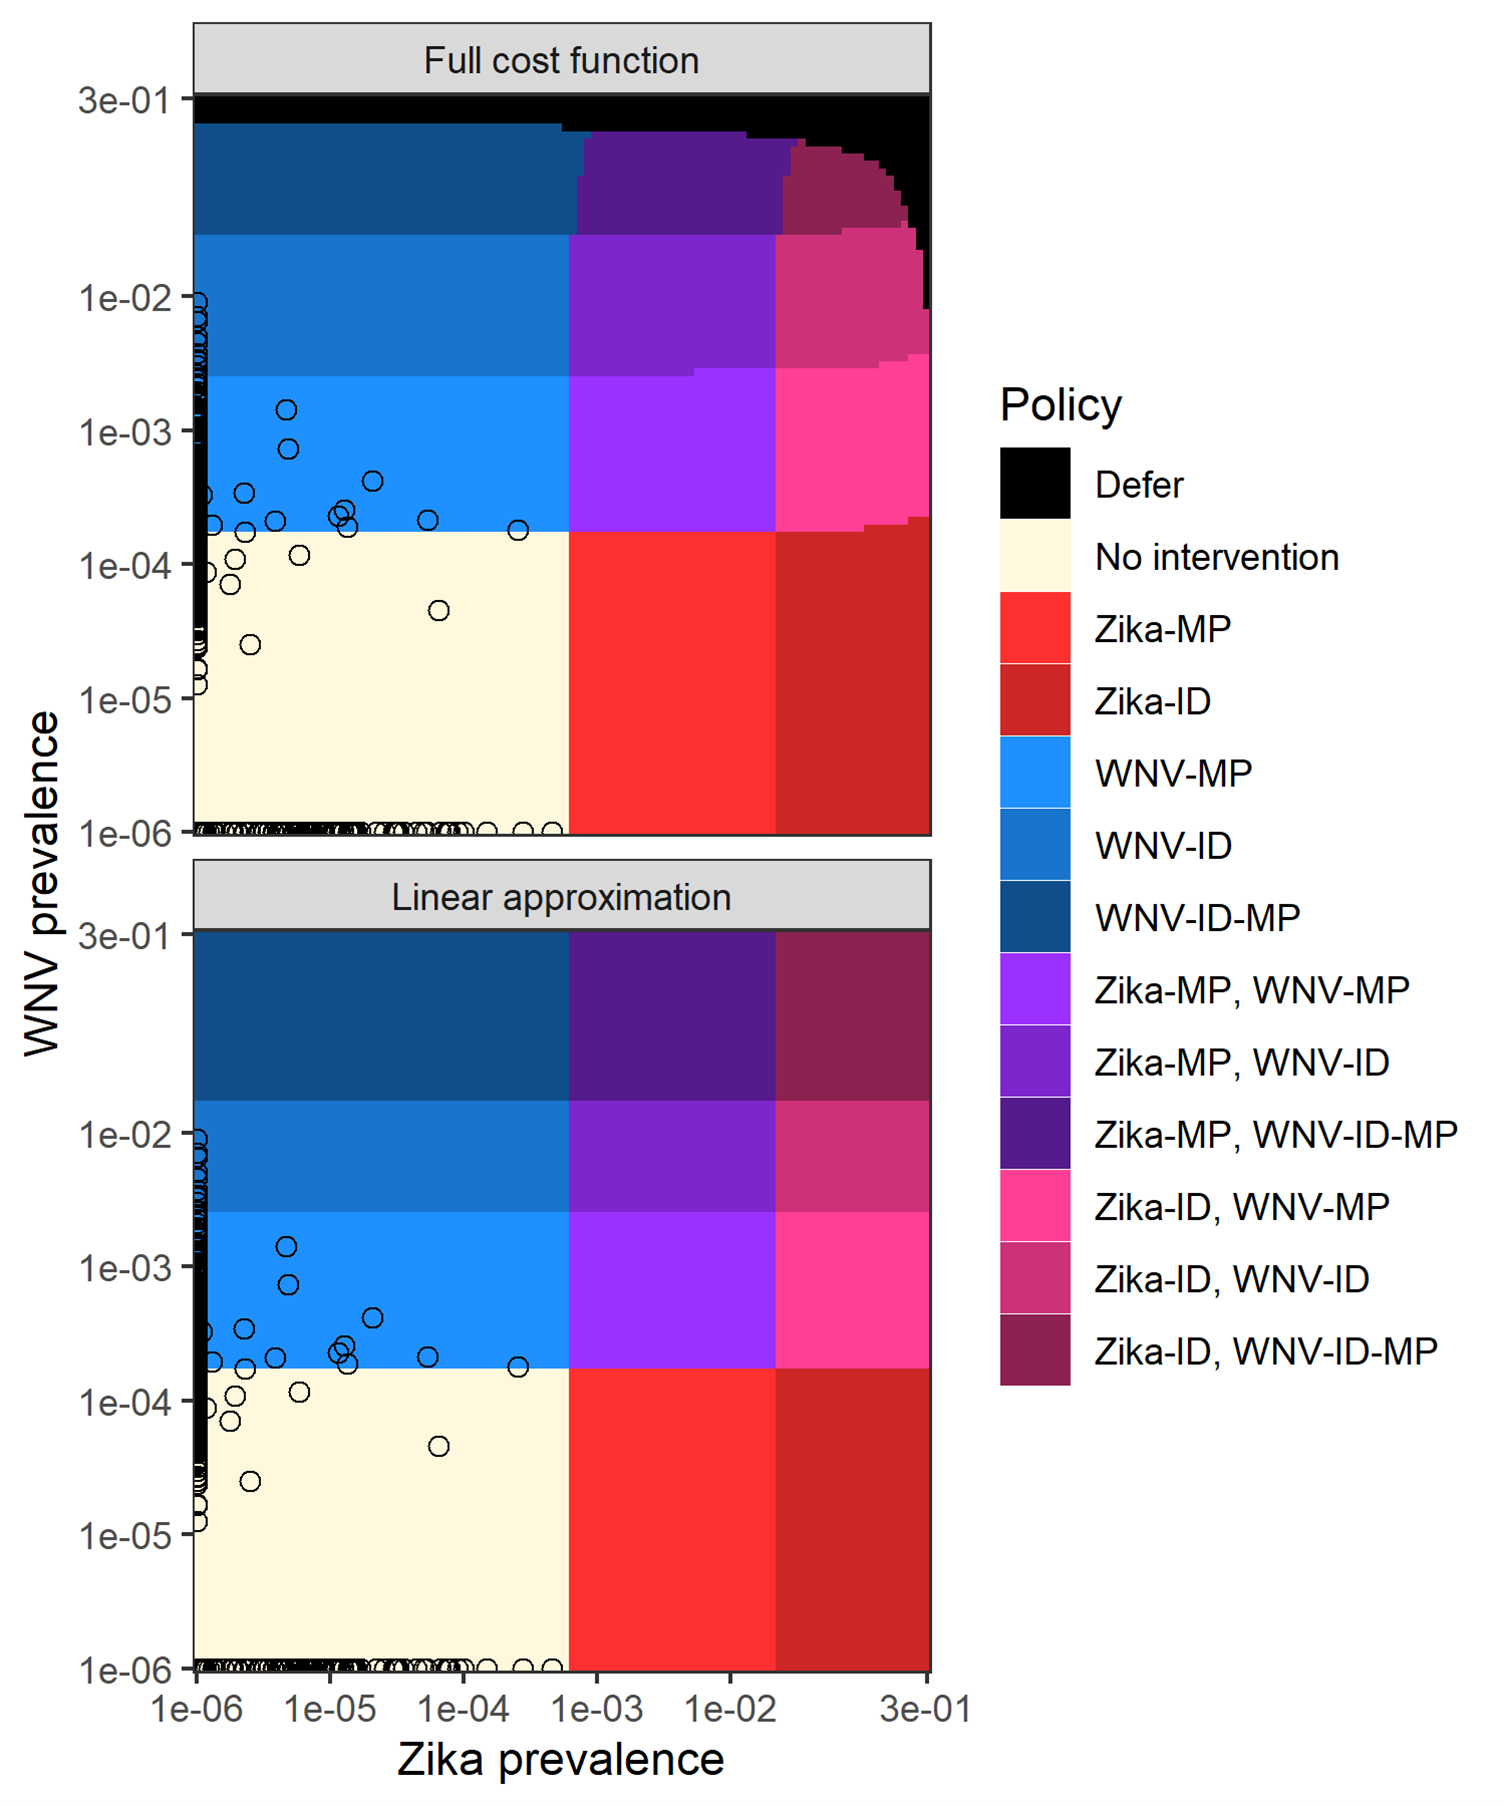
Figure 4.5: Optimal policy by prevalence with exact and approximate cost functions.
The approximate cost function ignores the impact of removing and replacing donations testing positive on the objective function (e.g., sets v_2=1) but maintains the risk-reduction from testing. Each 3-digit zip code is plotted according to WNV and Zika prevalence as point. Prevalences of 0 were rounded up to 1e-6 so they could be plotted on a logarithmic scale. For all 3-digit zip codes, the optimal policy was the same whether the full cost function or linear approximation was used.
In the base case of the state-level analysis, the only intervention that was part of the optimal portfolio was WNV MP-NAT, which was optimal during the high mosquito season in five states in 2017 (ND, SD, NE, NV, and MS) and in five states in 2018 (ND, SD, NE, MT, and IA). In 2019 it was optimal to use no intervention. In PSA, Zika testing was optimal for some iterations in Puerto Rico in 2017 (with MP-NAT preferred in 19.6% of iterations and ID-NAT preferred in 0.94%). For many states, WNV MP- or ID-NAT was optimal in some PSA iterations during the high mosquito season (Supplemental Figure 9.4; Table 9.5). Compared to the optimal zip code-level solution, the state-level solution had a lower test cost but reduced a much smaller proportion of the cost of releasing infectious donations compared to no testing (0% – 50% for state-level donor groups, compared to 51% – 83% for zip code-level donor groups; Supplemental Table 9.6). This is because grouping donors at the state level allows for less distinction in risk – and thus less distinction in the corresponding policy – than grouping donors at the zip code level.