3.3 Results
The estimated number of adverse events in a year without PI was 24,705 (21,115 – 37,904). PI reduced the number of adverse events by 19,502 (13,187 – 27,477) to 5,204 (5,179 – 14,375) per year. Most of the averted adverse events were sepsis (51%) and malaria (32%) infections (Table 3.2).
The estimated net present cost per adverse event ranged from $2.70 ($1.36 – $4.77) for syphilis to $1,617.45 ($1,149.76 – $2,269.04) for HBV. Because most HIV, HCV and HBV infections would be subclinical for the first year, over 90% of healthcare spending associated with these three adverse events is estimated to occur in later years (Supplemental Table 8.4). The total net present healthcare costs due to adverse events was $9,910,064 ($6,362,546 – $14,811,006) without PI and $815,046 ($705,824 – $1,716,051) with PI. Of the adverse events evaluated, sepsis infection had only the fourth highest per-case cost at $694.80 ($546.07 – $882.25) but represented the majority of healthcare spending due to adverse events without PI (73%) and the majority of net present healthcare savings due to PI (76%).
Outcome | Sepsis | Malaria | FNHTR | Syphilis | HBV | HCV | HIV |
Cases without PI | 10,419 | 7,414 | 5,079 | 58 | 693 | 866 | 176 |
Cases with PI | 417 | 1,225 | 3,386 | 3 | 69 | 87 | 18 |
Cases reduced by PI | 10,002 | 6,189 | 1,693 | 56 | 624 | 779 | 159 |
Net present cost per case | $694.80 | $28.50 | $85 | $2.70 | $1,617.45 | $847.27 | $981.46 |
Total net present cost without PI | $7,239,243 | $211,289 | $431,700 | $157.88 | $1,121,080 | $733,388 | $173,206 |
Total net present cost with PI | $289,570 | $34,900.70 | $287,800 | $7.89 | $112,108 | $73,338.81 | $17,320.64 |
Total net present cost reduced by PI | $6,949,673 | $176,388 | $143,900 | $149.99 | $1,008,972 | $660,049 | $155,886 |
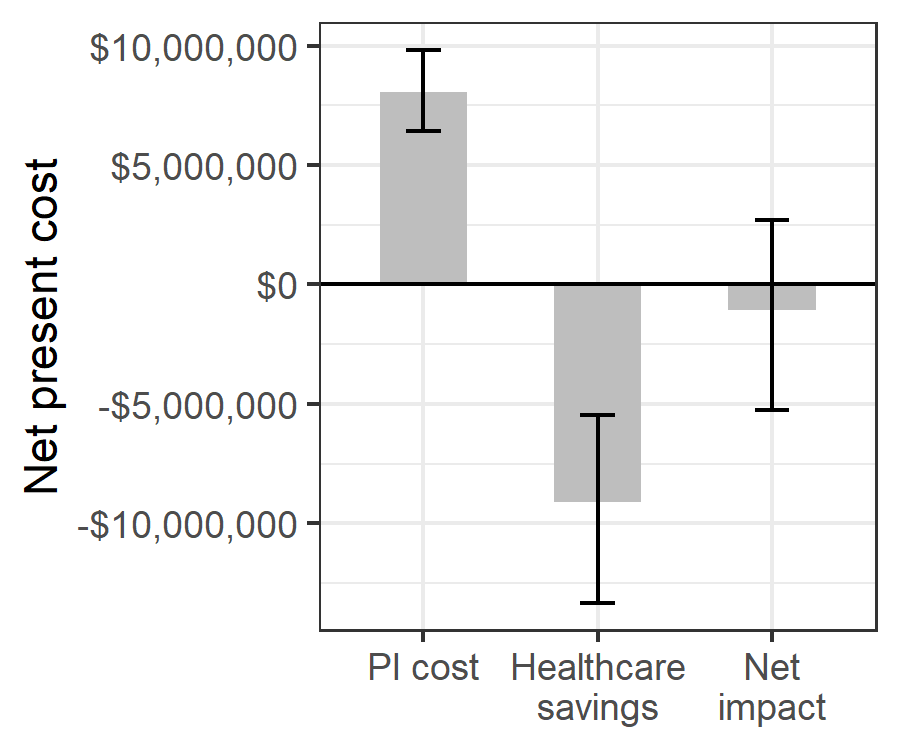
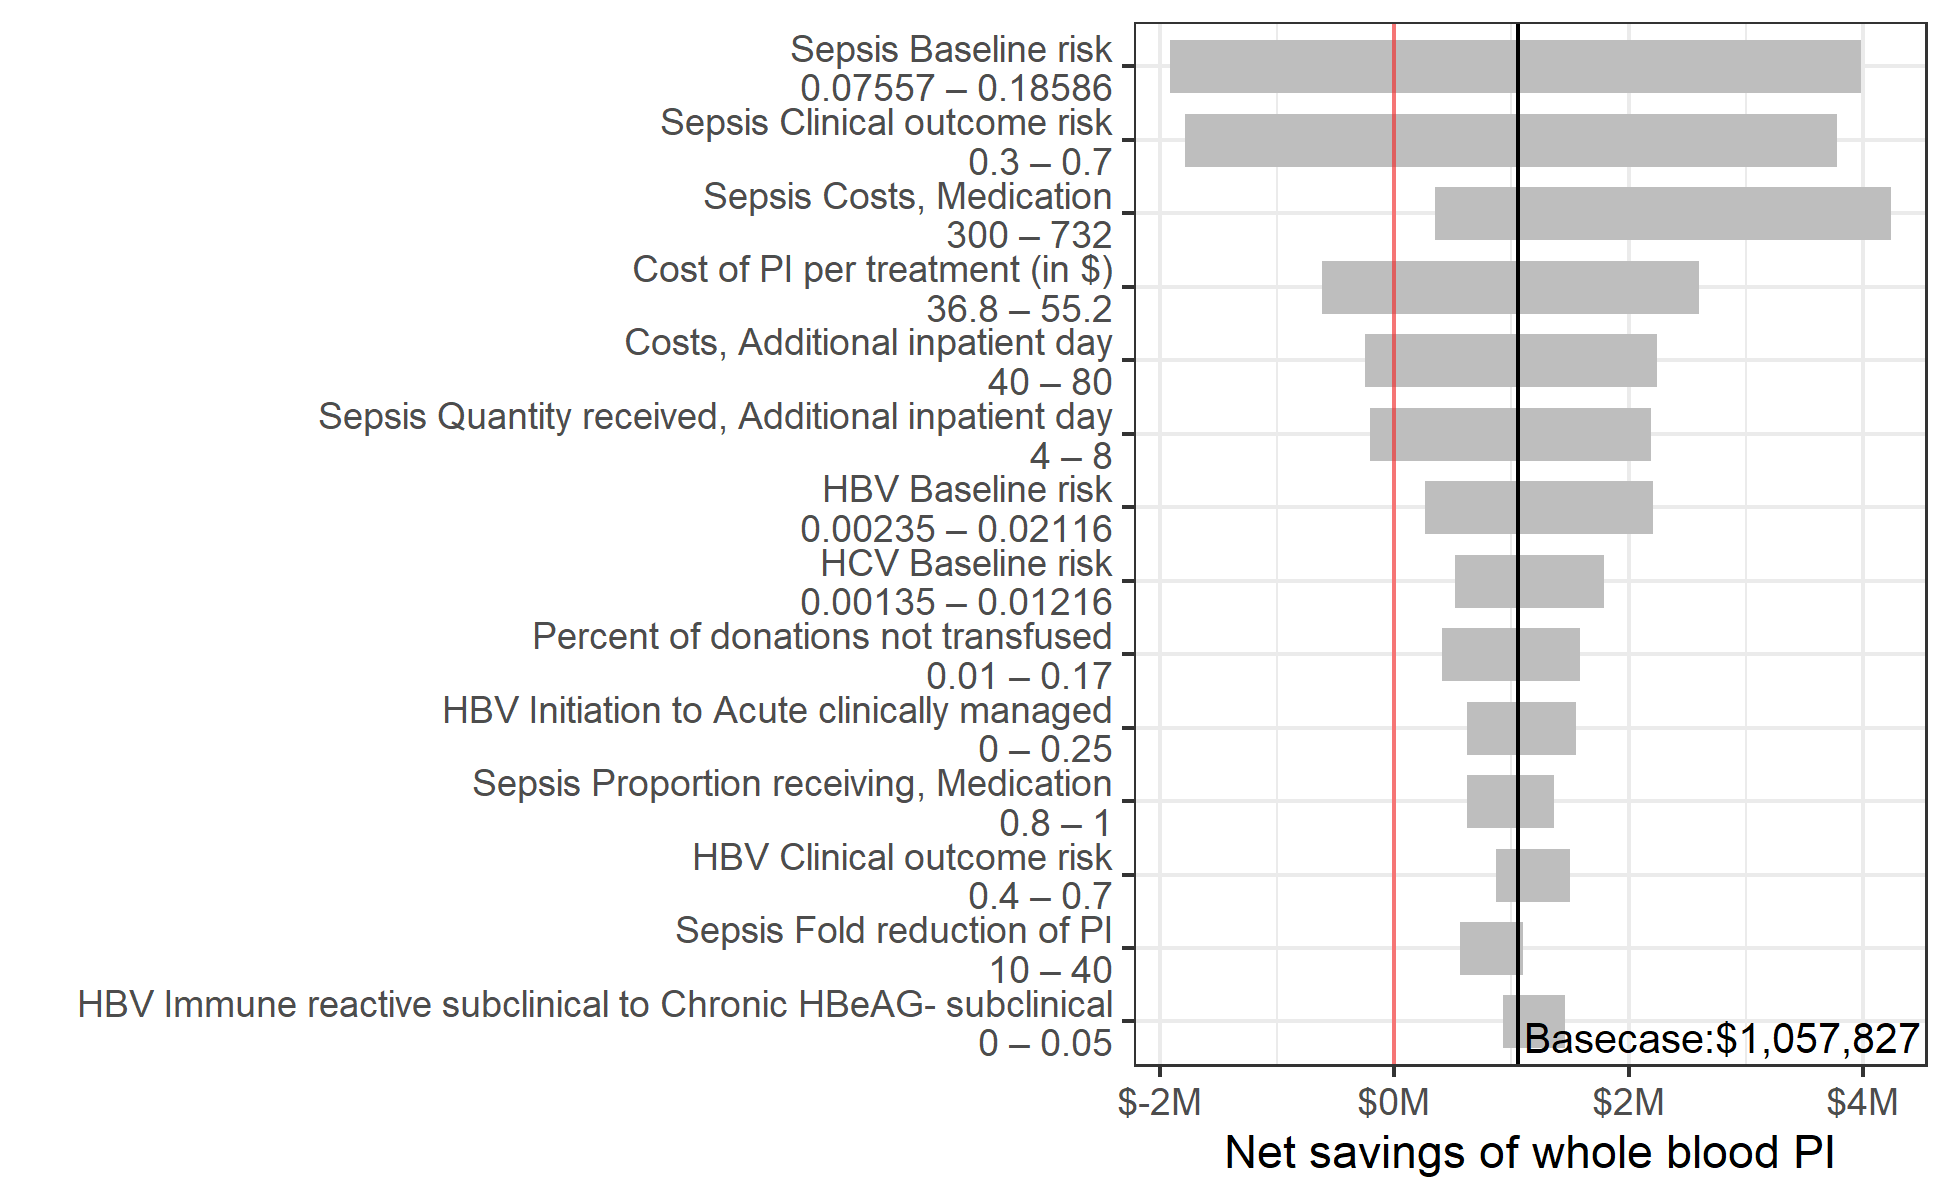
One year of whole blood PI in Ghana would cost an estimated $8,037,191 ($6,412,577 – $9,817,360) and reduce net present healthcare spending by $9,095,019 ($5,462,082 – $13,343,887) due to averted adverse events, resulting in an annual net savings of $1,057,827 (-$2,683,860 – $5,260,235) (Figure 3.2). Whole blood PI led to an overall reduction in net present healthcare spending in 63% of probabilistic sensitivity analysis iterations. For 14 uncertain input parameters, varying the parameter along its uncertainty ranges led to a variation in the annual net savings of PI of $500,000 or more. For 5 parameters, pathogen inactivation was no longer cost-saving at an extreme value of our uncertainty range. One year of PI had a positive net present cost at the minimum value of our uncertainty range for the baseline risk of sepsis (net present cost of $1,915,019), the risk of clinical outcome for sepsis ($1,785,113), the cost per inpatient day ($248,675), and the number of additional inpatient days needed per cinical sepsis infection ($205,533). PI also had a positive net present cost of $612,682 at the maximum value of our uncertainty range for the per-donation cost of PI (Figure 3.3).

Figure 3.2: Estimated net impact on healthcare spending of whole blood pathogen inactivation.
Net impact is the cost of pathogen inactivation minus the net present healthcare savings from avert transfusion-related adverse events.

Figure 3.3: Sensitivity of the net savings of pathogen inactivation to changes in the value of individual input parameters within prespecified uncertainty ranges.
Y-axis shows all model parameters for which varying the value along the indicated range while keeping other parameters at their base case value led to a variation of more than $500,000 in the estimated net savings of whole blood pathogen inactivation.
In a scenario analysis where we accounted for one secondary infection for all HBV, HCV, and HIV-infected recipients, the net present health savings from PI increased from $9,095,019 to $10,919,926 ($6,810,970 – $15,632,667) annually. In this scenario, the net impact of PI was an overall reduction in healthcare spending in 89% of probabilistic sensitivity analysis iterations.