Chapter 6 Seurat Individual Batch Effect Exploration
library(Seurat)
library(tidyverse)
library(magrittr)
library(data.table)
6.1 Descripiton
Explore the individual batch effect by
Dimplot split by individual
Fractions of individuals per cluster
6.2 Load seurat object
combined <- get(load('data/Demo_CombinedSeurat_SCT_Preprocess.RData'))6.3 Explore individual distribution by Dimplot
Idents(object = combined) <- 'Individual'
DimPlot(object = combined, reduction = "umap", label = T) 
DimPlot(object = combined, reduction = "tsne", label = T) 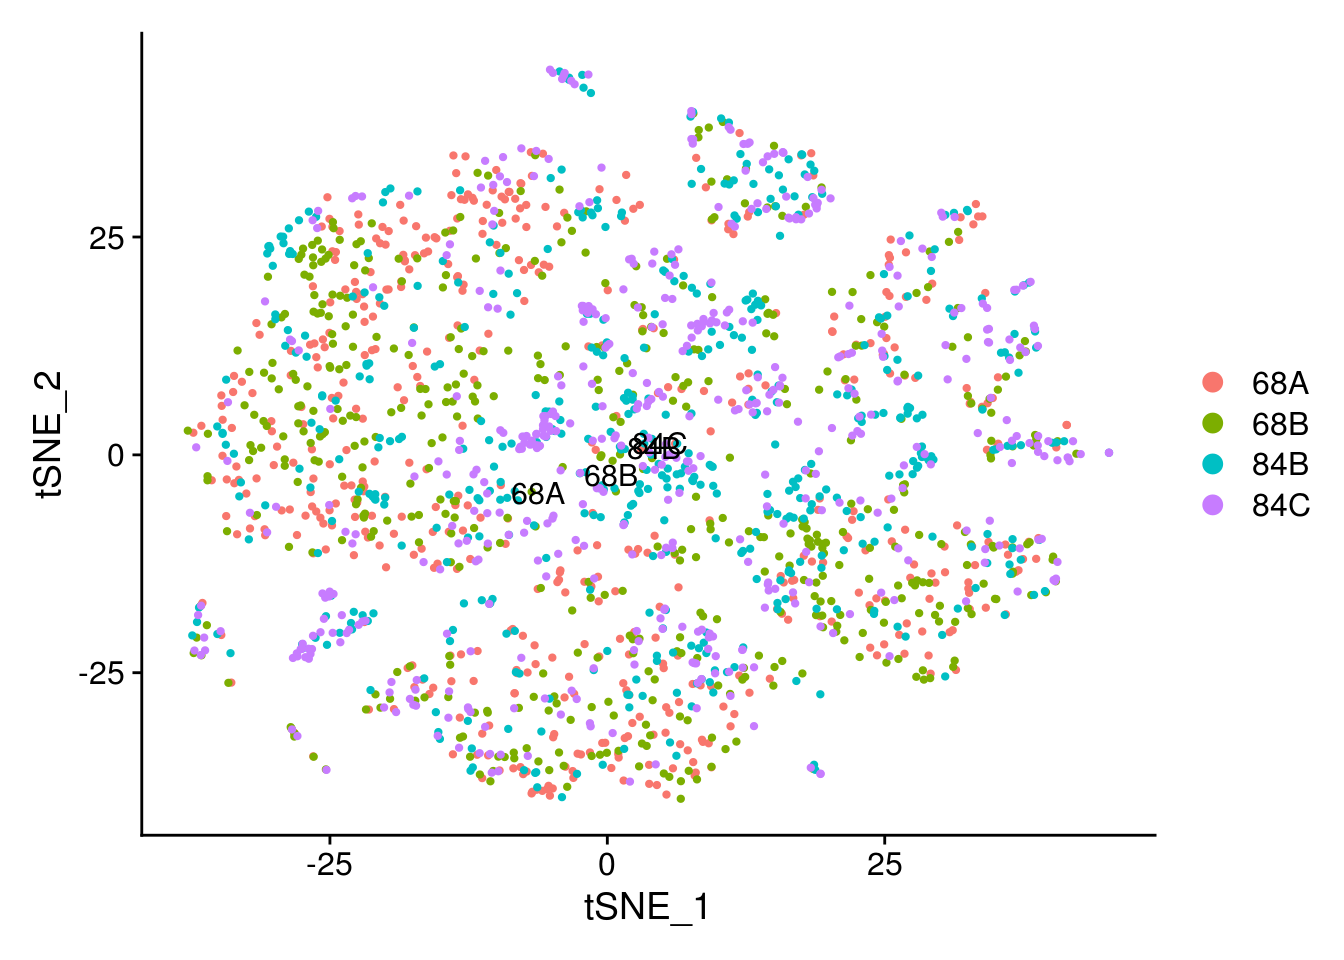
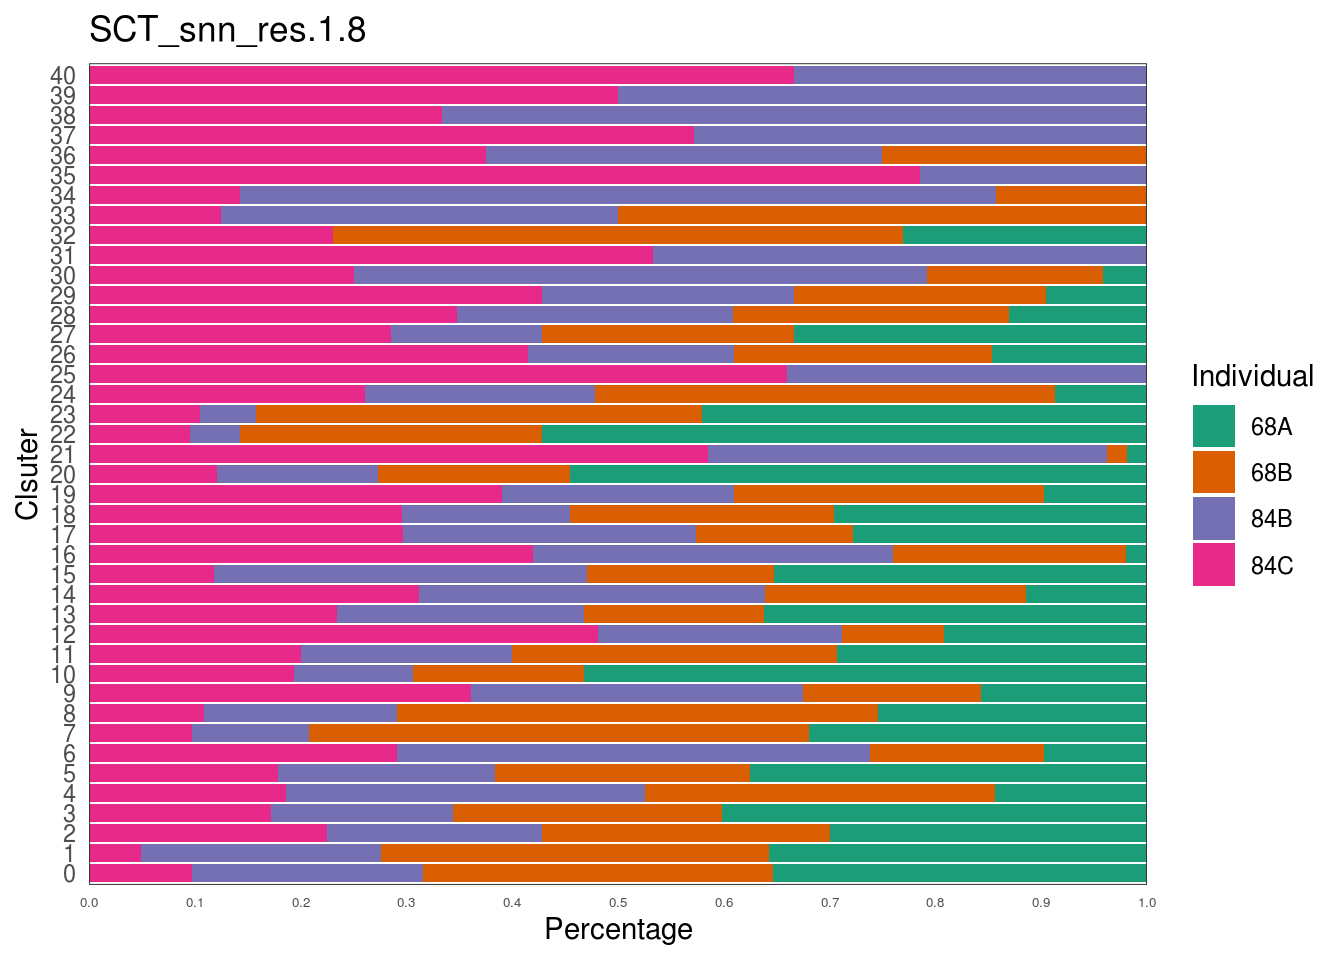
6.4 Calculate individual distribution per cluster with different resolution
df <- data.table(combined@meta.data)
sel.meta <- c("Individual", str_c('SCT_snn_res.', c(1, 1.5, 1.8)))
df <- df[, sel.meta, with = FALSE]


df[, 2:4] %>% imap(~ {
    freq1 <- df[, .N, keyby = .(.x, Individual)]
    freq1[, total := sum(N), by = .(.x)]
    freq1[, ratio := N / total]

    linesize = .35
    fontsize = 8

    ggplot(freq1, aes(fill = Individual, y = ratio, x = .x)) +
      geom_bar(position = "stack", stat = "identity") +
      scale_fill_brewer(palette = "Dark2") +
      xlab('Clsuter') +
      ggtitle(.y) +
      scale_y_continuous(breaks = seq(0, 1, 0.1),
                         expand = c(0, 0),
                         name = 'Percentage') +
      theme_bw() +
      theme(
        panel.grid.major.x = element_blank(),
        panel.grid.major.y = element_blank(),
        panel.grid.minor = element_blank(),
        strip.background = element_blank(),
        panel.border = element_rect(size = linesize),
        axis.ticks = element_blank(),
        axis.text.x = element_text(size = 5)
      ) +
      coord_flip()
})
## $SCT_snn_res.1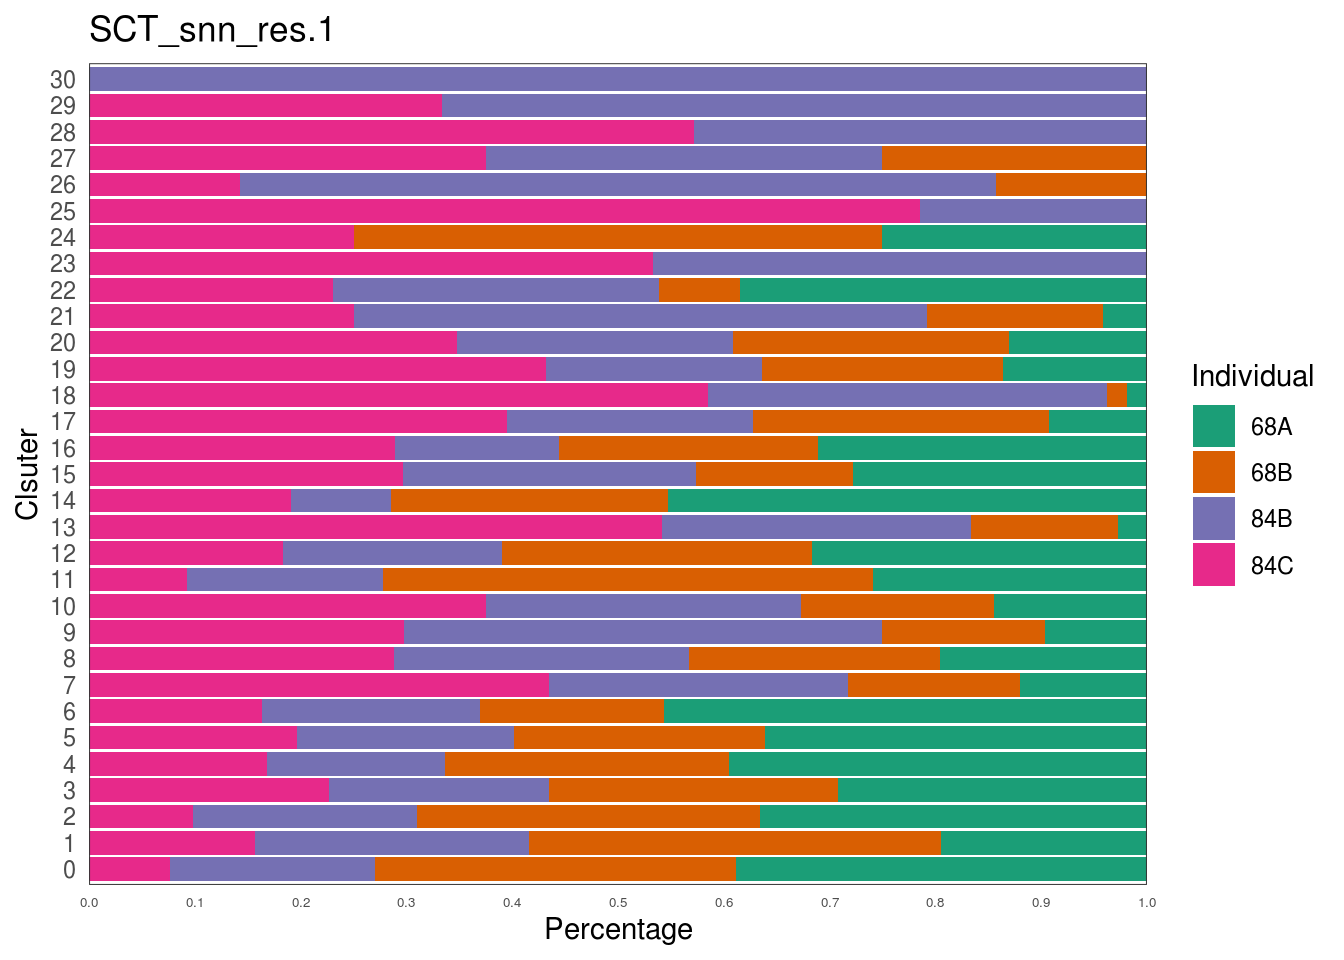
##
## $SCT_snn_res.1.5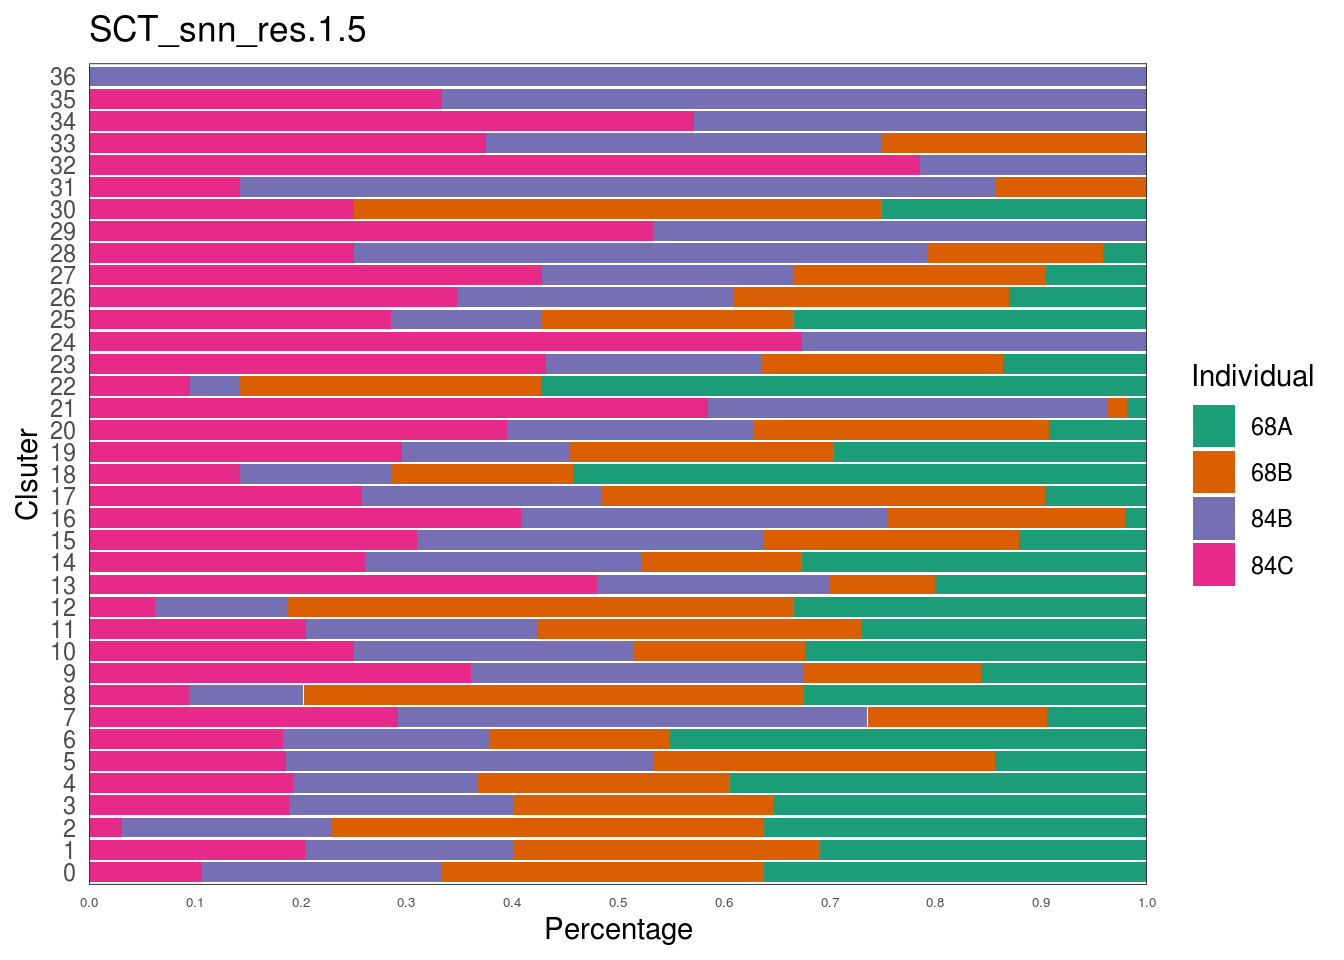
##
## $SCT_snn_res.1.8