Chapter 23 Check Batch Effect Introduced by Individuals
library(ArchR)
library(tidyverse)
library(magrittr)
set.seed(1)
23.1 Description
- Check whether exist significant batch effect introduced by individuals
- Correct batch effect by Harmony
- Explore for both rounds of clustering. If exits batch effect, correct both rounds
23.2 Set env and load arrow project
## Section: set default para
##################################################
addArchRThreads(threads = 16) # setting default number of parallel threads


## Section: load object
##################################################
proj <- loadArchRProject(path = "data/ArchR/ArrowProject/Merged/")
23.3 UMAP to check the batch effect for the second round clustering
name.ls <- c("Sample", "Cluster_peak_res.0.4")

p.ls <- name.ls %>% map(~ {
  plotEmbedding(
    ArchRProj = proj,
    colorBy = "cellColData",
    name = .x,
    embedding = "UMAP_peak"
  )
})
## ArchR logging to : ArchRLogs/ArchR-plotEmbedding-24d33ff28ebc-Date-2021-11-12_Time-14-58-25.log
## If there is an issue, please report to github with logFile!## Getting UMAP Embedding## ColorBy = cellColData## Plotting Embedding## 1
## ArchR logging successful to : ArchRLogs/ArchR-plotEmbedding-24d33ff28ebc-Date-2021-11-12_Time-14-58-25.log
## ArchR logging to : ArchRLogs/ArchR-plotEmbedding-24d326f4ef8f-Date-2021-11-12_Time-14-58-28.log
## If there is an issue, please report to github with logFile!
## Getting UMAP Embedding
## ColorBy = cellColData
## Plotting Embedding
## 1
## ArchR logging successful to : ArchRLogs/ArchR-plotEmbedding-24d326f4ef8f-Date-2021-11-12_Time-14-58-28.logggAlignPlots(p.ls[[1]], p.ls[[2]], type = "h")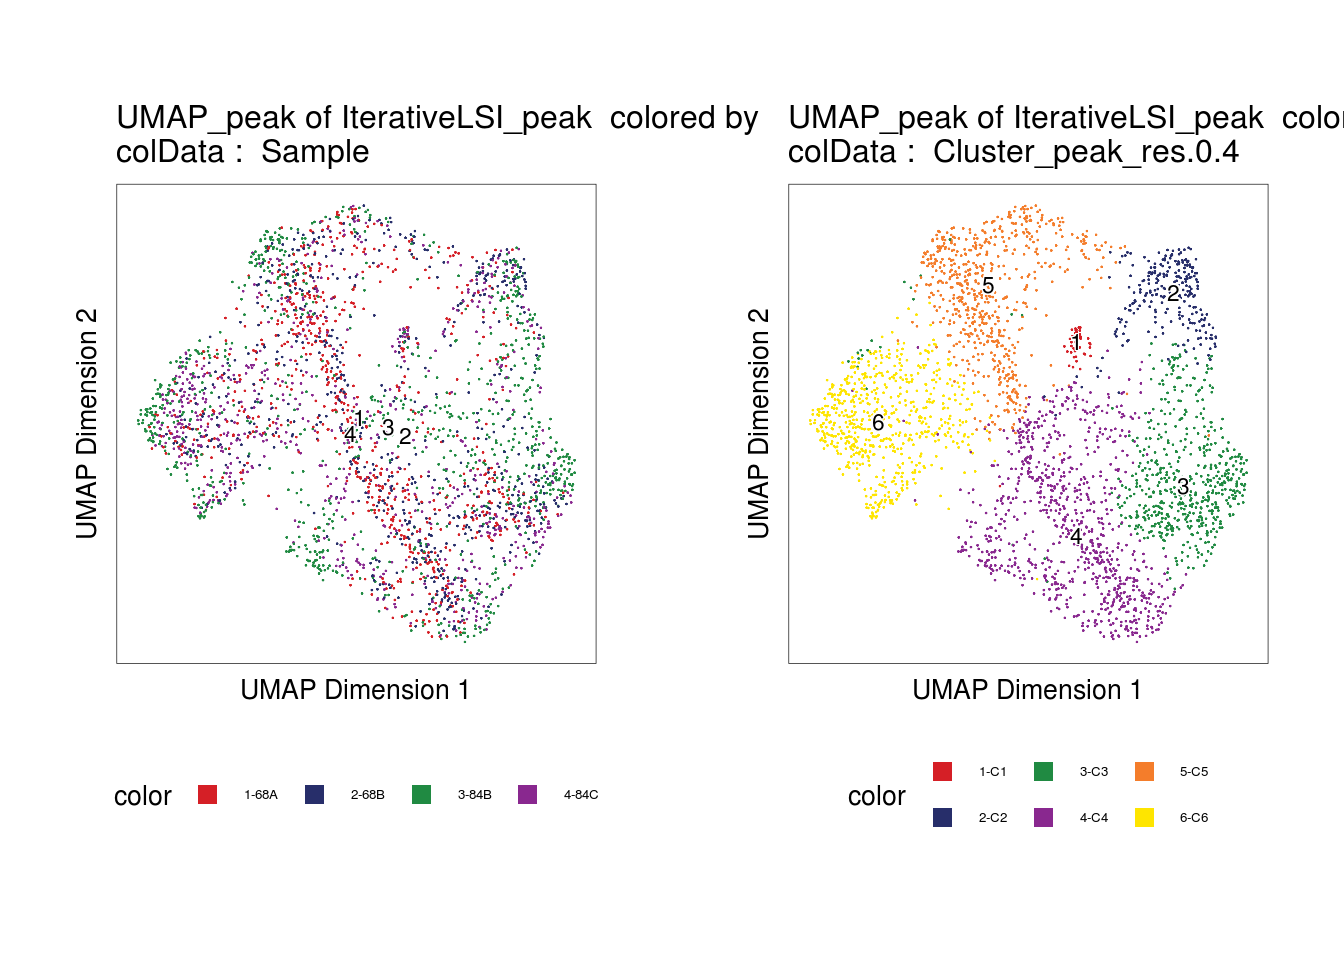
23.4 Calculate the individual percentages per cluster
df <- as.data.table(proj@cellColData)
sel.meta <- c("Sample", str_c('Cluster_peak_res.', c(0.4, 0.6, 0.8)))


df <- df[, sel.meta, with = FALSE]


p.ls <- df[, 2:4] %>% imap(~ {
  freq1 <- df[, .N, keyby = .(.x, Sample)]
  freq1[, total := sum(N), by = .(.x)]
  freq1[, ratio := N / total]

  linesize = .35
  fontsize = 8

  ggplot(freq1, aes(fill = Sample, y = ratio, x = .x)) +
    geom_bar(position = "stack", stat = "identity") +
    scale_fill_brewer(palette = "Dark2") +
    xlab('Clsuter') +
    ggtitle(.y) +
    scale_y_continuous(breaks = seq(0, 1, 0.1),
                       expand = c(0, 0),
                       name = 'Percentage') +
    theme_bw() +
    theme(
      panel.grid.major.x = element_blank(),
      panel.grid.major.y = element_blank(),
      panel.grid.minor = element_blank(),
      strip.background = element_blank(),
      panel.border = element_rect(size = linesize),
      axis.ticks = element_blank(),
      axis.text.x = element_text(size = 5)
    ) +
    coord_flip()
})

ggAlignPlots(p.ls[[1]], p.ls[[2]], p.ls[[3]], type = "v")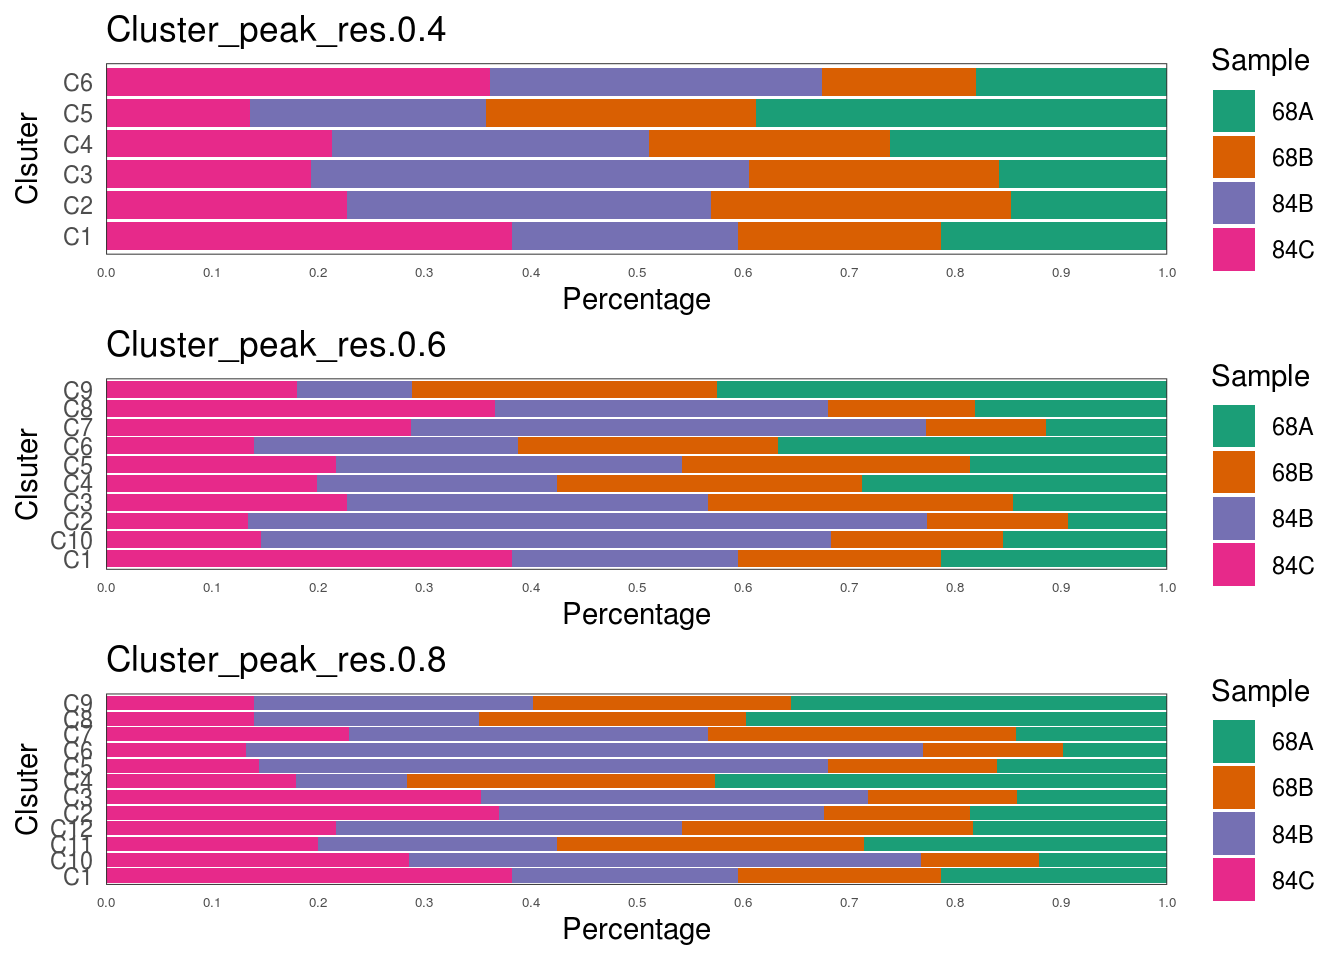
23.5 Correct batch effect using harmony
If exits significant batch effect
# if correct the tile matrix
proj <- addHarmony(
  ArchRProj = proj,
  reducedDims = "IterativeLSI_tile",
  name = "Harmony_tile",
  groupBy = "Sample"
)

# if correct the peak matrix
proj <- addHarmony(
  ArchRProj = proj,
  reducedDims = "IterativeLSI_peak",
  name = "Harmony_peak",
  groupBy = "Sample"
)

# adjust the following clustering and embedding
proj <- addUMAP(
  ArchRProj = proj,
  reducedDims = "Harmony_tile",
  name = "UMAPHarmony_tile",
  nNeighbors = 30
)