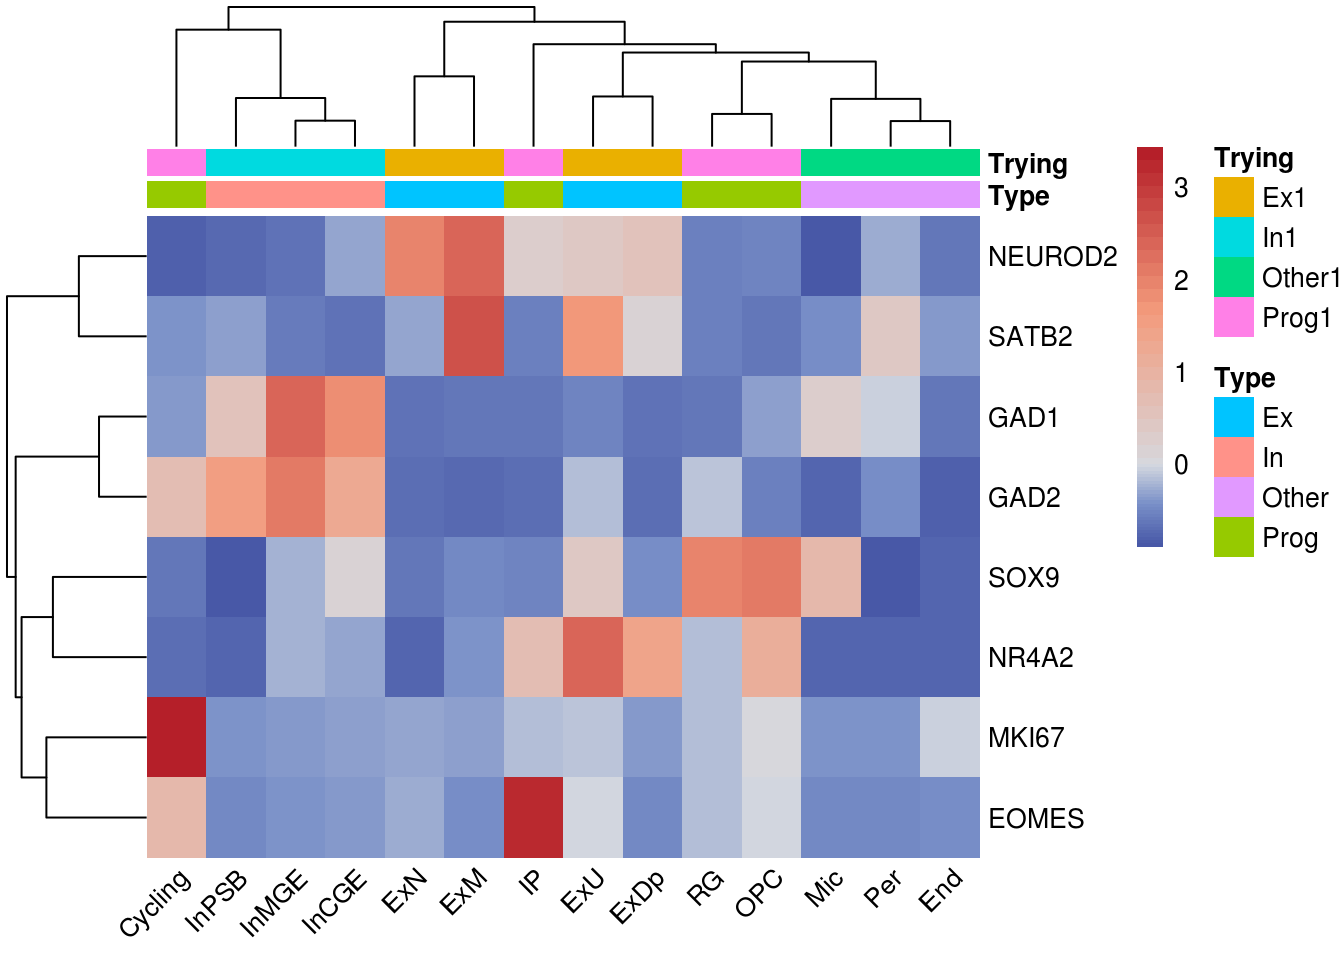
Heatmap colors, annotations
# normalized data
Idents(combined) <- 'cluster'
DefaultAssay(combined) <- 'RNA'
combined <- NormalizeData(combined)


# get pseudobulk expression mat
gn <- c('SOX9', 'HOXP', 'MKI67', 'EOMES', 'NEUROD2', 'SATB2', 'NR4A2', 'GAD1', 'GAD2')
gn <- intersect(gn, rownames(GetAssayData(combined, slot = 'data')))
mat <- AverageExpression(combined, features = gn, slot = 'data')
## Finished averaging RNA for cluster RG
## Finished averaging RNA for cluster Cycling
## Finished averaging RNA for cluster OPC
## Finished averaging RNA for cluster IP
## Finished averaging RNA for cluster ExN
## Finished averaging RNA for cluster ExM
## Finished averaging RNA for cluster ExU
## Finished averaging RNA for cluster ExDp
## Finished averaging RNA for cluster InMGE
## Finished averaging RNA for cluster InCGE
## Finished averaging RNA for cluster InPSB
## Finished averaging RNA for cluster Mic
## Finished averaging RNA for cluster Per
## Finished averaging RNA for cluster End
## Finished averaging SCT for cluster RG
## Finished averaging SCT for cluster Cycling
## Finished averaging SCT for cluster OPC
## Finished averaging SCT for cluster IP
## Finished averaging SCT for cluster ExN
## Finished averaging SCT for cluster ExM
## Finished averaging SCT for cluster ExU
## Finished averaging SCT for cluster ExDp
## Finished averaging SCT for cluster InMGE
## Finished averaging SCT for cluster InCGE
## Finished averaging SCT for cluster InPSB
## Finished averaging SCT for cluster Mic
## Finished averaging SCT for cluster Per
## Finished averaging SCT for cluster End
mat1 <- t(scale(t(mat$RNA)))
# set colors
paletteLength <- 50
#myColor1 <- colorRampPalette(rev(c( rgb(255,42,20,maxColorValue = 255),
# "#FDAE61" ,"#FEE090", "#E0F3F8" ,"#74ADD1" ,"#4575B4")))(paletteLength)
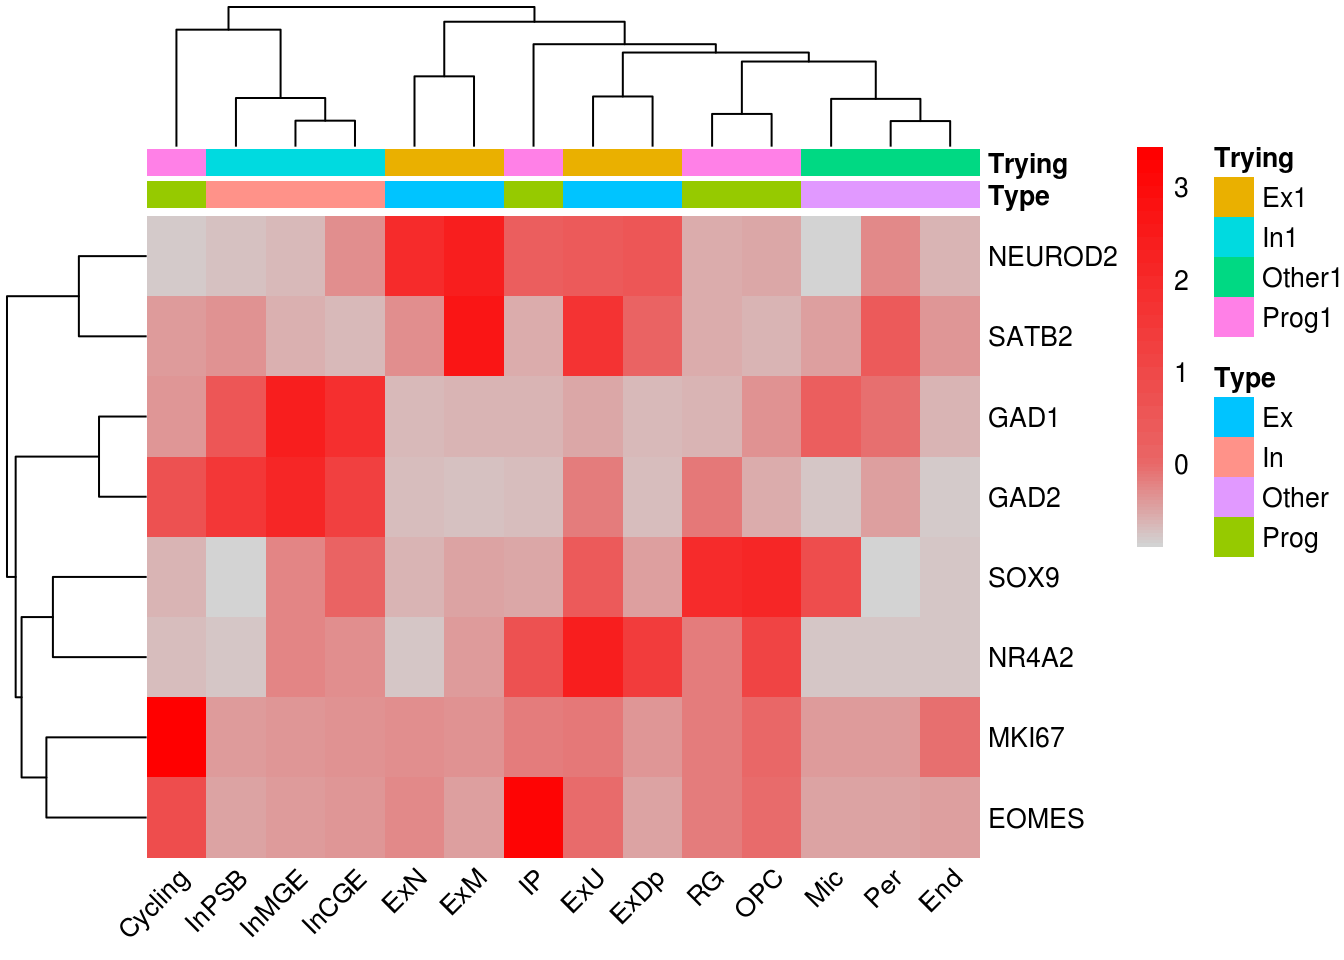
myColor <- viridis::viridis(paletteLength)
myColor1 <- colorRampPalette(ArchRPalettes$coolwarm)(paletteLength)
myColor2 <- colorRampPalette(c('lightgray', 'red'))(paletteLength)
myBreaks <- c(seq(min(mat1), 0, length.out=ceiling(paletteLength/2) + 1),
seq(max(mat1)/paletteLength, max(mat1), length.out=floor(paletteLength/2)))
# set annotation
anno_col <- data.frame(cbind(Type = rep(c('Prog', 'Ex', 'In', 'Other'), times = c(4, 4, 3, 3)),
Trying = rep(c('Prog1', 'Ex1', 'In1', 'Other1'), times = c(4, 4, 3, 3))))
rownames(anno_col) <- colnames(mat1)
re.ls <- list(myColor, myColor1, myColor2) %>% map(~{
pheatmap::pheatmap(
mat1,
border_color = NA,
color = .x,
breaks = myBreaks,
annotation_col = anno_col,
angle_col = 45
)
})

Heatmap label subset rownames
add.flag <- function(pheatmap,
                     kept.labels,
                     repel.degree) {

  # repel.degree = number within [0, 1], which controls how much
  #                space to allocate for repelling labels.
  ## repel.degree = 0: spread out labels over existing range of kept labels
  ## repel.degree = 1: spread out labels over the full y-axis

  heatmap <- pheatmap$gtable

  new.label <- heatmap$grobs[[which(heatmap$layout$name == "row_names")]]

  # keep only labels in kept.labels, replace the rest with ""
  new.label$label <- ifelse(new.label$label %in% kept.labels,
                            new.label$label, "")

  # calculate evenly spaced out y-axis positions
  repelled.y <- function(d, d.select, k = repel.degree){
    # d = vector of distances for labels
    # d.select = vector of T/F for which labels are significant

    # recursive function to get current label positions
    # (note the unit is "npc" for all components of each distance)
    strip.npc <- function(dd){
      if(!"unit.arithmetic" %in% class(dd)) {
        return(as.numeric(dd))
      }

      d1 <- strip.npc(dd$arg1)
      d2 <- strip.npc(dd$arg2)
      fn <- dd$fname
      return(lazyeval::lazy_eval(paste(d1, fn, d2)))
    }

    full.range <- sapply(seq_along(d), function(i) strip.npc(d[i]))
    selected.range <- sapply(seq_along(d[d.select]), function(i) strip.npc(d[d.select][i]))

    return(unit(seq(from = max(selected.range) + k*(max(full.range) - max(selected.range)),
                    to = min(selected.range) - k*(min(selected.range) - min(full.range)),
                    length.out = sum(d.select)),
                "npc"))
  }
  new.y.positions <- repelled.y(new.label$y,
                                d.select = new.label$label != "")
  new.flag <- segmentsGrob(x0 = new.label$x,
                           x1 = new.label$x + unit(0.15, "npc"),
                           y0 = new.label$y[new.label$label != ""],
                           y1 = new.y.positions)

  # shift position for selected labels
  new.label$x <- new.label$x + unit(0.2, "npc")
  new.label$y[new.label$label != ""] <- new.y.positions

  # add flag to heatmap
  heatmap <- gtable::gtable_add_grob(x = heatmap,
                                     grobs = new.flag,
                                     t = 4,
                                     l = 4
  )

  # replace label positions in heatmap
  heatmap$grobs[[which(heatmap$layout$name == "row_names")]] <- new.label

  # plot result
  grid.newpage()
  grid.draw(heatmap)

  # return a copy of the heatmap invisibly
  invisible(heatmap)
}
add.flag(pheatmap = re.ls[[1]], kept.labels = gn[1:2] , repel.degree = 0)
