Set env, load arrow project and scRNA-seq
## Section: set default para
##################################################
addArchRThreads(threads = 16) # setting default number of parallel threads


## Section: load object
##################################################
proj <- loadArchRProject(path = "data/ArchR/ArrowProject/Merged/")


## Section: imputation
##################################################
proj <- addImputeWeights(proj, reducedDims = "IterativeLSI_peak")


## Section: load scRNA-seq seurat object
##################################################
ct <- readRDS("data/SYM-scRNA-Res-Demo_expression_mat.RDS")
meta <- readRDS("data/SYM-scRNA-Res-Demo_meta.RDS")
rse <- SummarizedExperiment(assays = SimpleList(counts = ct), colData = meta)

table(colData(rse)$cell_type)
##
## Astrocyte   Cycling       End        Ex     Ex-SP      Ex-U     InCGE     InMGE
##        10        65        31      1004       152       425       423       533
##     InPSB        IP       Mic       OPC       oRG       Per       vRG
##        32        83        13        37        93        12        87
Unconstrained integration
proj <- addGeneIntegrationMatrix(
    ArchRProj = proj,
    useMatrix = "GeneScoreMatrix",
    matrixName = "GeneIntegrationMatrix",
    reducedDims = "IterativeLSI_peak",
    seRNA = rse,
    addToArrow = TRUE,
    groupRNA = "cell_type",
    nameCell = "predictedCell",
    nameGroup = "predictedGroup",
    nameScore = "predictedScore",
    force = TRUE
)
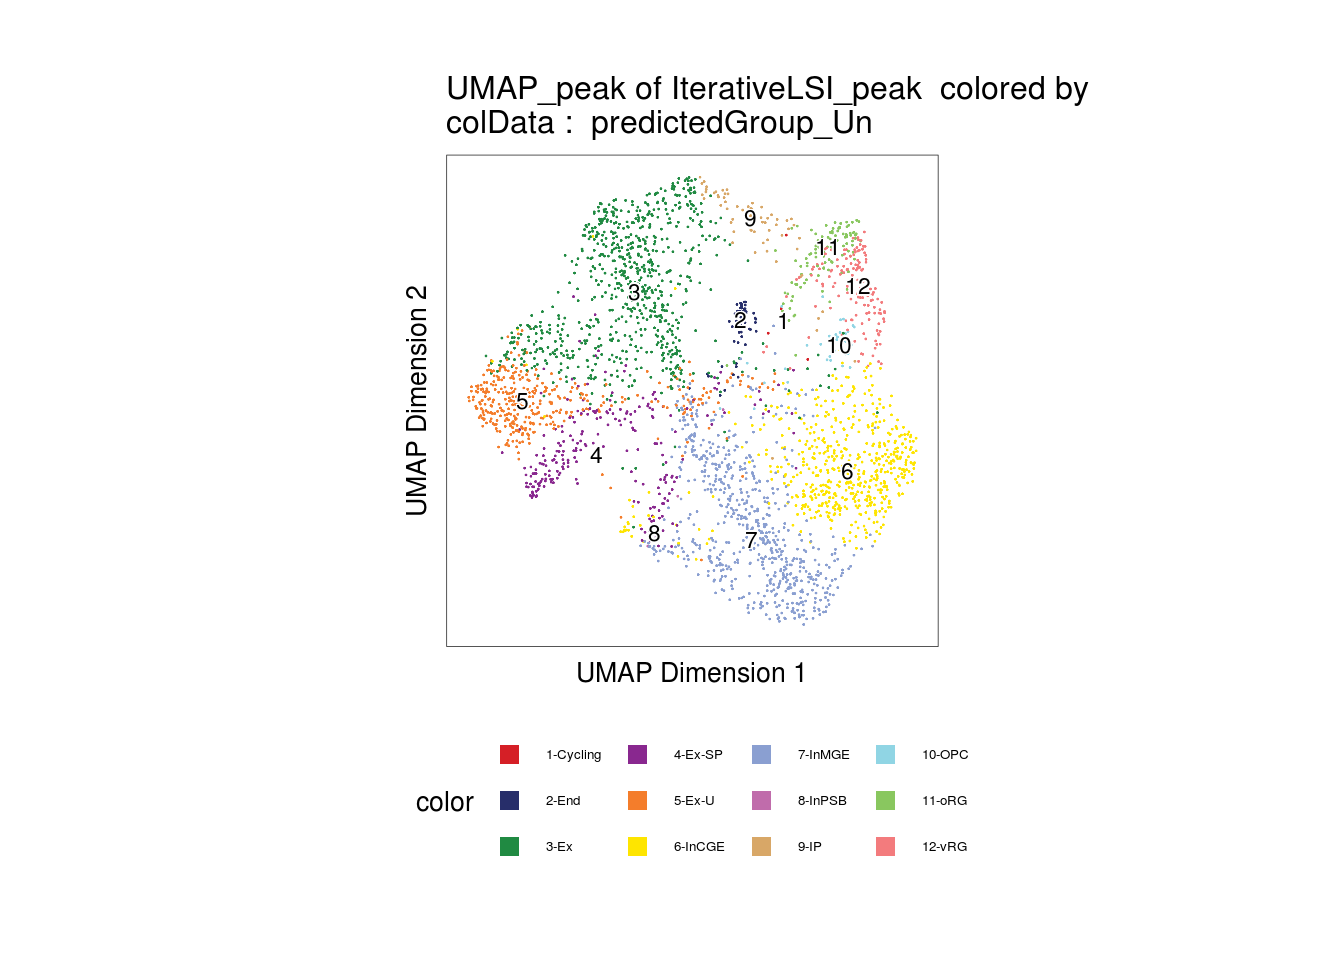
Visualize the predicted cell types
plotEmbedding(
    proj,
    embedding = "UMAP_peak",
    colorBy = "cellColData",
    name = "predictedGroup_Un"
)
## ArchR logging to : ArchRLogs/ArchR-plotEmbedding-25d375ee72bd-Date-2021-11-12_Time-14-59-25.log
## If there is an issue, please report to github with logFile!
## Getting UMAP Embedding
## ColorBy = cellColData
## Plotting Embedding
## 1
## ArchR logging successful to : ArchRLogs/ArchR-plotEmbedding-25d375ee72bd-Date-2021-11-12_Time-14-59-25.log
cM <- as.matrix(confusionMatrix(proj$Cluster_peak_res.0.8, proj$predictedGroup_Un))
cM
##     End vRG Ex-SP  Ex InMGE InCGE Cycling Ex-U OPC IP oRG InPSB
## C1   46   0     0   1     0     0       0    0   0  0   0     0
## C6    0  20     1  17     7    71       0    5  27  3   1     0
## C10   0   0    51   4   107    38       0    2   1  0   0     4
## C8    0   0     1  93     0     0       0    0   0 57   0     0
## C11   0   0     0   0   319     6       0    0   0  0   0     0
## C9    0   0     1 401     0     1       0    0   0  0   0     0
## C2    0   0    62 163     0     3       0  288   0  0   0     0
## C12   0   0     1   1     7   410       0    0   0  1   0     0
## C3    0   0    84   0     0     0       0    1   0  0   0     0
## C7    0 121     0   3     0     0       3    0   3  8 107     0
## C4    3   0    24  69   177     5       0   44   0  0   1     1
## C5    7   2    11  19    23    26       1   30   5  0   1     0
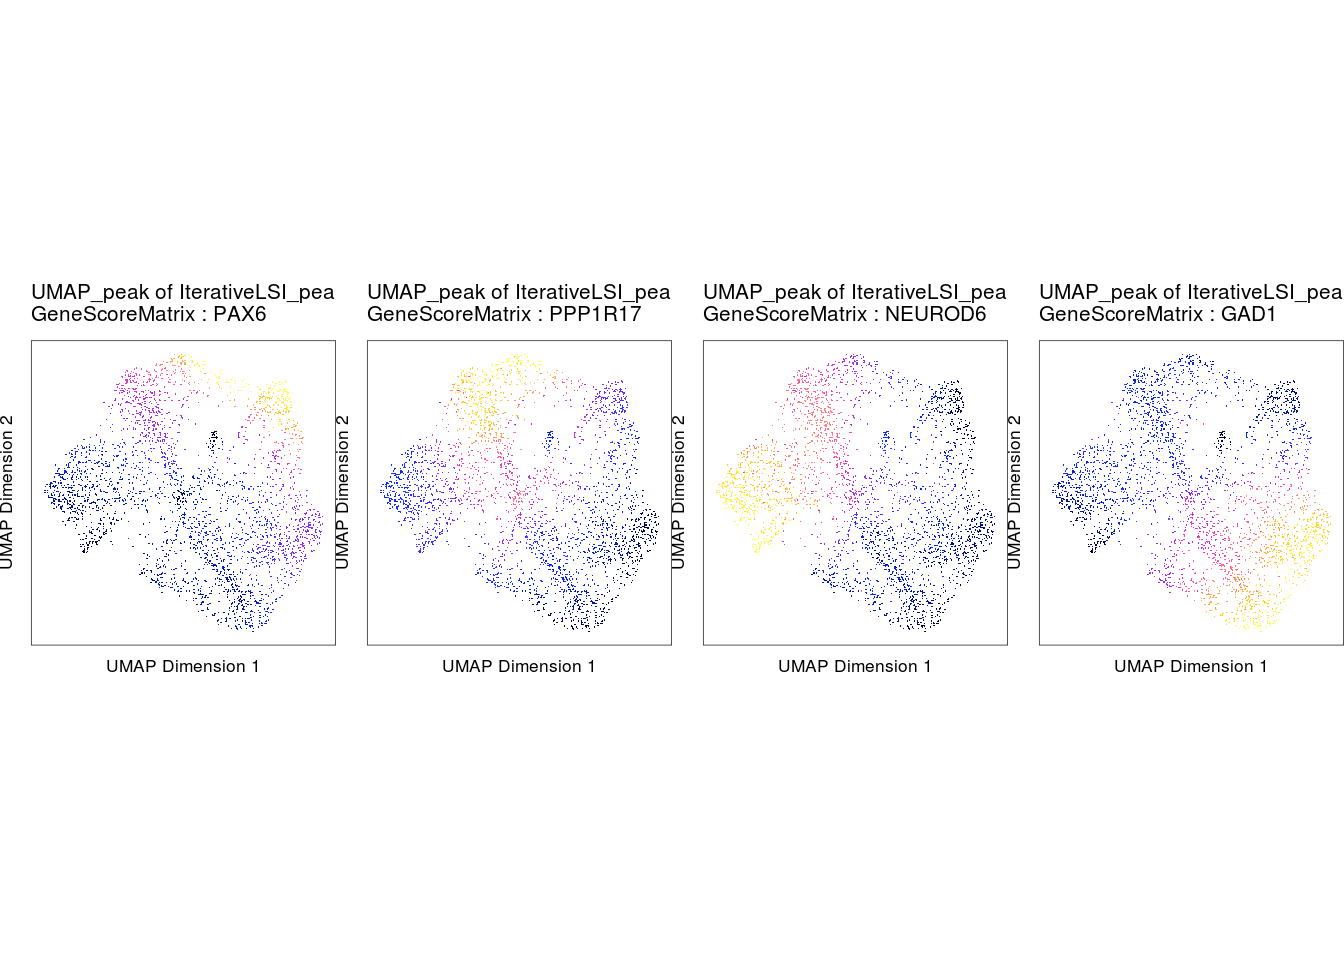
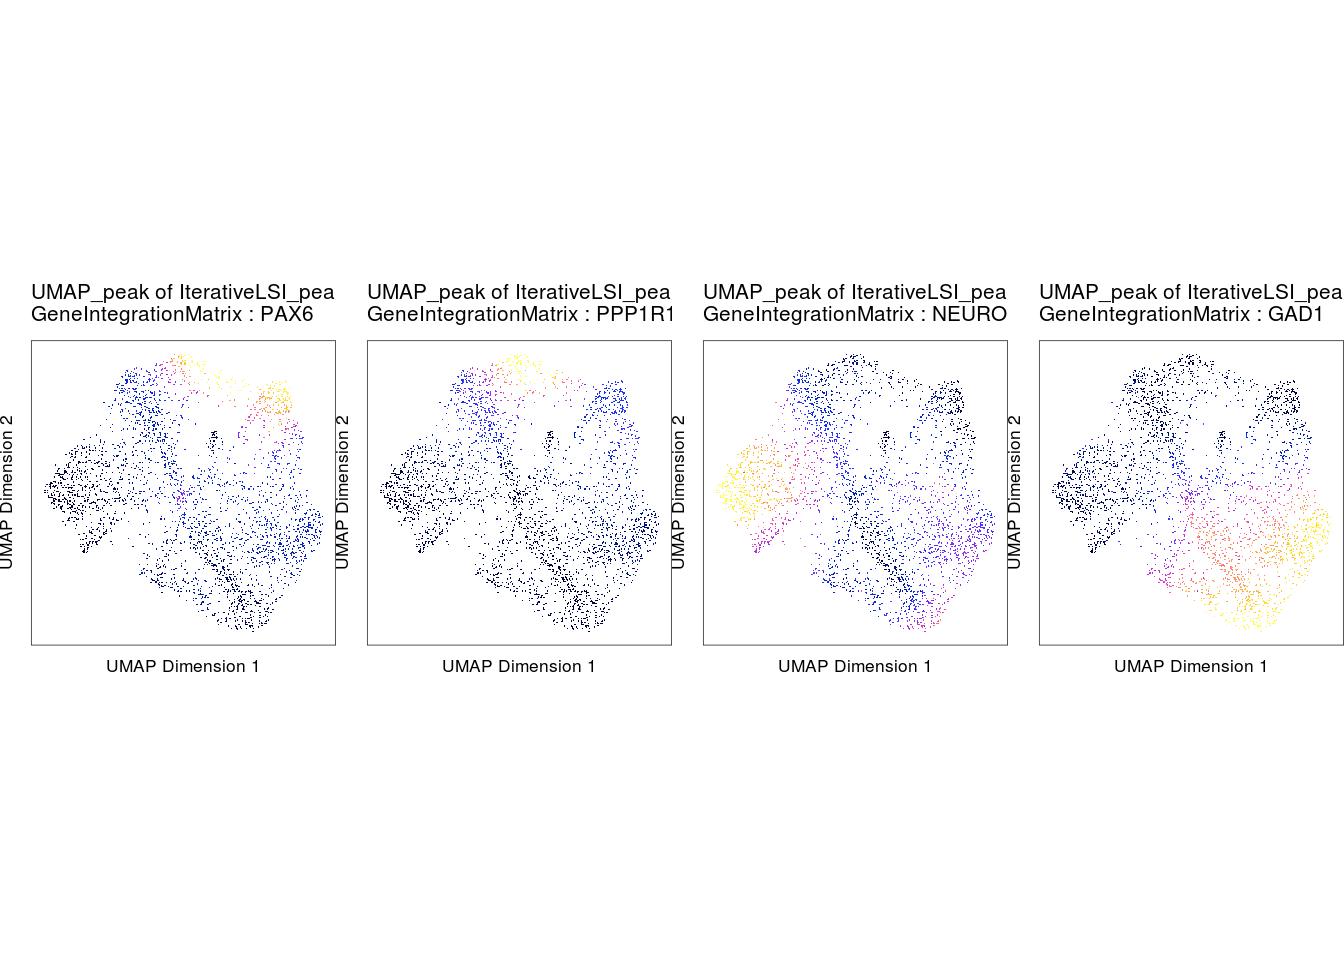
Compare gene scores and gene expression
markerGenes <- c("PAX6", "PPP1R17", "NEUROD6", "GAD1")

p1 <- plotEmbedding(
    ArchRProj = proj,
    colorBy = "GeneIntegrationMatrix",
    name = markerGenes,
    continuousSet = "horizonExtra",
    embedding = "UMAP_peak",
    imputeWeights = getImputeWeights(proj)
)
## Getting ImputeWeights
## ArchR logging to : ArchRLogs/ArchR-plotEmbedding-25d34b4c695a-Date-2021-11-12_Time-14-59-31.log
## If there is an issue, please report to github with logFile!
## Getting UMAP Embedding
## ColorBy = GeneIntegrationMatrix
## Getting Matrix Values...
## 2021-11-12 14:59:32 :
##
## Imputing Matrix
## Using weights on disk
## 1 of 1
## Plotting Embedding
## 1 2 3 4
## ArchR logging successful to : ArchRLogs/ArchR-plotEmbedding-25d34b4c695a-Date-2021-11-12_Time-14-59-31.log
p2 <- plotEmbedding(
    ArchRProj = proj,
    colorBy = "GeneScoreMatrix",
    continuousSet = "horizonExtra",
    name = markerGenes,
    embedding = "UMAP_peak",
    imputeWeights = getImputeWeights(proj)
)
## Getting ImputeWeights
## ArchR logging to : ArchRLogs/ArchR-plotEmbedding-25d3613c9d45-Date-2021-11-12_Time-14-59-36.log
## If there is an issue, please report to github with logFile!
## Getting UMAP Embedding
## ColorBy = GeneScoreMatrix
## Getting Matrix Values...
## 2021-11-12 14:59:37 :
##
## Imputing Matrix
## Using weights on disk
## 1 of 1
## Plotting Embedding
## 1 2 3 4
## ArchR logging successful to : ArchRLogs/ArchR-plotEmbedding-25d3613c9d45-Date-2021-11-12_Time-14-59-36.log
p1c <- lapply(p1, function(x){
    x + guides(color = FALSE, fill = FALSE) +
    theme_ArchR(baseSize = 6.5) +
    theme(plot.margin = unit(c(0, 0, 0, 0), "cm")) +
    theme(
        axis.text.x=element_blank(),
        axis.ticks.x=element_blank(),
        axis.text.y=element_blank(),
        axis.ticks.y=element_blank()
    )
})

p2c <- lapply(p2, function(x){
    x + guides(color = FALSE, fill = FALSE) +
    theme_ArchR(baseSize = 6.5) +
    theme(plot.margin = unit(c(0, 0, 0, 0), "cm")) +
    theme(
        axis.text.x=element_blank(),
        axis.ticks.x=element_blank(),
        axis.text.y=element_blank(),
        axis.ticks.y=element_blank()
    )
})

do.call(cowplot::plot_grid, c(list(ncol = 4), p1c))
do.call(cowplot::plot_grid, c(list(ncol = 4), p2c))