Chapter 5 Scrublet Doublet Validation
library(Seurat)
library(tidyverse)
library(magrittr)
library(data.table)
5.1 Description
check the doublet prediction from
scrubletbydimension reduction plot
nUMI distribution
judge the component for doublet cells by
DEG heatmap
canonical gene expression
5.2 Load seurat object
combined <- get(load('data/Demo_CombinedSeurat_SCT_Preprocess.RData'))
Idents(combined) <- "cluster"
5.3 Validate the doublet prediction
# check whether the double cells cluster together
FeaturePlot(combined, features = "DoubletScores", pt.size = 0.01)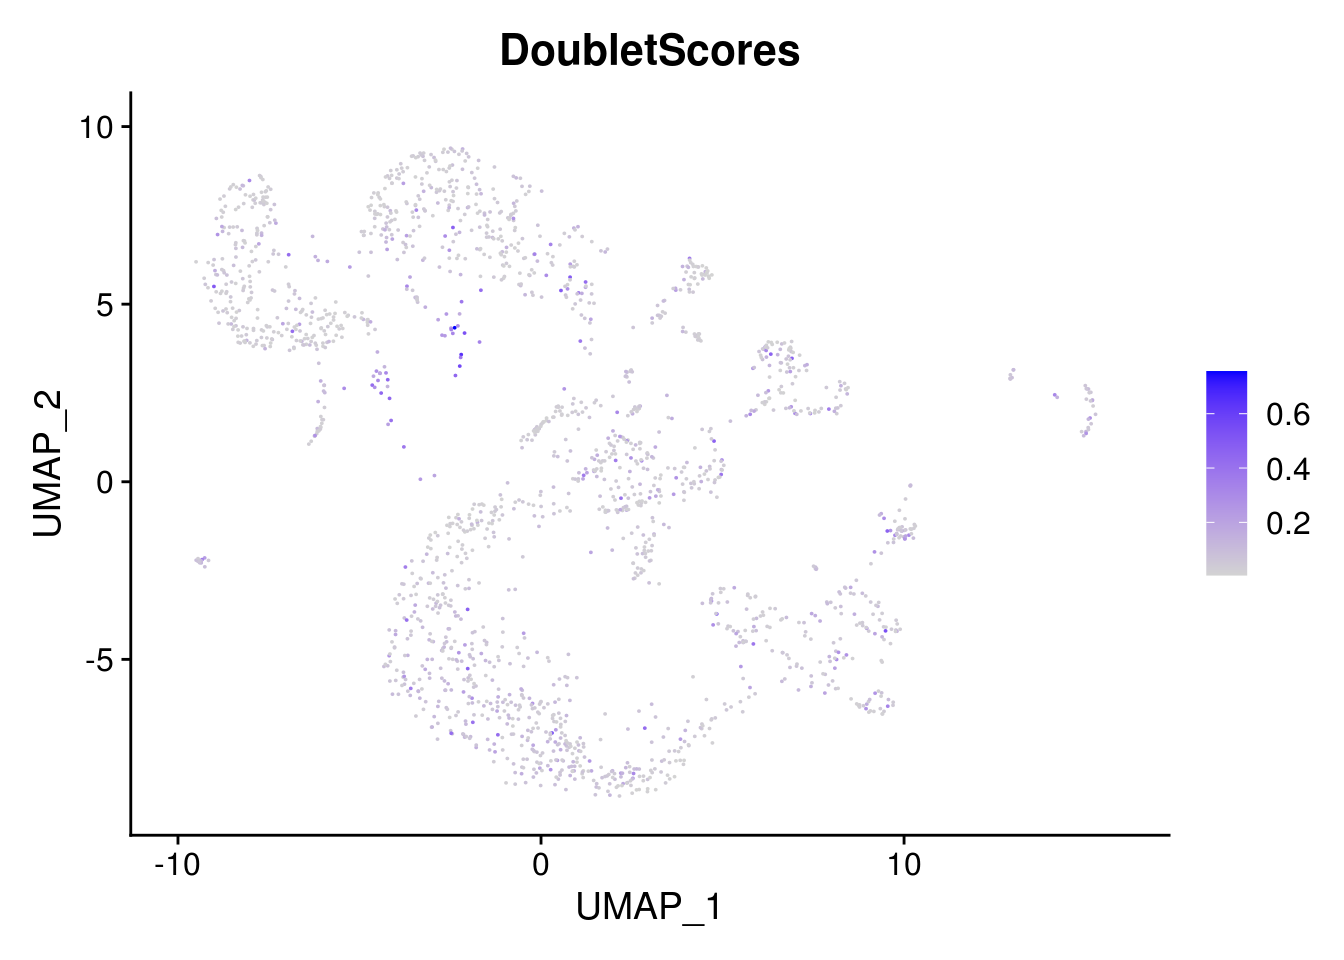
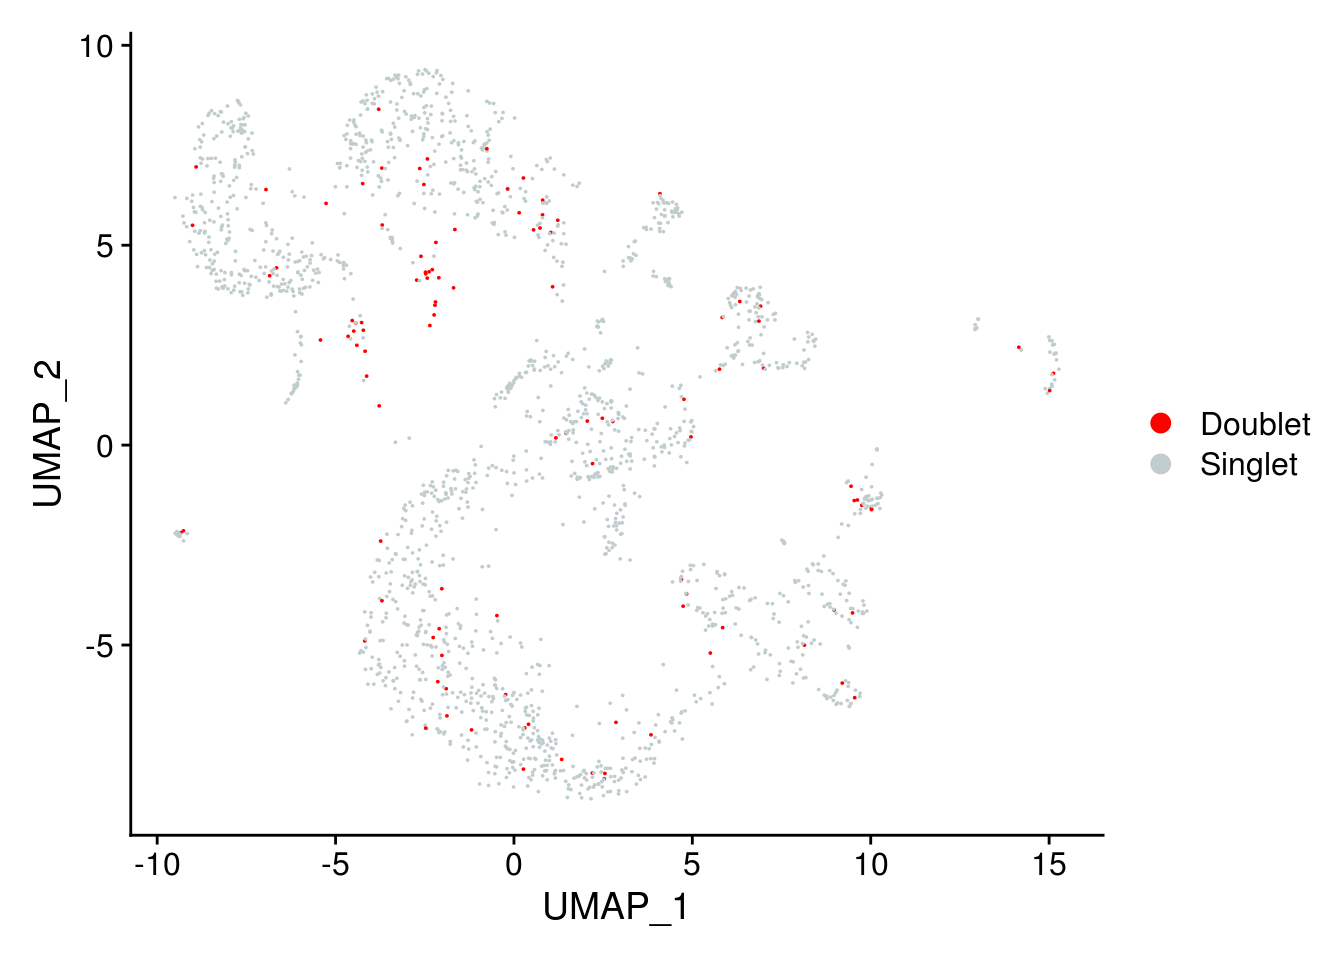
DimPlot(
  combined,
  group.by = "DoubletPrediction",
  pt.size = 0.01,
  cols = c("red", "azure3")
)
# check the nUMI for doublet and singlet
VlnPlot(combined,
        features = "nCount_RNA",
        pt.size = 0,
        group.by = "DoubletPrediction") + NoLegend()
5.4 Calculate factions of doublet per cluster
df <- data.table(combined@meta.data)
sel.meta <- c("DoubletPrediction", "cluster", "Individual")
df <- df[, sel.meta, with = FALSE]


df[, 2:3] %>% map( ~ {
  freq1 <- df[, .N, keyby = .(.x, DoubletPrediction)]
  freq1[, total := sum(N), by = .(.x)]
  freq1[, ratio := N / total]

  linesize = .35
  fontsize = 8

  ggplot(freq1, aes(fill=DoubletPrediction, y=ratio, x= .x)) +
    geom_bar(position="stack", stat="identity")+
    scale_fill_manual(values = c("Doublet" = 'red', "Singlet" = "grey")) +
    xlab('Clsuter') +
    scale_y_continuous(breaks = seq(0,1,0.1), expand = c(0,0), name = 'Percentage')+
    theme_bw()+
    theme( panel.grid.major.x = element_blank(),
           panel.grid.major.y = element_blank(),
           panel.grid.minor = element_blank(),
           strip.background = element_blank(),panel.border = element_rect(size = linesize),
           axis.ticks = element_blank(),
           axis.text.x = element_text(size = 5))

})
## $cluster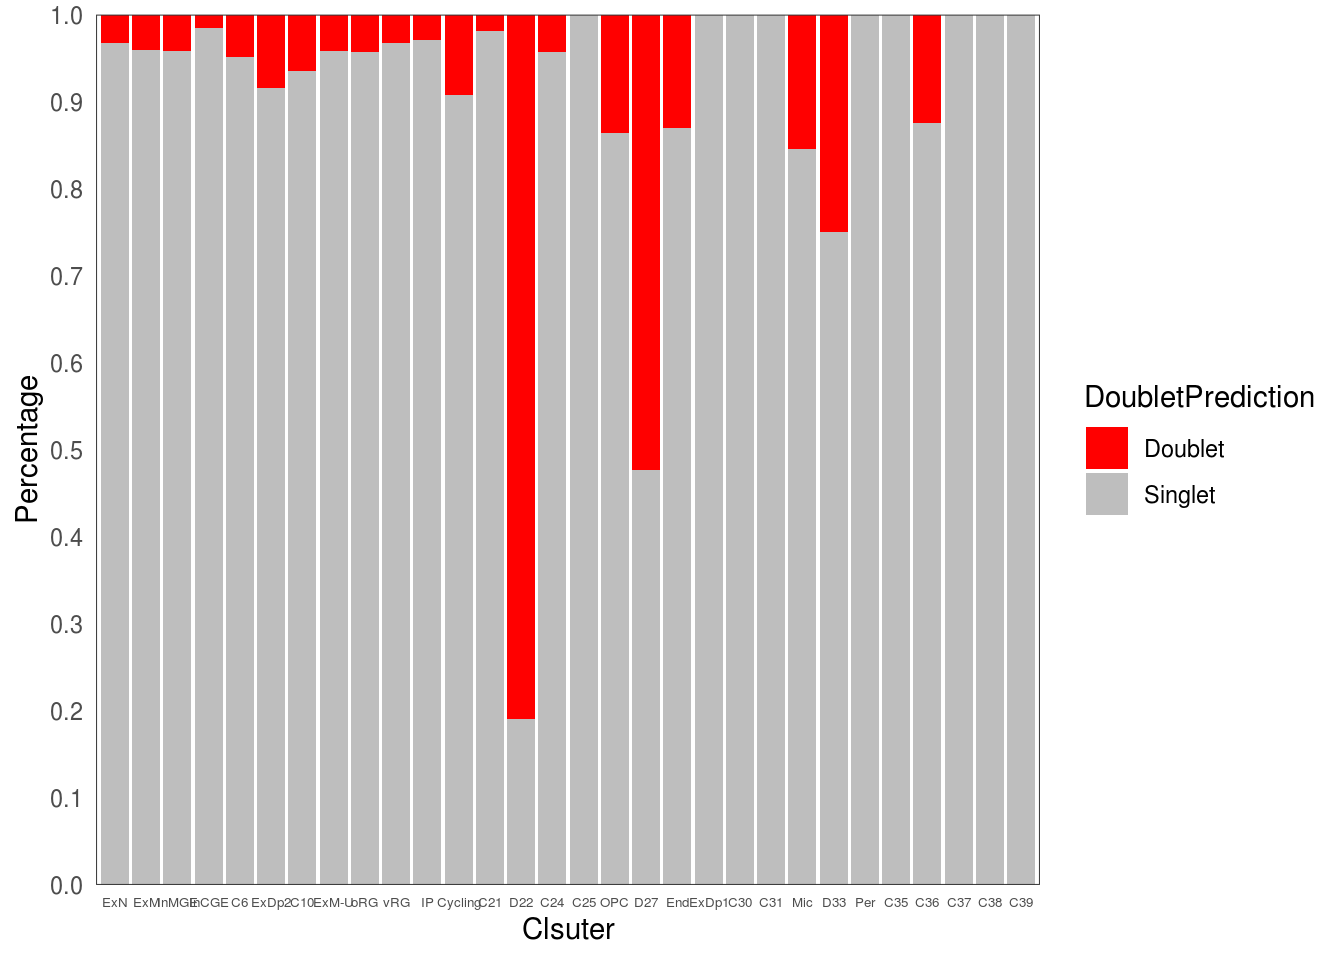
##
## $Individual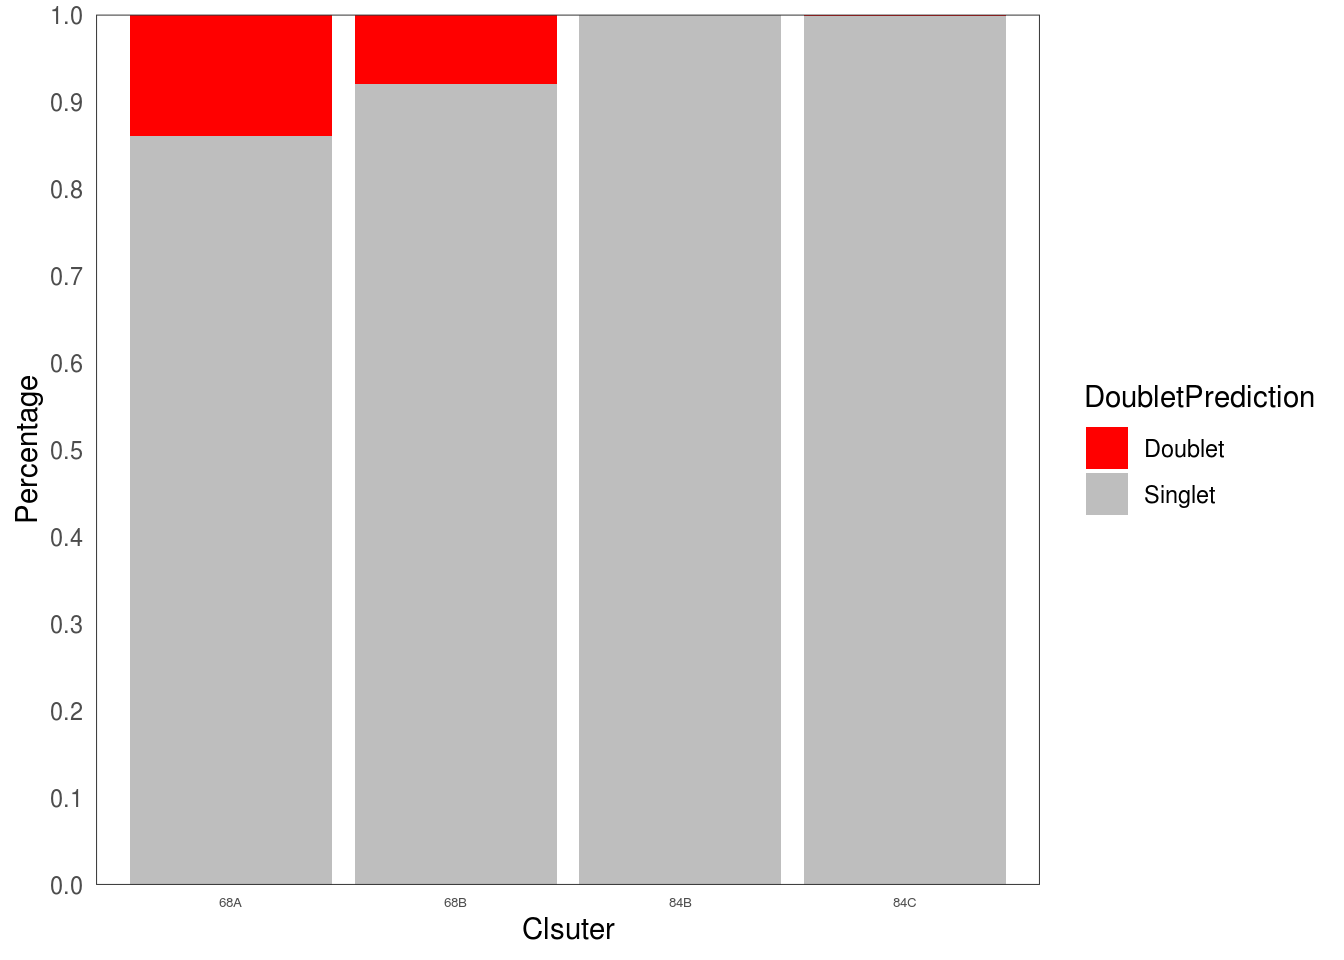
5.5 Explore the component clusters for doublets by DEG
- get the DEG for inferred source clusters. Here, for C33, InCGE and InMGE
# find DEG
cluster.markers <- FindMarkers(combined, ident.1 = c("InMGE"), ident.2 = "InCGE", min.pct = 0.25)

# subset cells of interest
sel.idents <- c("InMGE", "InCGE",  "D33")
combined.small <- subset(combined, cells = WhichCells(combined, idents = sel.idents))

# check the expression for top DEG
#sel.cells <- WhichCells(combined.small, idents = sel.idents, downsample =  355) # for large dataset
DoHeatmap(combined.small, features = rownames(cluster.markers)[1:40], raster = F)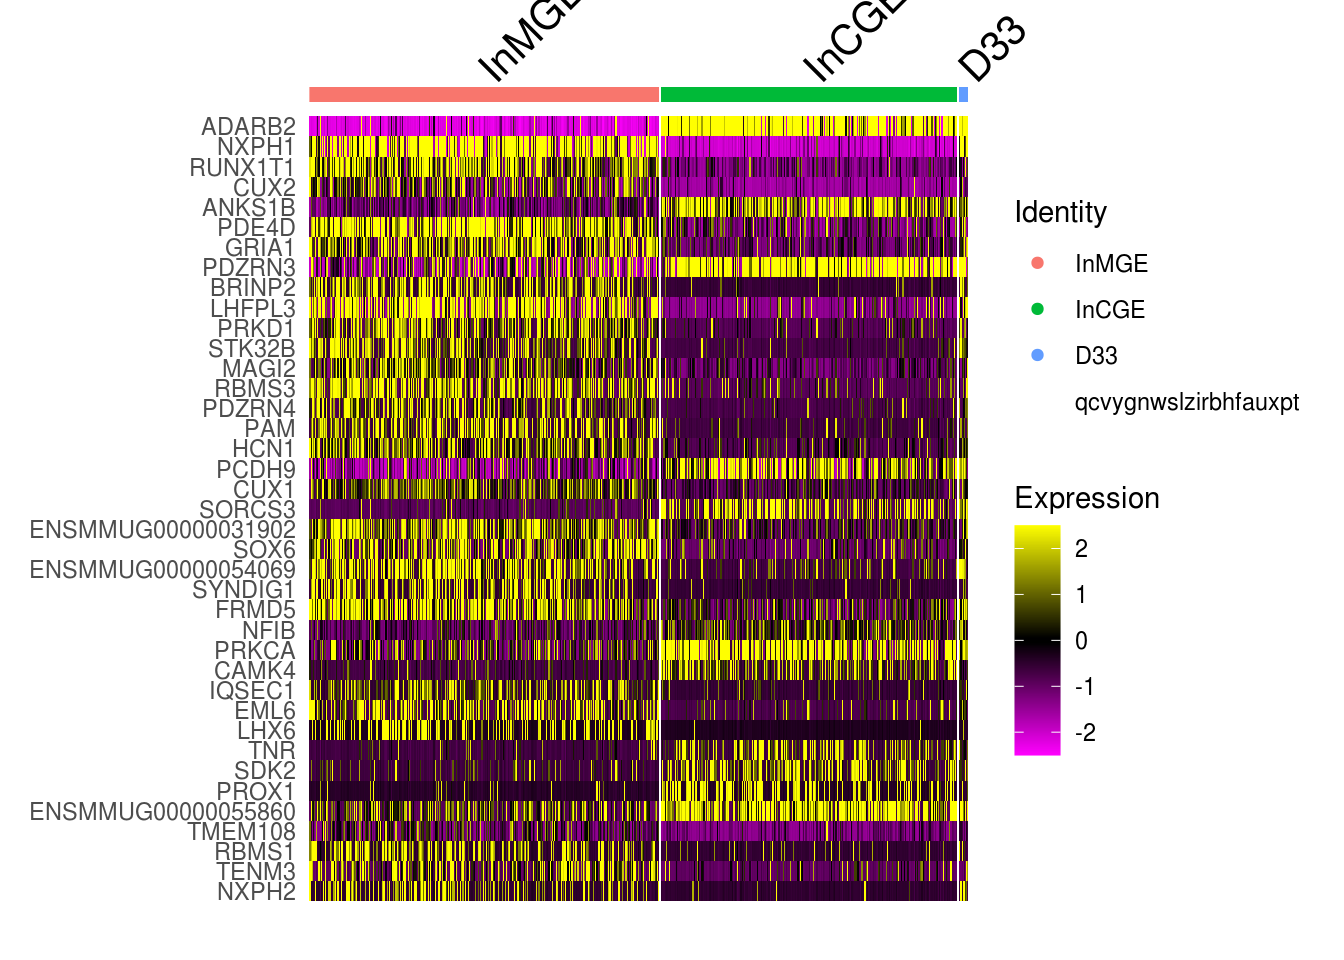
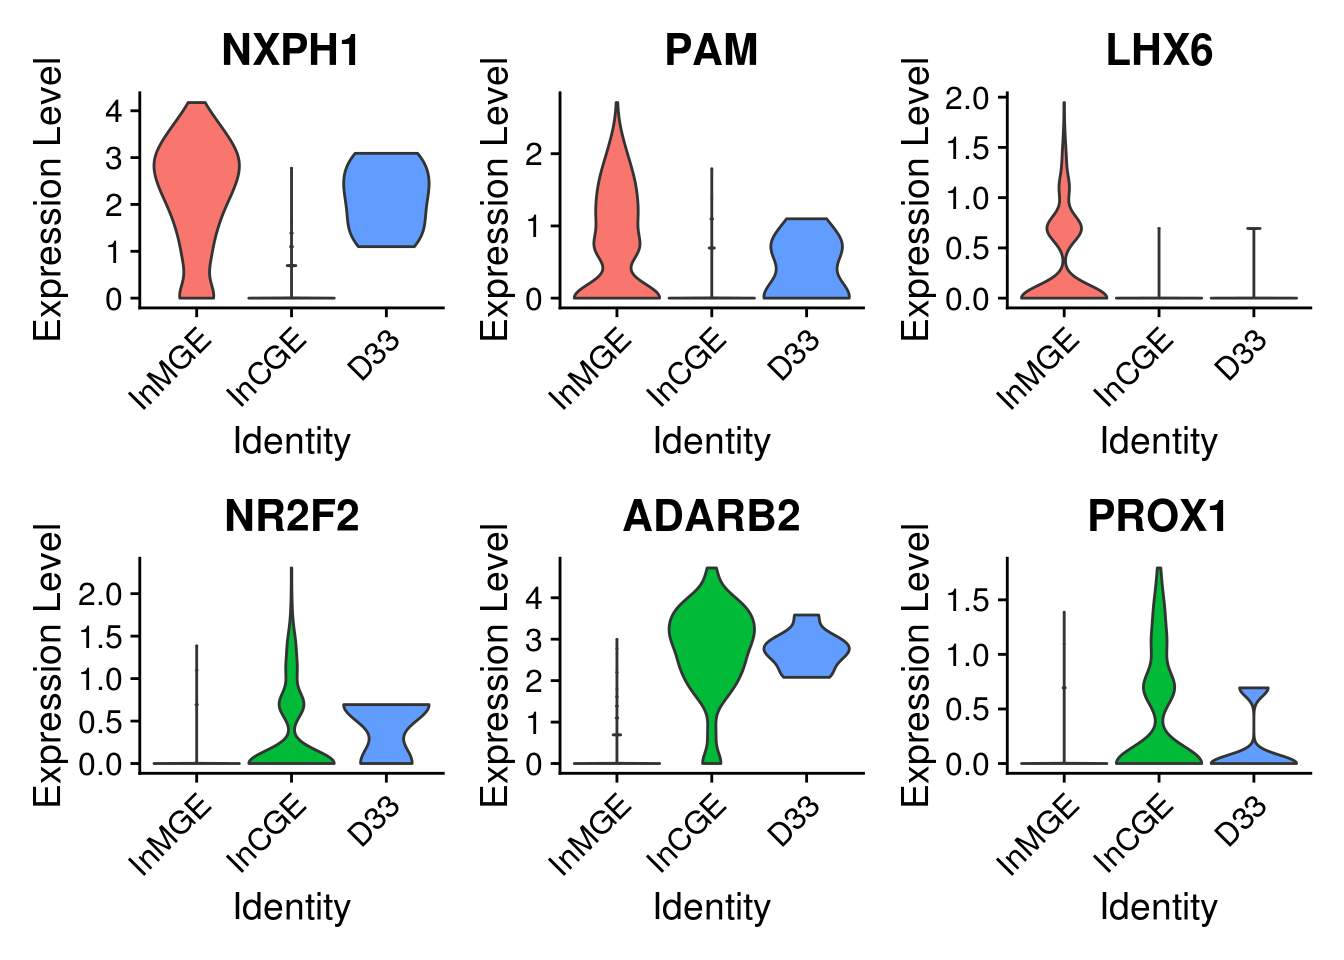
5.6 Explore the component clusters for doublets by canonical gene
sel.feature <- c("NXPH1", "PAM", "LHX6", "NR2F2", "ADARB2",  "PROX1")
FeaturePlot(combined, features = sel.feature,  pt.size = 0.01, ncol = 3)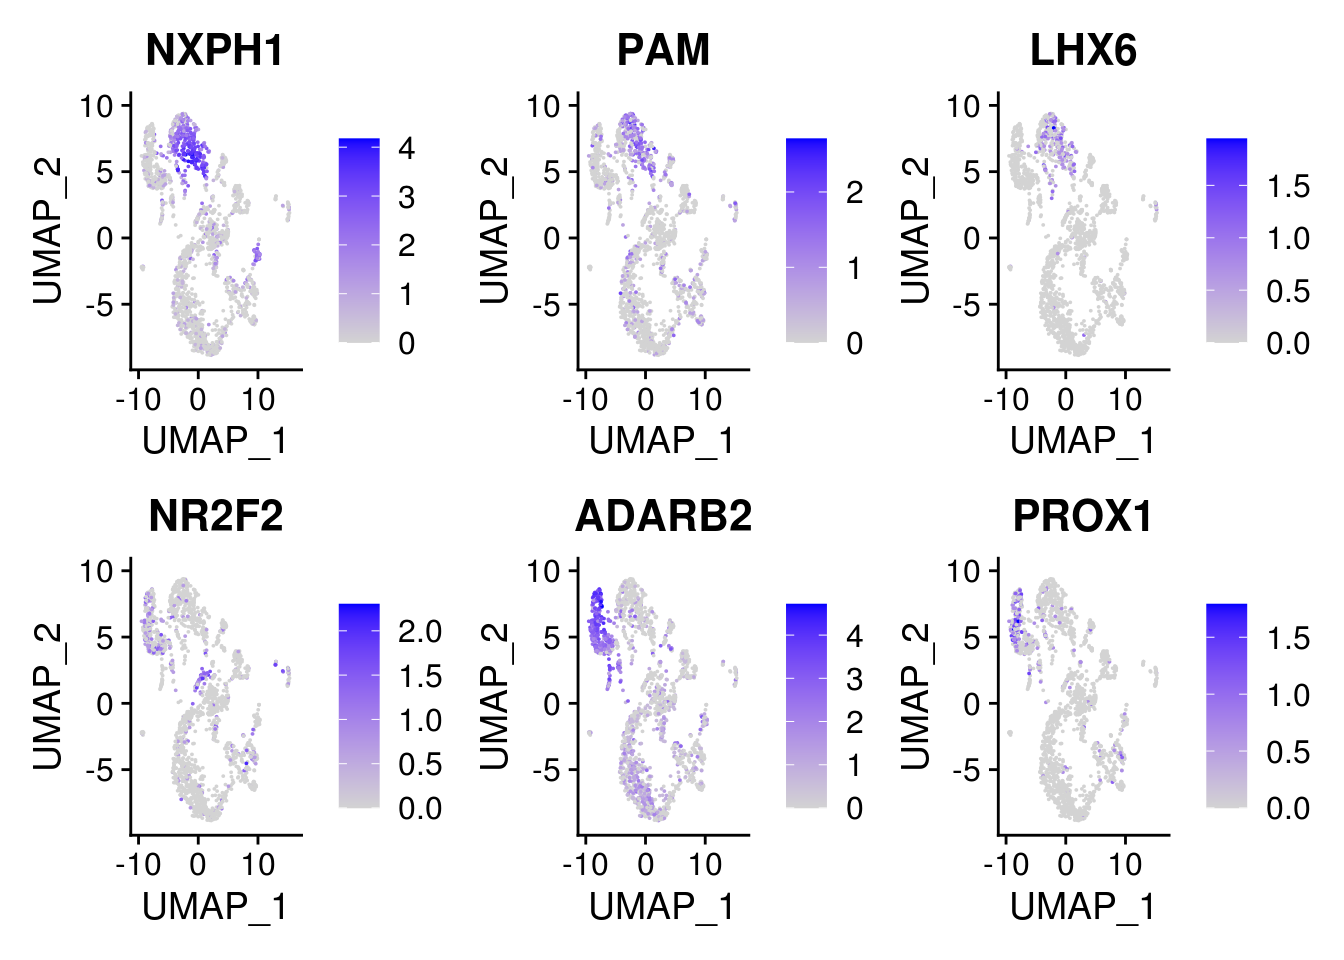
VlnPlot(combined.small, features = sel.feature, pt.size = 0, ncol = 3, idents = sel.idents)