Chapter 8 Color Palette
library(Seurat)
library(tidyverse)
library(magrittr)
library(ArchR)
library(RColorBrewer)
8.1 Descripiton
Showing the colorpalette for heatmap and discrete clusters dimplot
8.2 Load seurat object
combined <- get(load('data/Demo_CombinedSeurat_SCT_Preprocess.RData'))8.3 ColorPalette for heatmap
col.ls <- ArchRPalettes[16:30]
p.ls <- col.ls %>% imap( ~ {
  FeaturePlot(object = combined, features = "GAD1", cols = .x) + ggtitle(label = .y)
})

p.ls1 <- lapply(p.ls, function(x) {
  x +
    #guides(color = FALSE, fill = FALSE) +
    theme_ArchR(baseSize = 6.5, legendPosition = "right") +
    theme(plot.margin = unit(c(0, 0, 0, 0), "cm")) +
    theme(
      axis.text.x = element_blank(),
      axis.ticks.x = element_blank(),
      axis.text.y = element_blank(),
      axis.ticks.y = element_blank()
    )
})
do.call(cowplot::plot_grid, c(list(ncol = 2), p.ls1[1:7]))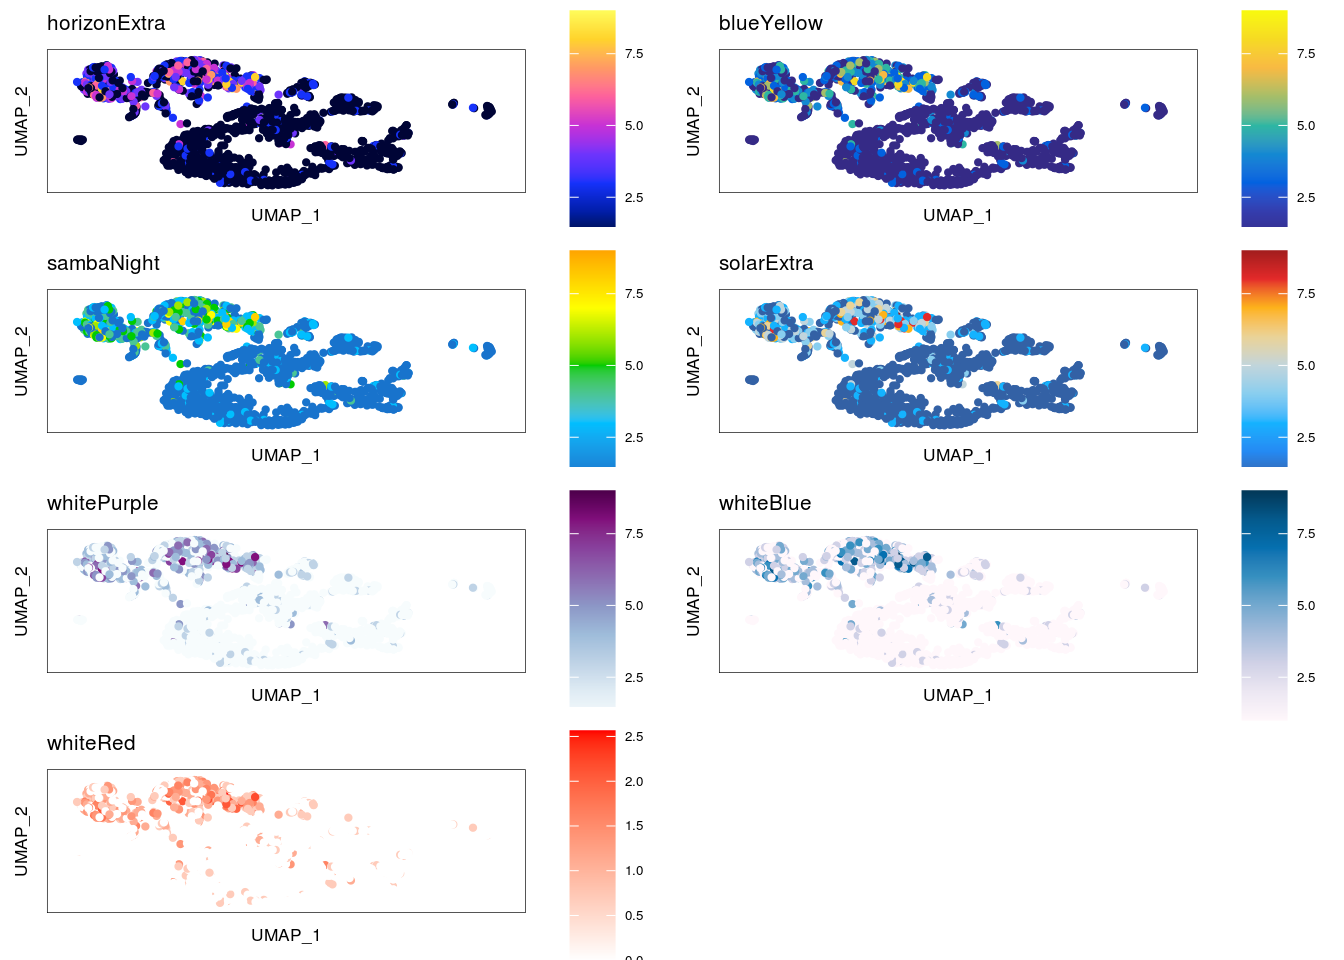
do.call(cowplot::plot_grid, c(list(ncol = 2), p.ls1[8:15]))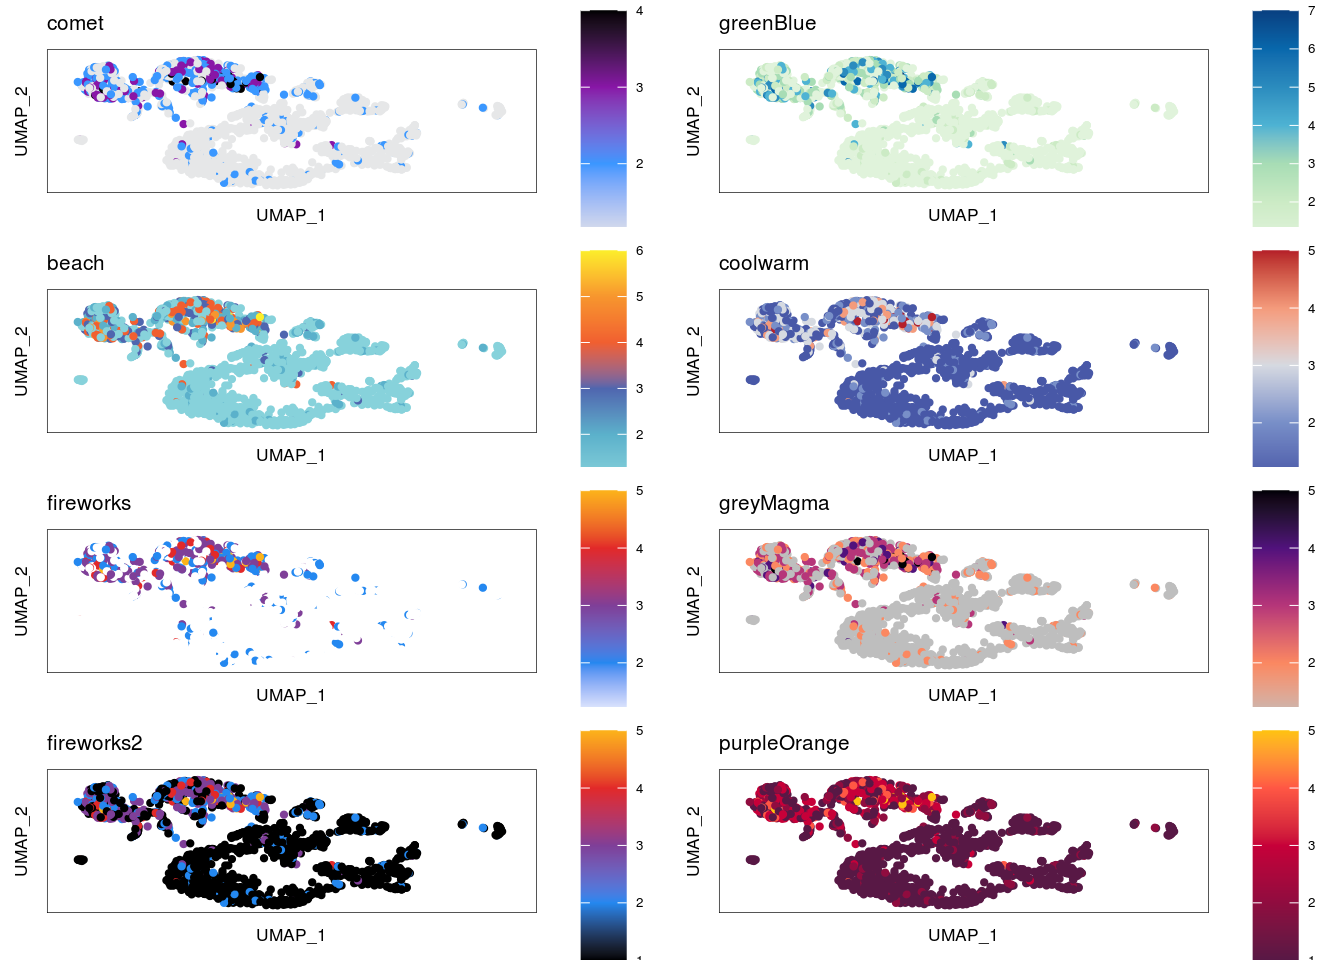
8.4 ColorPalette for discreate groups
Idents(object = combined) <- 'cluster'

df <- data.frame(x = 1:20, y = 1:20)
# archR palette
col.ls <- ArchRPalettes[1:14]
p.ls <- col.ls %>% imap(~ {
  g <-
    ggplot(df[1:length(.x),], aes(x, y)) + geom_point(color = .x, size = 3) + ggtitle(label = .y) +
    theme_ArchR(baseSize = 6.5, legendPosition = "right") +
    theme(plot.margin = unit(c(0, 0, 0, 0), "cm")) +
    theme(
      axis.text = element_blank(),
      axis.ticks = element_blank(),
      axis.title = element_blank()
    )
  return(g)
})

do.call(cowplot::plot_grid, c(list(ncol = 4), p.ls))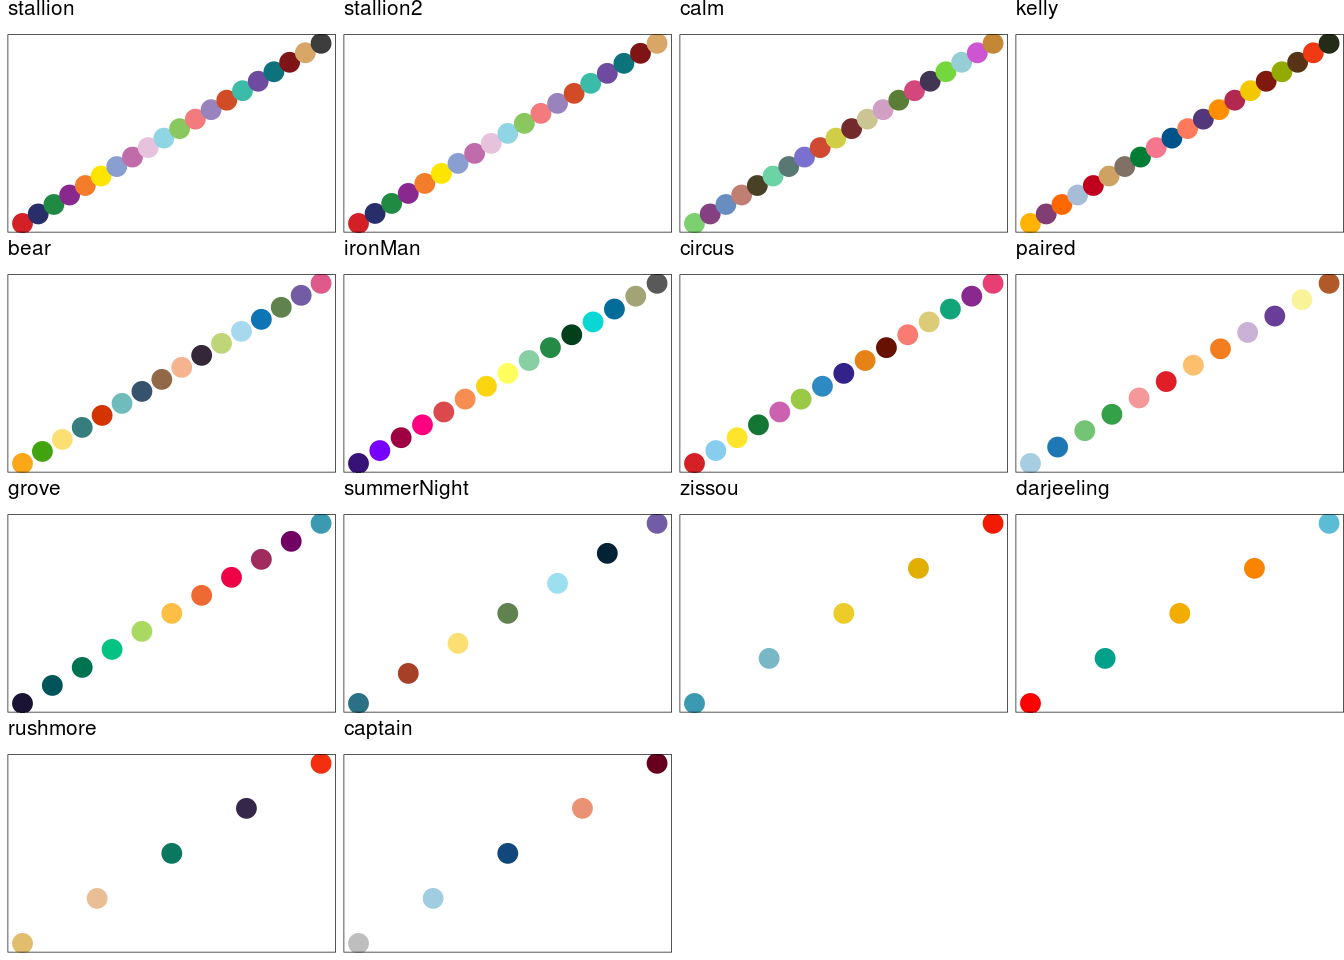
# the inside color assign from seurat
colorP <- function(plot){
  if (!is.null(x = cols)) {
    if (length(x = cols) == 1 && (is.numeric(x = cols) ||
                                  cols %in% rownames(x = brewer.pal.info))) {
      scale <- scale_color_brewer(palette = cols, na.value = na.value)
    }
    else if (length(x = cols) == 1 && (cols %in% c("alphabet",
                                                   "alphabet2", "glasbey", "polychrome", "stepped"))) {
      colors <- DiscretePalette(length(unique(data[[col.by]])),
                                palette = cols)
      scale <- scale_color_manual(values = colors, na.value = na.value)
    }
    else {
      scale <- scale_color_manual(values = cols, na.value = na.value)
    }
    plot <- plot + scale
  }

}

# discretepalette
col.ls <- c("alphabet",  "alphabet2", "glasbey", "polychrome", "stepped")
p.ls <- col.ls %>% imap( ~ {
  cols <- DiscretePalette(n = 36, palette = .x)
  df <- data.frame(x = 1:36, y = 1:36)
  g <-
    ggplot(df, aes(x, y)) +
    geom_point(size = 3, color = cols) +
    ggtitle(label = .x) +
    theme_ArchR(baseSize = 6.5, legendPosition = "right") +
    theme(plot.margin = unit(c(0, 0, 0, 0), "cm")) +
    theme(
      axis.text = element_blank(),
      axis.ticks = element_blank(),
      axis.title = element_blank()
    )
  return(g)
})

do.call(cowplot::plot_grid, c(list(ncol = 2), p.ls))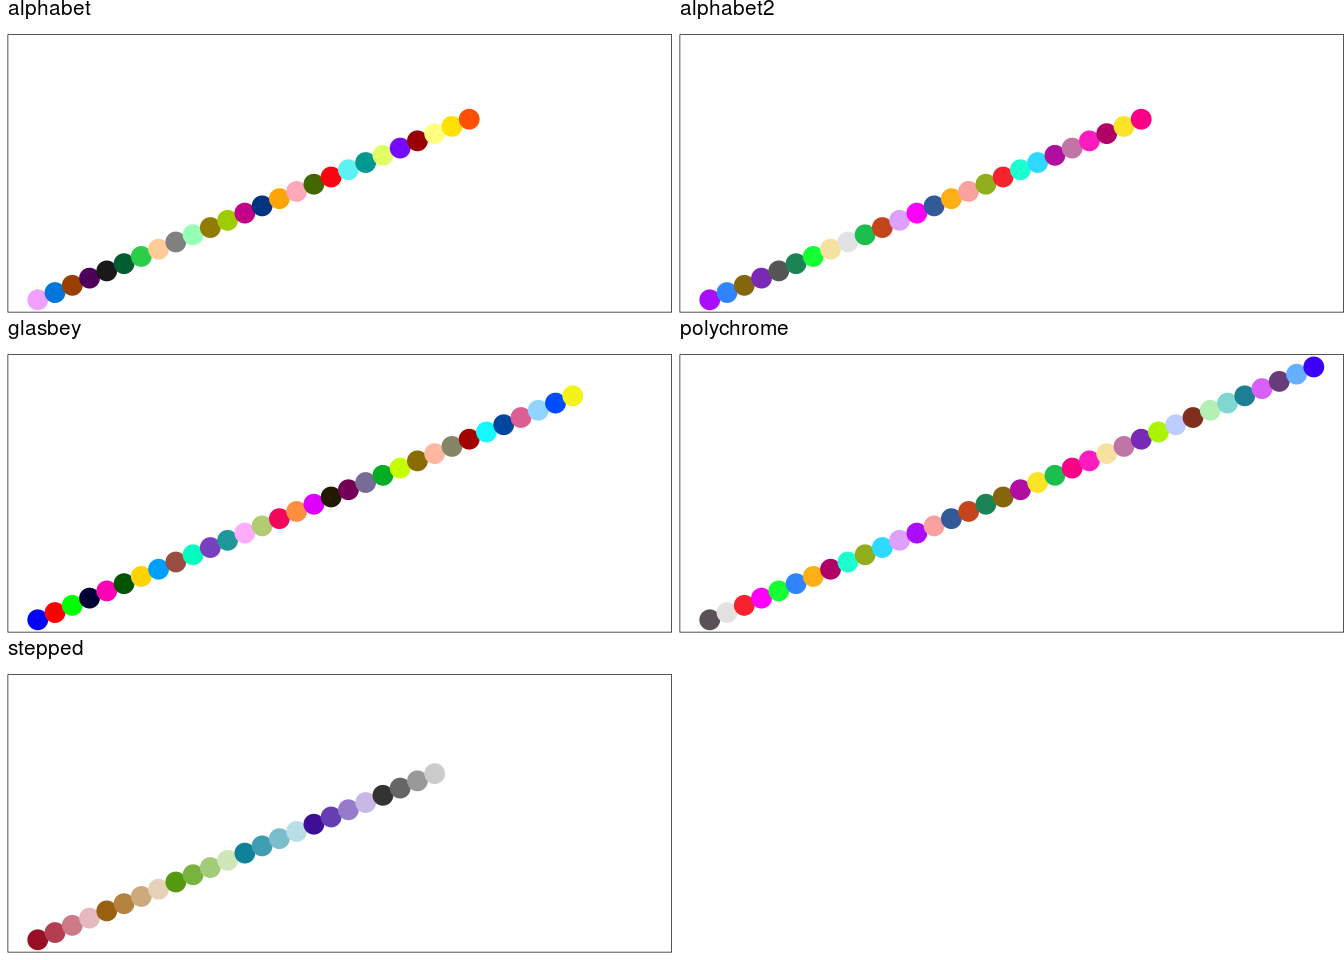
# rcolorbrew

p.ls <- 1:35 %>% imap( ~ {
  cols <-
    brewer.pal(name = rownames(brewer.pal.info)[.x],
               n = brewer.pal.info$maxcolors[.x])
  g <-
    ggplot(df[1:length(cols), ], aes(x, y)) + geom_point(color = cols, size = 3) +
    ggtitle(label = str_c(rownames(brewer.pal.info)[.x], " : ", brewer.pal.info$maxcolors[.x])) +
    theme_ArchR(baseSize = 6.5, legendPosition = "right") +
    theme(plot.margin = unit(c(0, 0, 0, 0), "cm")) +
    theme(
      axis.text = element_blank(),
      axis.ticks = element_blank(),
      axis.title = element_blank()
    )
  return(g)
})

do.call(cowplot::plot_grid, c(list(ncol = 5), p.ls))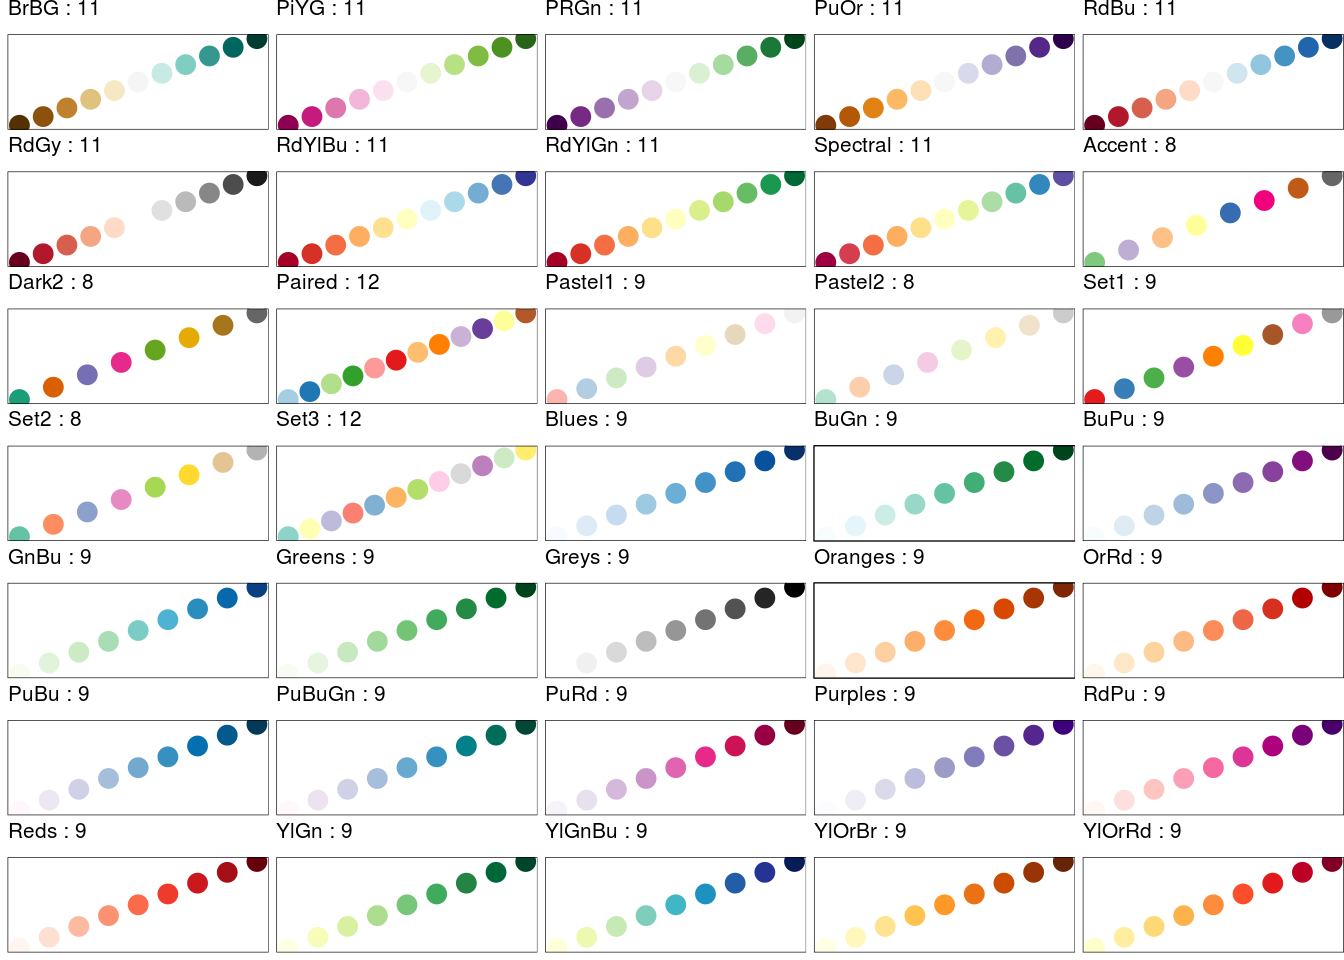
# default color assign from seurat

ggplotColours <- function(n = 6, h = c(0, 360) + 15){
  if ((diff(h) %% 360) < 1) h[2] <- h[2] - 360/n
  hcl(h = (seq(h[1], h[2], length = n)), c = 100, l = 65)
}

color_list <- ggplotColours(n=30)