Chapter 20 Quality Control
library(ArchR)
library(magrittr)
library(tidyverse)
set.seed(1)
20.1 Description
Quality control/statistics plot for scATAC-seq library: TSS enrichment, nFrags, Fragment length distribution
20.2 Set env and load arrow project
## Section: set default para
##################################################
addArchRThreads(threads = 16) # setting default number of parallel threads


## Section: load object
##################################################
proj <- loadArchRProject(path = "data/ArchR/ArrowProject/Merged/")
20.3 Plots
# TSS vs nFrags
df <- getCellColData(proj, select = c("log10(nFrags)", "TSSEnrichment"))
df
## DataFrame with 3000 rows and 2 columns
## log10(nFrags) TSSEnrichment
## <array> <array>
## 84C#ACAGCGCGTAGAAAGG-1 4.08278537031645 8.902
## 68B#TATCTGTTCAGGATCT-1 4.60680040755567 12.5
## 84B#GTTGGGCGTACCAAGG-1 4.17052573312318 4.642
## 84B#GCAGCCAGTAGGGTTG-1 4.50843544327051 8.478
## 68B#CCTGCTAGTGATCAGG-1 3.59911856505536 18.126
## ... ... ...
## 84B#CTGAATGAGGTTACAA-1 4.52650727549542 11.936
## 84B#TCGCAGGAGCTCCGGT-1 4.16893921383598 11.844
## 68B#TGACTCCTCAAGAGAT-1 3.82711068746601 5.967
## 68A#GCCATAAGTCTGGTCG-1 3.63296316816726 18.968
## 84C#TTGCAGACATCCGTAA-1 4.25309558584903 7.259p <- ggPoint(
x = df[, 1],
y = df[, 2],
labelMeans = TRUE,
colorDensity = TRUE,
continuousSet = "sambaNight",
xlabel = "Log10 Unique Fragments",
ylabel = "TSS Enrichment",
xlim = c(log10(500), quantile(df[, 1], probs = 0.99)),
ylim = c(0, quantile(df[, 2], probs = 0.99))
) + geom_hline(yintercept = 4, lty = "dashed") + geom_vline(xintercept = 3, lty = "dashed")
p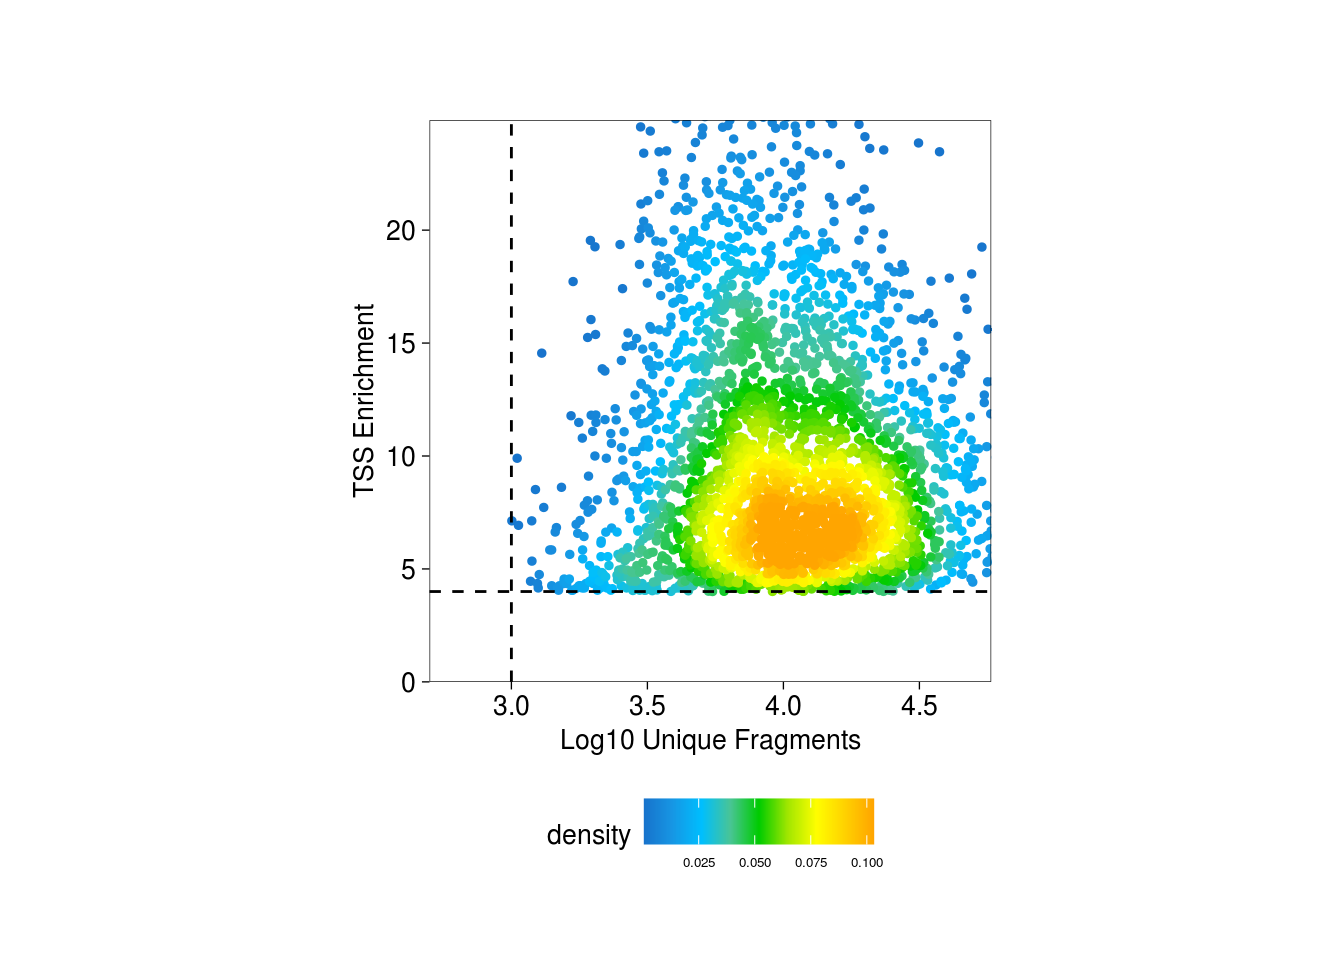
## TSS enrichment scores and nFrags distribution
c("TSSEnrichment", "log10(nFrags)") %>% map(~ {
   plotGroups(
    ArchRProj = proj,
    groupBy = "Sample",
    colorBy = "cellColData",
    name = .x,
    plotAs = "violin",
    alpha = 0.4,
    addBoxPlot = TRUE
  )
})
## 1
## 1## [[1]]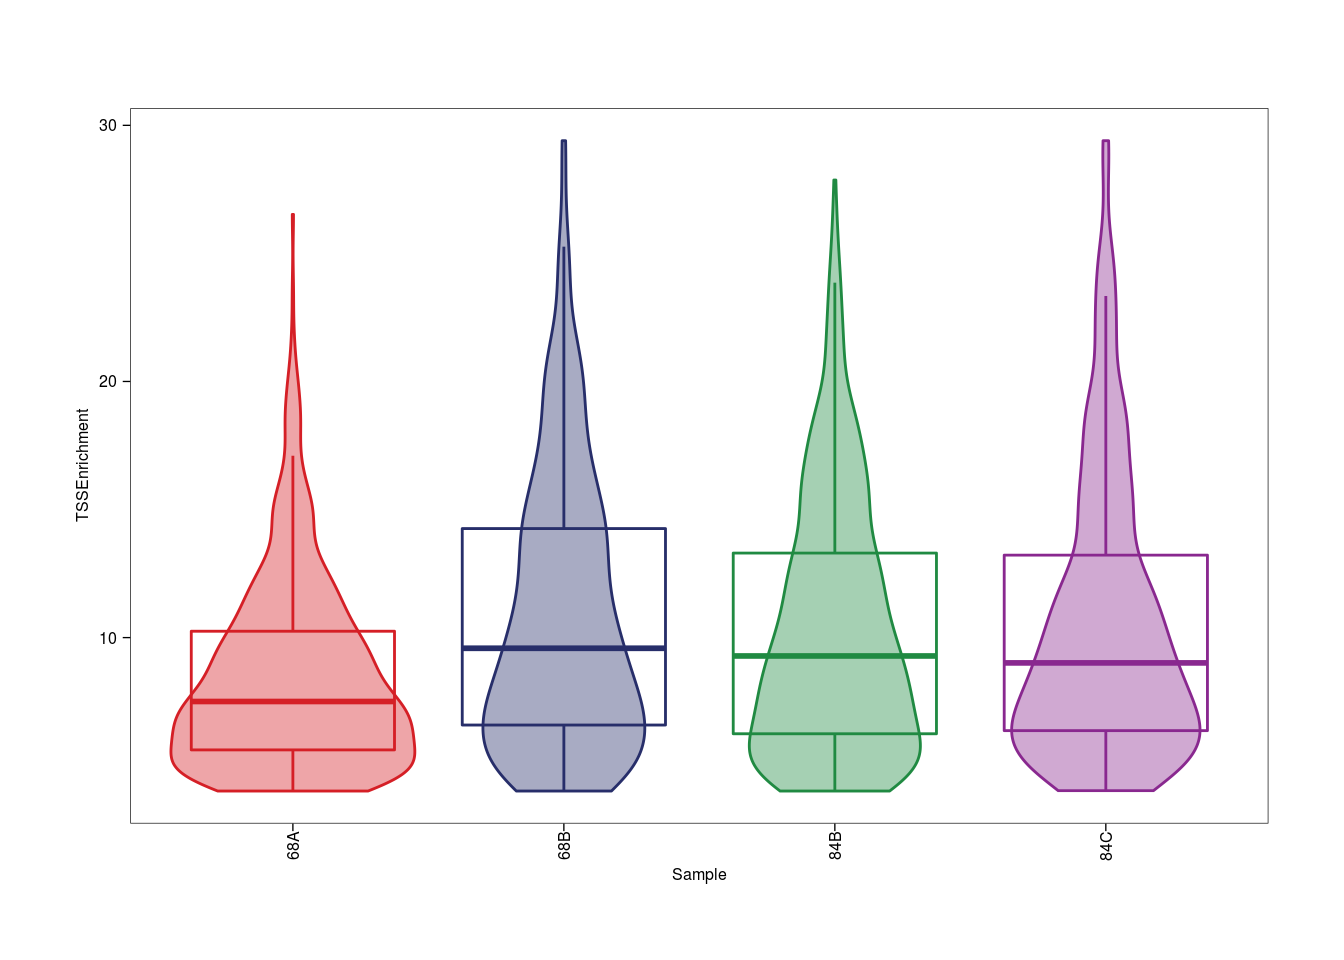
##
## [[2]]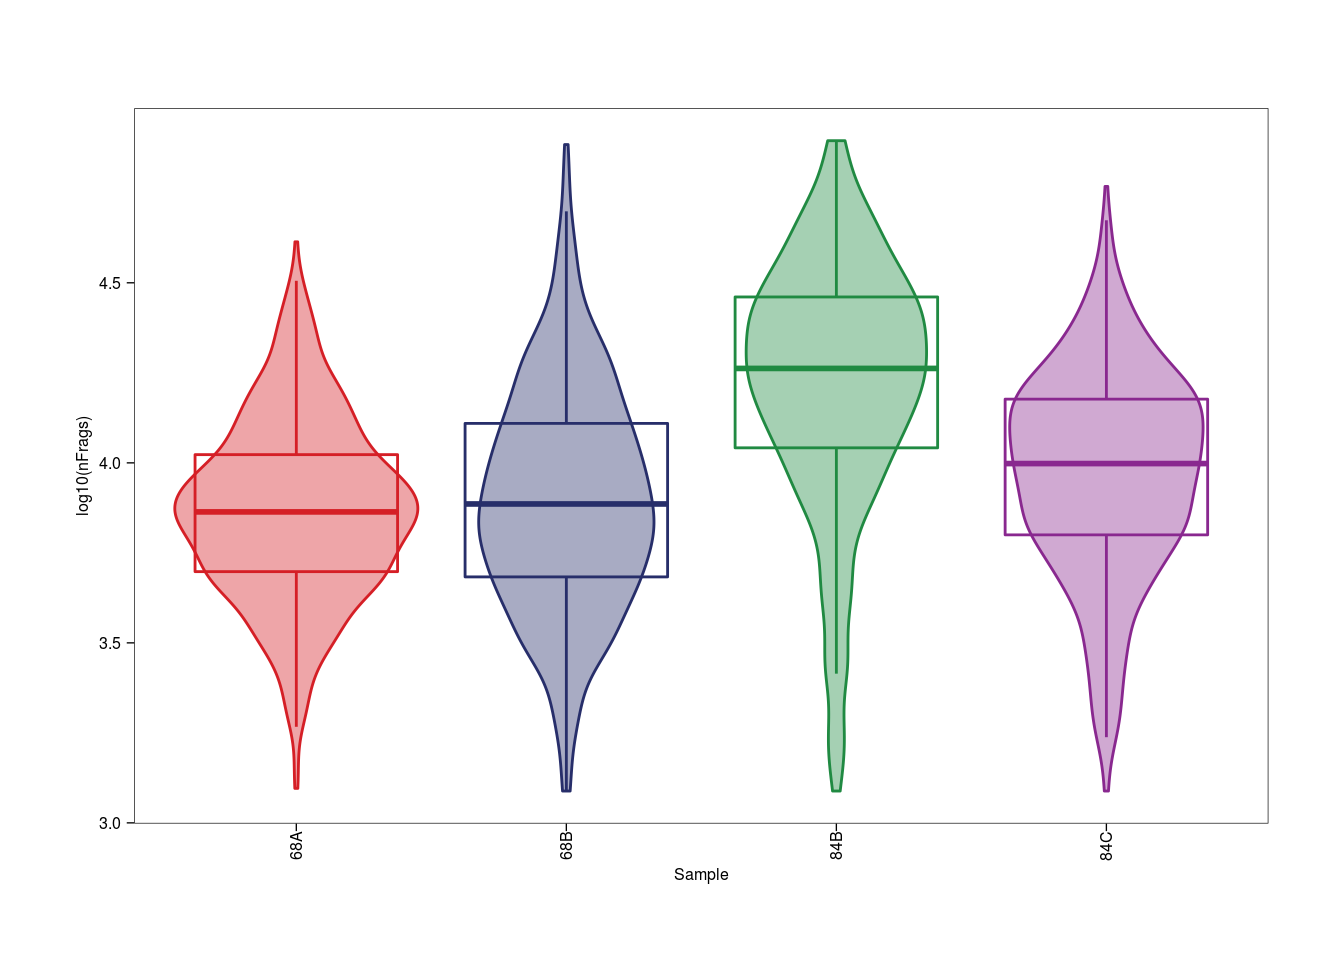
## Fragment size distribution
plotFragmentSizes(ArchRProj = proj)
## ArchR logging to : ArchRLogs/ArchR-plotFragmentSizes-126f515acd78-Date-2021-11-12_Time-14-49-41.log
## If there is an issue, please report to github with logFile!
## ArchR logging successful to : ArchRLogs/ArchR-plotFragmentSizes-126f515acd78-Date-2021-11-12_Time-14-49-41.log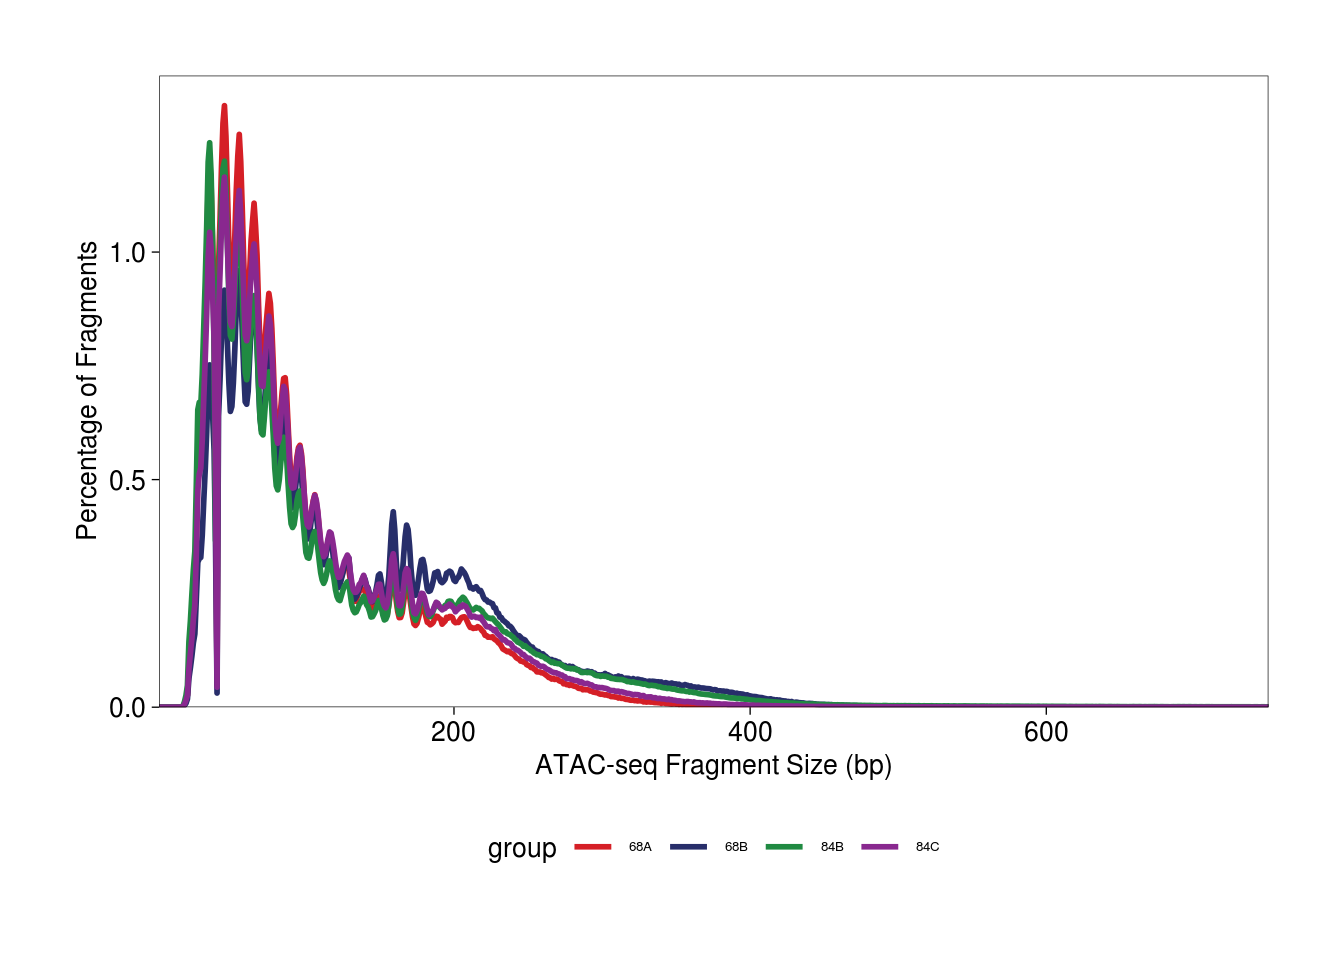
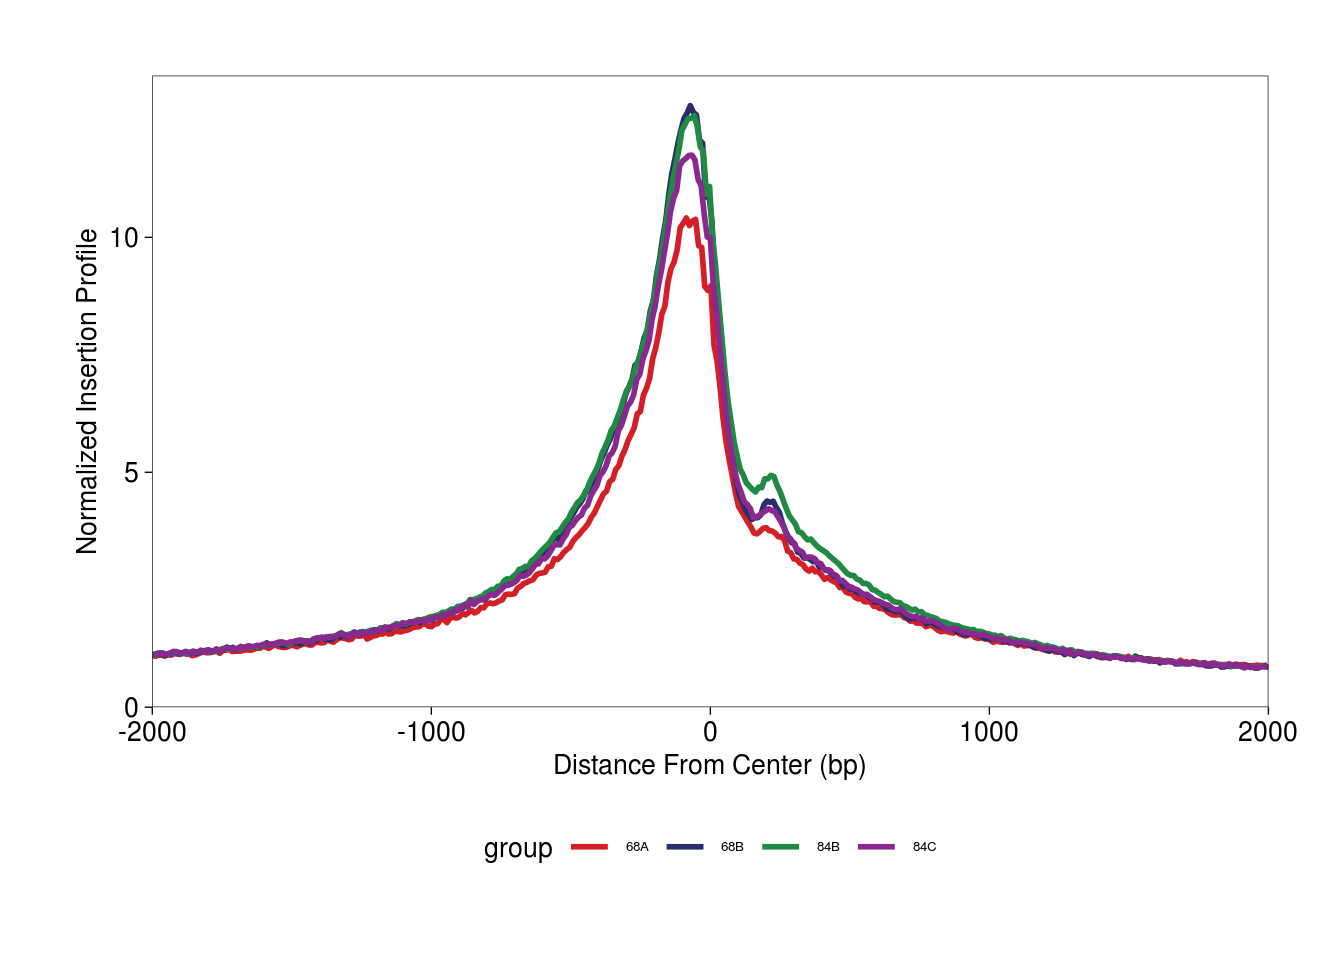
## TSS enrichment profile
plotTSSEnrichment(ArchRProj = proj)
## ArchR logging to : ArchRLogs/ArchR-plotTSSEnrichment-126ff0f9f15-Date-2021-11-12_Time-14-50-59.log
## If there is an issue, please report to github with logFile!
## ArchR logging successful to : ArchRLogs/ArchR-plotTSSEnrichment-126ff0f9f15-Date-2021-11-12_Time-14-50-59.log