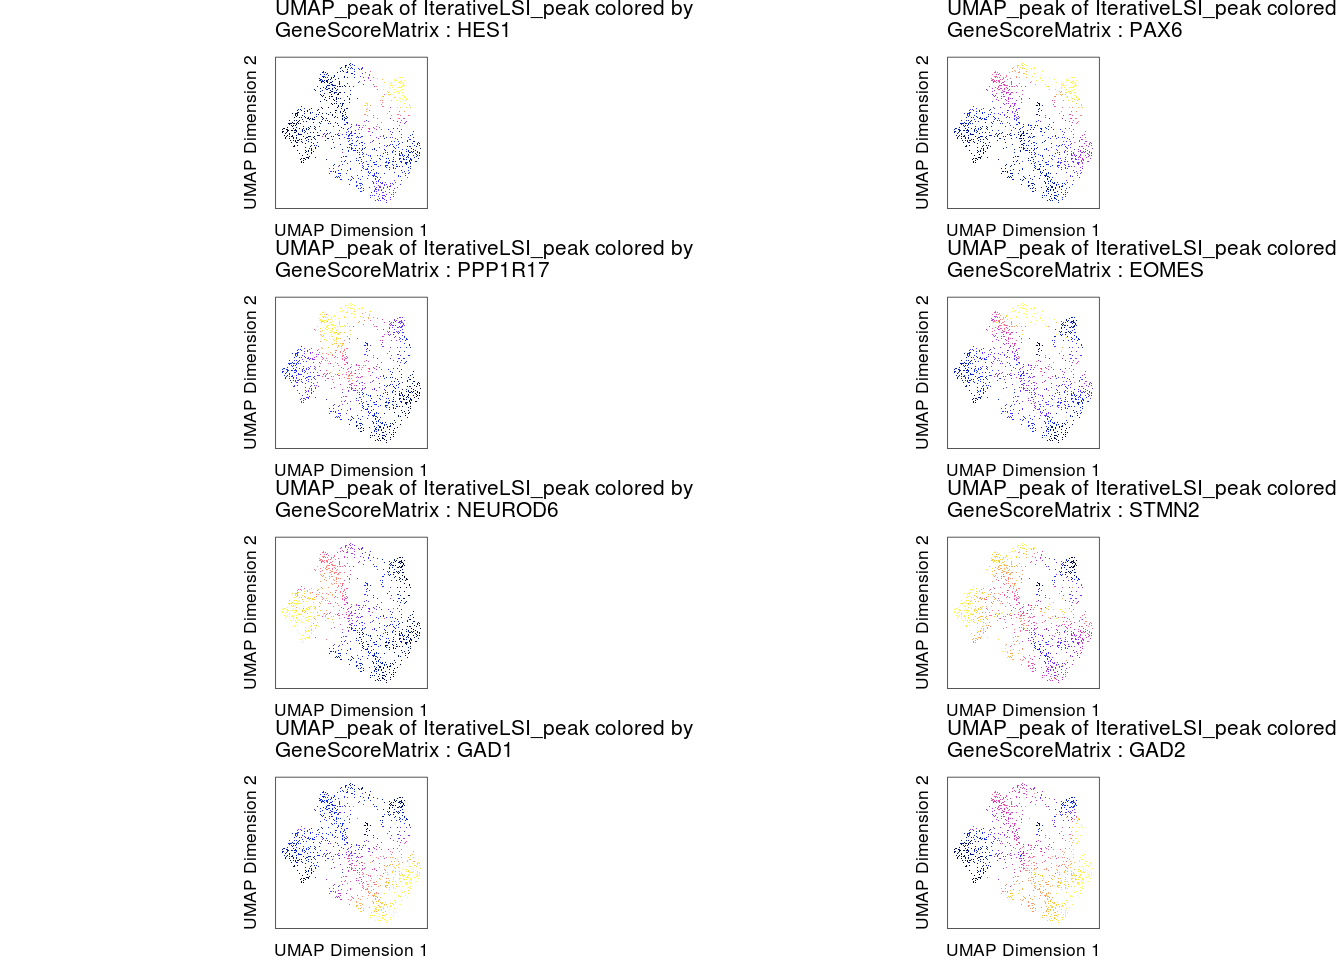
Visualize gene scores
markerGenes <- c("HES1", "PAX6",
                 "PPP1R17", "EOMES",
                 "NEUROD6", "STMN2",
                 "GAD1", "GAD2")

p <- plotEmbedding(
  ArchRProj = proj,
  colorBy = "GeneScoreMatrix",
  name = markerGenes,
  embedding = "UMAP_peak",
  quantCut = c(0.01, 0.95),
  size = 0.5,
  imputeWeights = getImputeWeights(proj)
)
## Getting ImputeWeights
## ArchR logging to : ArchRLogs/ArchR-plotEmbedding-259e7cb04bd7-Date-2021-11-12_Time-14-58-55.log
## If there is an issue, please report to github with logFile!
## Getting UMAP Embedding
## ColorBy = GeneScoreMatrix
## Getting Matrix Values...
## 2021-11-12 14:58:58 :
##
## Imputing Matrix
## Using weights on disk
## 1 of 1
## Plotting Embedding
## 1 2 3 4 5 6 7 8
## ArchR logging successful to : ArchRLogs/ArchR-plotEmbedding-259e7cb04bd7-Date-2021-11-12_Time-14-58-55.log
#Rearrange for grid plotting
p2 <- lapply(p, function(x) {
  x + guides(color = FALSE, fill = FALSE) +
    theme_ArchR(baseSize = 6.5) +
    theme(plot.margin = unit(c(0, 0, 0, 0), "cm")) +
    theme(
      axis.text.x = element_blank(),
      axis.ticks.x = element_blank(),
      axis.text.y = element_blank(),
      axis.ticks.y = element_blank()
    )
})

do.call(cowplot::plot_grid, c(list(ncol = 2),p2))