Chapter 1 QC-PCA-VennDiagram
1.1 Description
- Check the clustering for CTCF ChIP-seq profiles from three primary cells: hepatocyte, myocyte and B cells.
- PCA, heatmap and vennplot
1.2 Load data
all <- get(load("data/RData/Human-MultipleCellTypes-usingMergePekasPerCellType-CTCF-diffBD-minOverlap1-object-D20210112-onlyLiverMTNPC-Bcell.RData"))
ctcf <- dba(all, mask = c(1:2, 5:8))
1.3 PCA
plot(ctcf)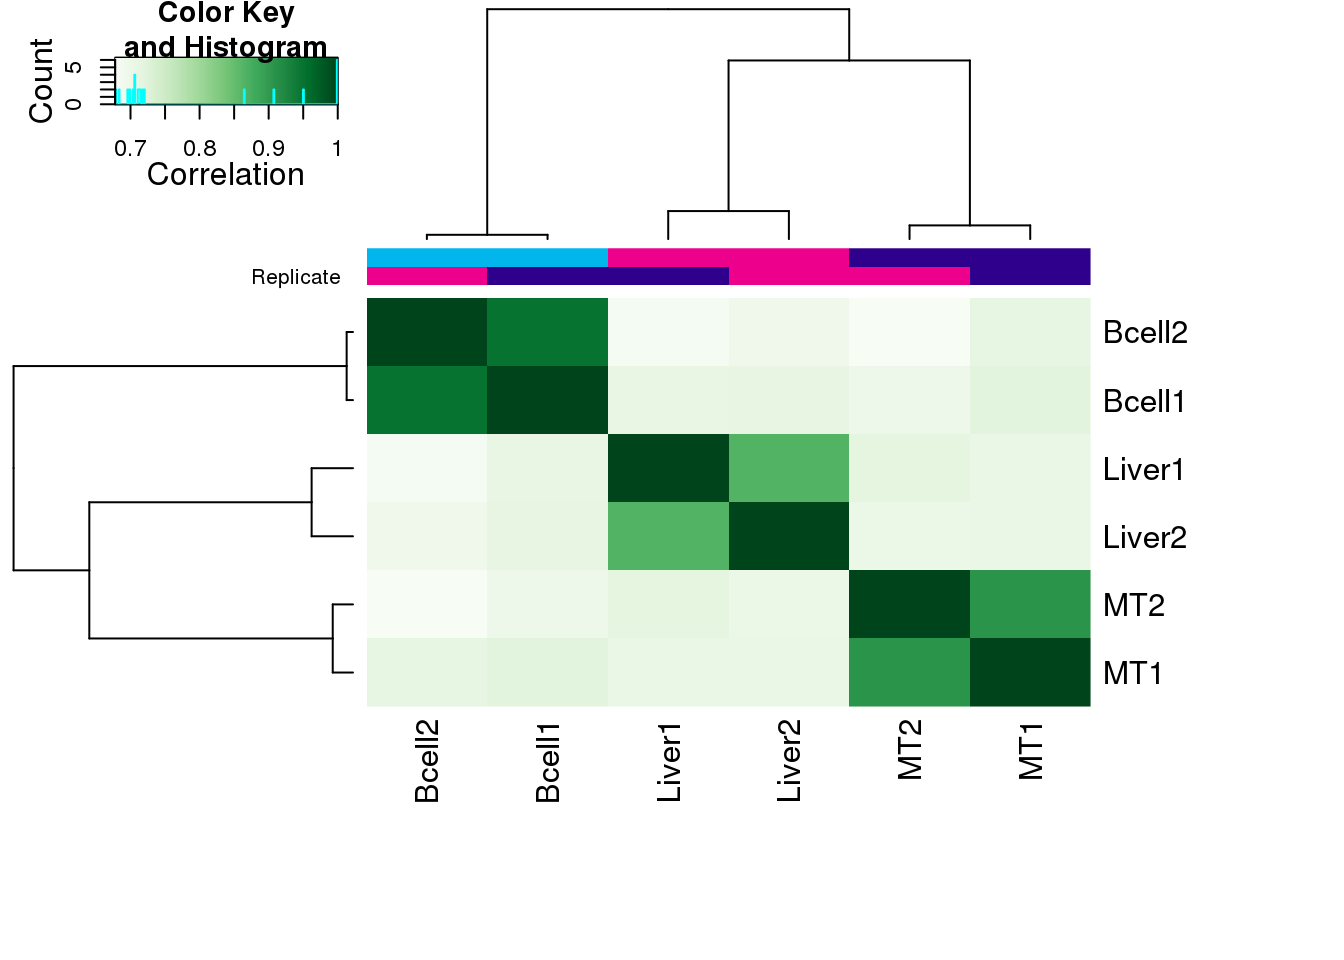
dba.plotPCA(ctcf, attributes = DBA_CONDITION)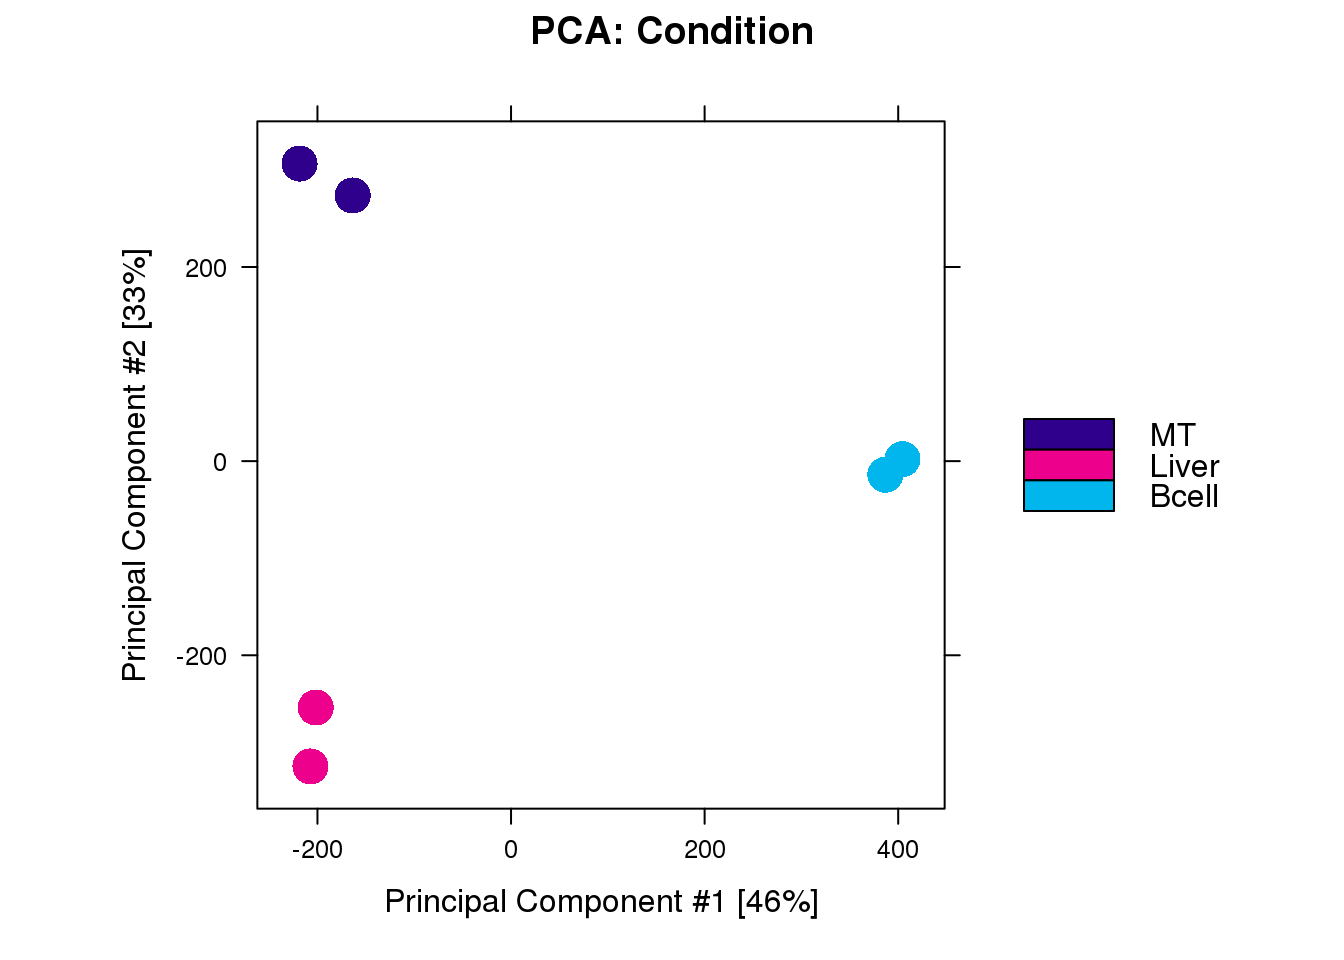
pdf("results/QC/Hep.MT.Bcell.CTCF_DiffBD_PCA_heatmap.pdf", width = 5, height = 5)
plot(ctcf)
dba.plotPCA(ctcf, attributes = DBA_CONDITION)
dev.off()
1.4 Load data
all <- get(load("data/RData/Human-MultipleCellTypes-usingMergePekasPerCellType-CTCF-diffBD-minOverlap1-object-D20210112.RData"))1.5 Venn diagram to show the overlapp between cells
dba.plotVenn(all, c(3, 12, 16))
dba.plotVenn(all, c(4, 13, 17))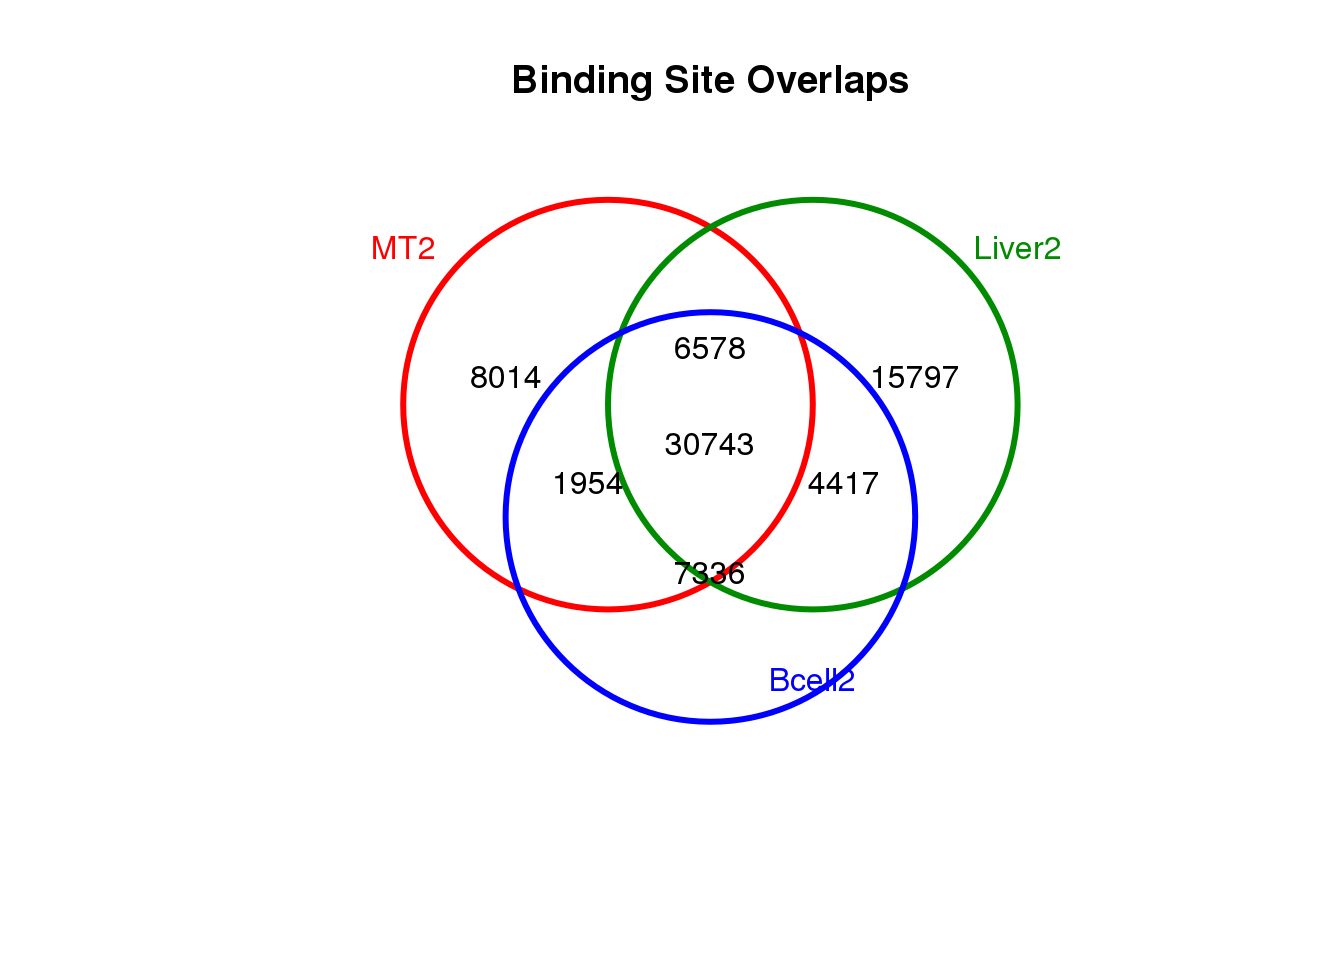
pdf('results/QC/Hep.MT.Bcell.CTCF_DiffBD_peakOverlapVennplot.pdf', width = 4, height = 4)
dba.plotVenn(all, c(3, 12, 16))
dba.plotVenn(all, c(4, 13, 17))
dev.off()