Chapter 16 Assign Epigenetic Attributes to Loops
16.1 Description
Assign attributes to loops based on both anchors, Epi: - E-E E-P P-P P-O E-O O-O CBS: - conserved-CBS-loops: stable-stable stable-other - specific-CBS-loops: specific-specific specific-other
16.2 Load loops and loop anchors
anchor <- fread('data/HiC/loops/GSE82144_Kieffer-Kwon-2017-activated_B_cells_72_hours_WT.hic_5k10kloops.loopanchor.with.epiCBS.onlyGSM3027985diffBDFDR01.state.bed',
                header = T)
loops <- fread('data/HiC/loops/GSE82144_Kieffer-Kwon-2017-activated_B_cells_72_hours_WT.hic_5k10kloops_merged_loops.brief.bedpe', header = F)
loops <- loops[,1:6]
colnames(loops) <- c('chr1','x1','x2','chr2','y1','y2')
loops$idl <- paste0(loops$chr1, ":", loops$x1, "-", loops$x2)
loops$idr <- paste0(loops$chr2, ":", loops$y1, "-", loops$y2)

loops[1:3,]
## chr1 x1 x2 chr2 y1 y2
## 1: chr10 76300000 76305000 chr10 76480000 76485000
## 2: chr10 77740000 77745000 chr10 77850000 77855000
## 3: chr10 116895000 116900000 chr10 117110000 117115000
## idl idr
## 1: chr10:76300000-76305000 chr10:76480000-76485000
## 2: chr10:77740000-77745000 chr10:77850000-77855000
## 3: chr10:116895000-116900000 chr10:117110000-117115000anchor[1:3,]## chr start end id tss enh stable specific
## 1: chr10 76300000 76305000 chr10:76300000-76305000 0 0 0 0
## 2: chr10 77740000 77745000 chr10:77740000-77745000 0 0 1 0
## 3: chr10 116895000 116900000 chr10:116895000-116900000 0 0 0 1
## tf state CBS
## 1: 0 O O
## 2: 0 O Stable
## 3: 0 O Specific16.3 Assign attributes based on anchors
## Section: assign loop anchor state to loops
##################################################
loops$cbsr <- loops$cbsl <- loops$epir <- loops$epil <- 'O'

loci1 <- match(loops$idl, anchor$id)
loops$epil <- anchor$state[loci1]
loops$cbsl <- anchor$CBS[loci1]

loci2 <- match(loops$idr, anchor$id)
loops$epir <- anchor$state[loci2]
loops$cbsr <- anchor$CBS[loci2]
16.4 Loop group based on CBS
## Section: group loops based on CBS
##################################################
stst <- loops[which(loops$cbsl == 'Stable' & loops$cbsr == 'Stable'),]
stnon <- loops[which(loops$cbsl == 'Stable' & loops$cbsr == 'O' | loops$cbsr == 'Stable' & loops$cbsl == 'O'),]
dede <- loops[which(loops$cbsl == 'Specific' & loops$cbsr == 'Specific'),]
denon <- loops[which(loops$cbsl == 'Specific' & loops$cbsr == 'O' | loops$cbsr == 'Specific' & loops$cbsl == 'O'),]
dest <- loops[which(loops$cbsl == 'Stable' & loops$cbsr == 'Specific' | loops$cbsr == 'Stable' & loops$cbsl == 'Specific'),]

st.loop <- rbind(stst, stnon)
de.loop <- rbind(dede, denon)write.table(st.loop, file = 'data/HiC/loops/GSE98119_Vian-2018-activated_B_cells_24_hours_WT.hic_5k10kloops_onlyGSM3027985diffBDFDR01_StStANDStNON_CBS.bedpe',
row.names = F, col.names = T, quote = F, sep = "\t")
write.table(de.loop, file = 'data/HiC/loops/GSE98119_Vian-2018-activated_B_cells_24_hours_WT.hic_5k10kloops_onlyGSM3027985diffBDFDR01_SpeSpeANDSpeNON_CBS.bedpe',
row.names = F, col.names = T, quote = F, sep = "\t")16.5 Loop group based on Epi
## Section: statistics for E/P type
##################################################
st.state <- paste0(st.loop$epil, st.loop$epir)
st.state <- mgsub::mgsub(st.state, c('OE', "OP", 'PE'), c("EO", "PO", 'EP'))
de.state <- paste0(de.loop$epil, de.loop$epir)
de.state <- mgsub::mgsub(de.state, c('OE', "OP", 'PE'), c("EO", "PO", 'EP'))

f1 <- table(st.state)/length(st.state)*100
f2 <- table(de.state)/length(de.state)*100

## Section: plots
##################################################
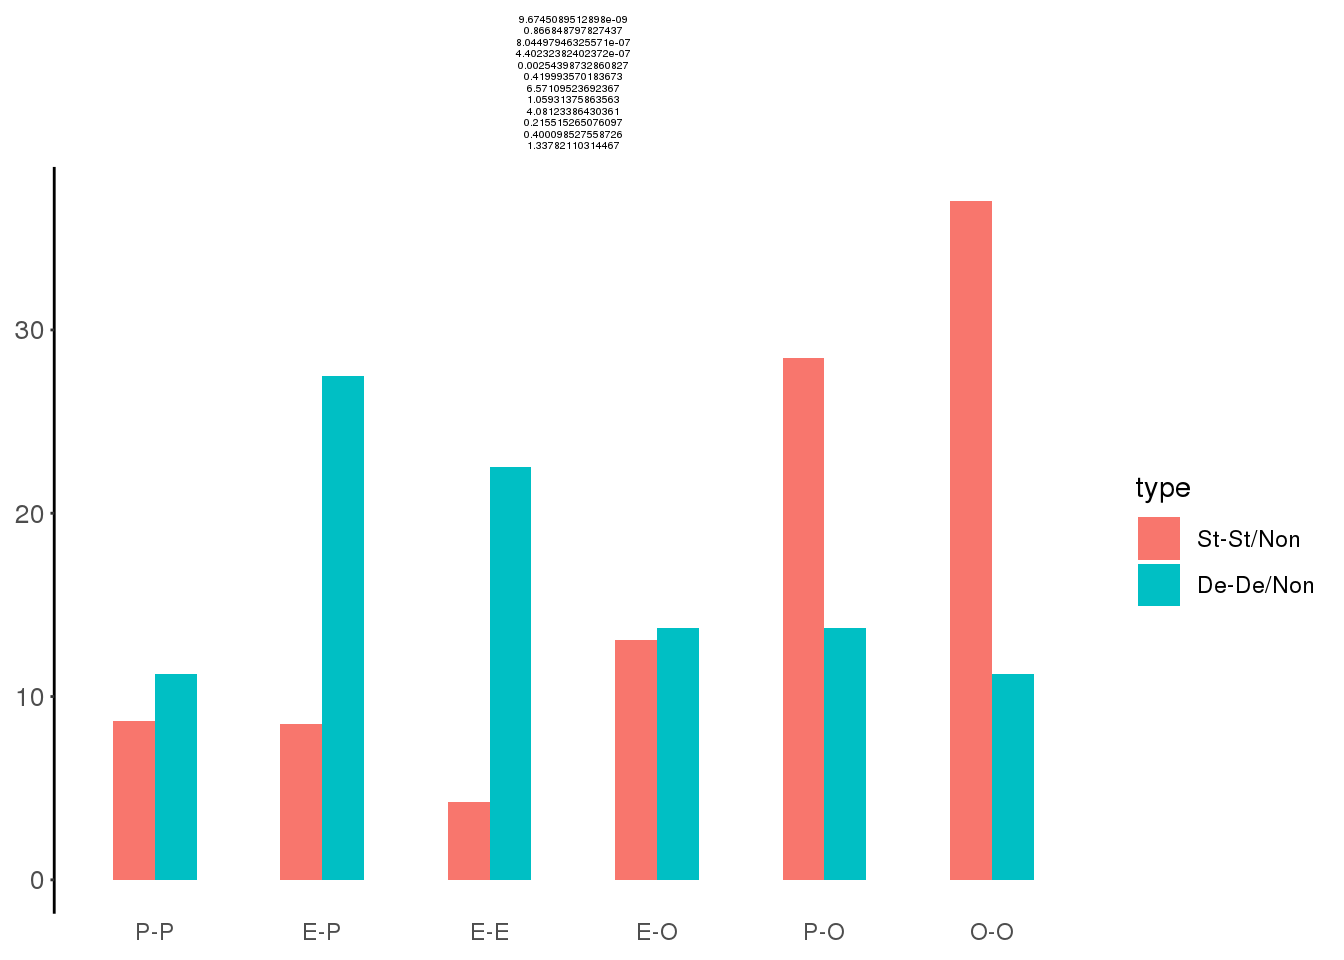
df <- data.frame(type = c(rep('St-St/Non',6), rep('De-De/Non',6)),
                 class = rep(c('E-E','E-O','E-P','O-O','P-O','P-P'),2),
                 value = c(f1,f2))
df$type = factor(df$type, levels = c('St-St/Non', 'De-De/Non'))
df$class <- factor(df$class, levels = c('P-P','E-P','E-E','E-O','P-O','O-O'))
df
## type class value
## 1 St-St/Non E-E 4.228144
## 2 St-St/Non E-O 13.080819
## 3 St-St/Non E-P 8.500330
## 4 St-St/Non O-O 37.040299
## 5 St-St/Non P-O 28.495926
## 6 St-St/Non P-P 8.654481
## 7 De-De/Non E-E 22.500000
## 8 De-De/Non E-O 13.750000
## 9 De-De/Non E-P 27.500000
## 10 De-De/Non O-O 11.250000
## 11 De-De/Non P-O 13.750000
## 12 De-De/Non P-P 11.25000016.6 Fisher test
## Section: fisher test
##################################################
na <- nrow(st.loop)
nb <- nrow(de.loop)

a.ls <- df$value[which(df$type == 'St-St/Non')]*na/100
b.ls <- df$value[which(df$type == 'De-De/Non')]*nb/100

getP <- function(a,b){
  Convictions <- matrix(c(b,a, (nb-b), (na-a)), nrow = 2,
                        dimnames = list(c("Dizygotic", "Monozygotic"),
                                        c("Convicted", "Not convicted")))
  re1 <- fisher.test(Convictions)

  return(re1$p.value)
}

getO <- function(a,b){
  Convictions <- matrix(c(b,a, (nb-b), (na-a)), nrow = 2,
                        dimnames = list(c("Dizygotic", "Monozygotic"),
                                        c("Convicted", "Not convicted")))
  re1 <- fisher.test(Convictions)

  return(re1$estimate)
}

p.ls <- mapply(getP, a.ls, b.ls)
o.ls <- mapply(getO, a.ls, b.ls)
p.ls
## [1] 9.674509e-09 8.668488e-01 8.044979e-07 4.402324e-07 2.543987e-03
## [6] 4.199936e-01o.ls## odds ratio odds ratio odds ratio odds ratio odds ratio odds ratio
## 6.5710952 1.0593138 4.0812339 0.2155153 0.4000985 1.337821116.7 Plot
## Section: frequency barplot
##################################################
fontsize = 10
linesize = .5

ggplot(df, aes(x = class, y = value)) +
  geom_bar(aes(fill = type), stat = "identity", width = 0.5,position = "dodge") +
  ggtitle(paste(c(p.ls, o.ls), collapse = "\n"))+
  theme_bw() +
  theme(panel.grid.major = element_blank(),panel.grid.minor = element_blank(),strip.background = element_blank(),panel.border = element_blank())+
  theme(axis.text.y = element_text(size = fontsize),
        axis.title.x = element_blank(),axis.title.y = element_blank(),
        axis.line.x = element_blank(),axis.ticks.x=element_blank(),
        axis.line.y = element_line(colour = "black", size = linesize),
        axis.ticks.y = element_line(size = linesize),
        axis.ticks.length = unit(.05, "cm"),
        plot.title = element_text(size=4, hjust = 0.5))