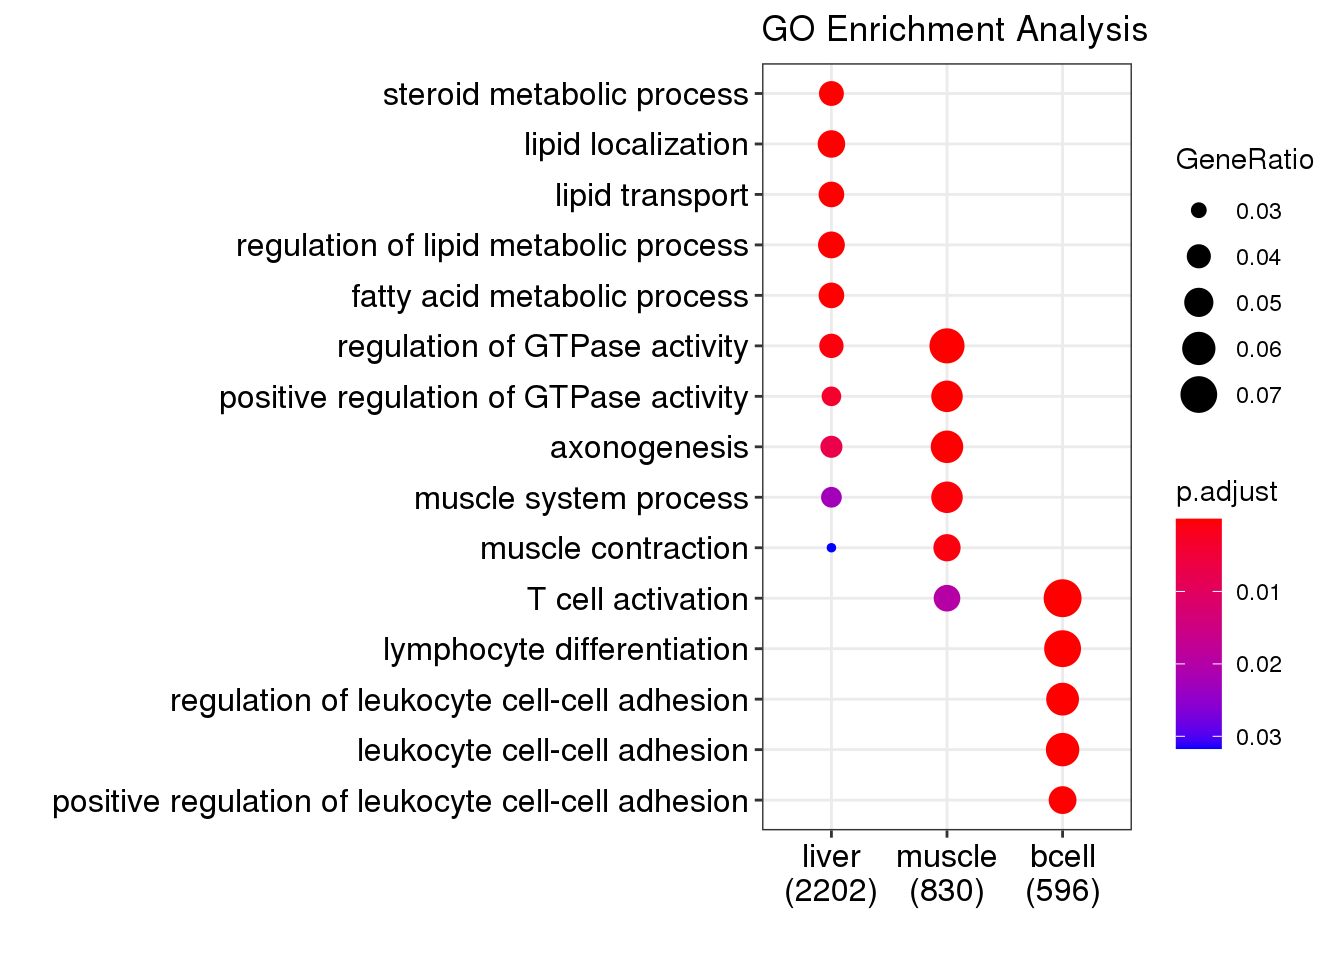
Chapter 9 diffBD nearest gene GO enrichment
9.1 Description
Go enrichment using clusterProfiler for nearest genes around lineag-specific CBSs
9.2 Load peak
## Section: load peaks
##################################################
file.ls <-
  list.files('data/DiffBD/', full.names = T, pattern = "bed")
peaks <- list(#stable = file.ls[5],
  liver = file.ls[2],
  muscle = file.ls[3],
  bcell = file.ls[1])
9.3 Find genes
## Section:  annotate
##################################################
#txdb <- TxDb.Mmusculus.UCSC.mm9.knownGene
txdb = TxDb.Hsapiens.UCSC.hg19.knownGene
promoter <-
  getPromoters(TxDb = txdb,
               upstream = 2000,
               downstream = 2000)
peakAnnoList <- lapply(
  peaks,
  annotatePeak,
  TxDb = txdb,
  tssRegion = c(-3000, 3000),
  verbose = FALSE
)


## Section: find genes
##################################################
genes <- lapply(peakAnnoList, function(i) as.data.frame(i)$geneId)
names(genes) = sub("_", "\n", names(genes))
9.4 GO enrichment cluster
## Section: cluster enrichment
##################################################
compGO <- compareCluster(
  geneCluster   = genes,
  fun           = "enrichGO",
  pvalueCutoff  = 0.05,
  pAdjustMethod = "BH",
  OrgDb = org.Hs.eg.db,
  ont = 'BP'
)
9.5 GO enrichment per gene set
## Section: go enrichment
##################################################
go.ls <- genes %>% map( ~ {
  res <-
    enrichGO(
      gene = .x,
      ont = 'BP',
      OrgDb = org.Hs.eg.db,
      pvalueCutoff = 0.05,
      pAdjustMethod = 'BH'
    )
  return(res)
})
9.6 GO enrichment cluster barplot
g1 <- dotplot(compGO, showCategory = 5, title = "GO Enrichment Analysis")
g1
9.7 GO enrichment per set barplot
## Section: go term barplot
##################################################

barplotTerm <- function(object,
                        x = "Count",
                        color = 'p.adjust',
                        showCategory = 8,
                        font.size = 12,
                        title = "") {
  ## use *height* to satisy barplot generic definition
  ## actually here is an enrichResult object.
  colorBy <- color

  df <- fortify(object, showCategory = showCategory, by = x)
  df$p.adjust <- -log10(df$p.adjust)
  #df <- df[c(1:3,9:12,15,16),]
  if (colorBy %in% colnames(df)) {
    p <-
      ggplot(df, aes_string(x = x, y = "Description", fill = colorBy)) +
      theme_dose(font.size) +
      scale_fill_continuous(
        low = "red",
        high = "blue",
        name = color,
        guide = guide_colorbar(reverse = TRUE)
      )
  } else {
    p <- ggplot(df, aes_string(x = x, y = "Description")) +
      theme_dose(font.size) +
      theme(legend.position = "none")
  }


  p + geom_col(fill = color) + ggtitle(title) + xlab('-log10 FDR') + ylab(NULL)
}
bp.ls2 <- go.ls %>% imap(~ {
  barplotTerm(
    .x,
    x = 'p.adjust',
    color = 'blue',
    showCategory = 10,
    font.size = 4,
    title = .y
  )
})

do.call(cowplot::plot_grid, c(list(ncol = 3), bp.ls2))
9.8 Save plots
ggsave("results/Genes/N9-Hep.Myo.Bcell-specificCBS-nearestgenes-function-goterm-dotplot.pdf", plot = g1,
       width = 7.5, height = 5)

pdf('results/Genes/N9-Hep.Myo.Bcell-specificCBS-nearestgenes-function-goterm-barplot.pdf', width = 3*3, height = 3)
do.call(cowplot::plot_grid, c(list(ncol = 3), bp.ls2))
dev.off()