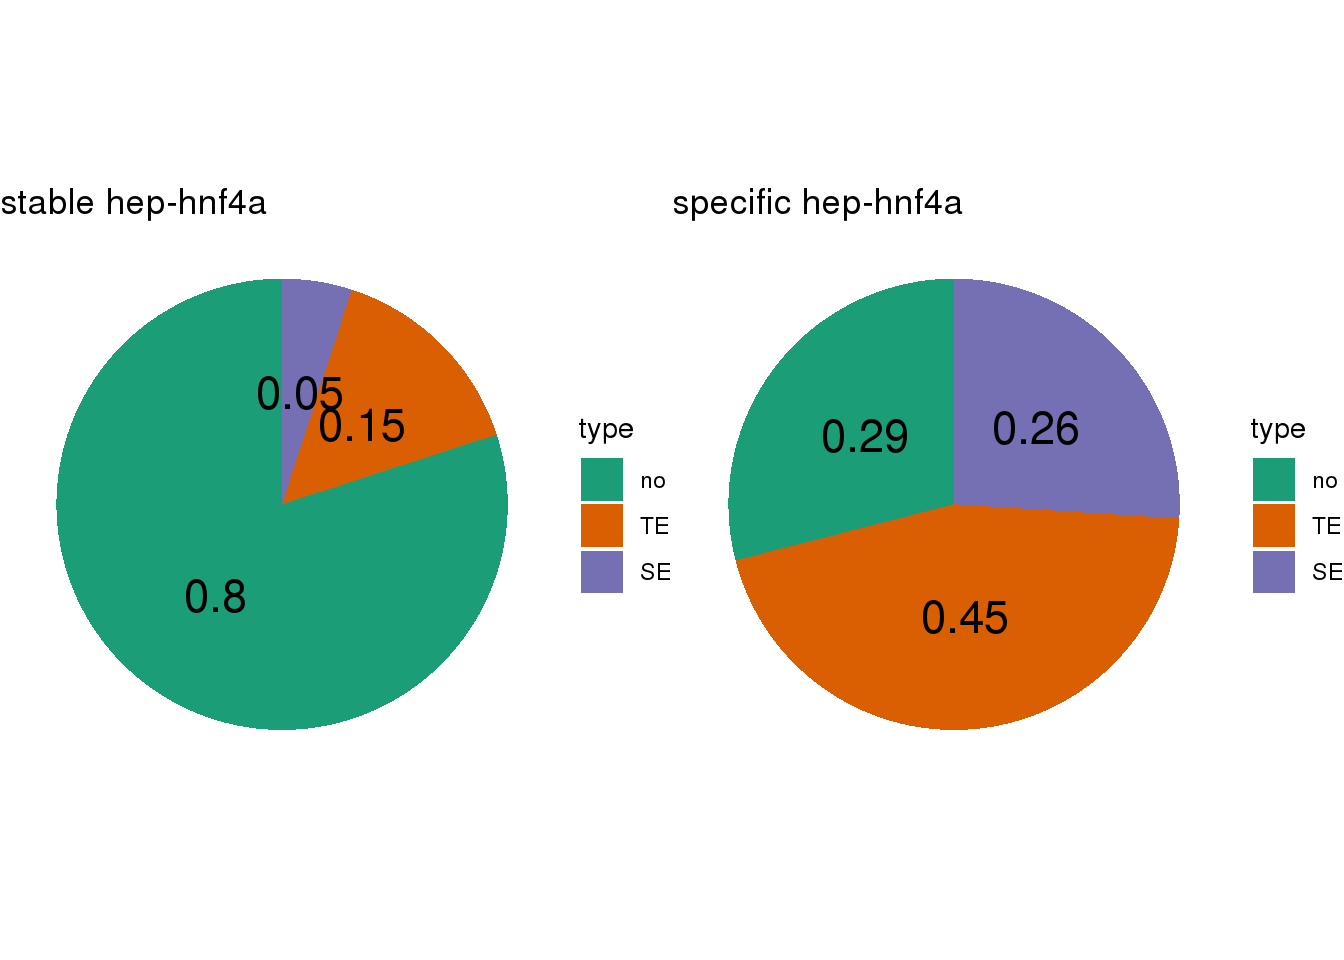
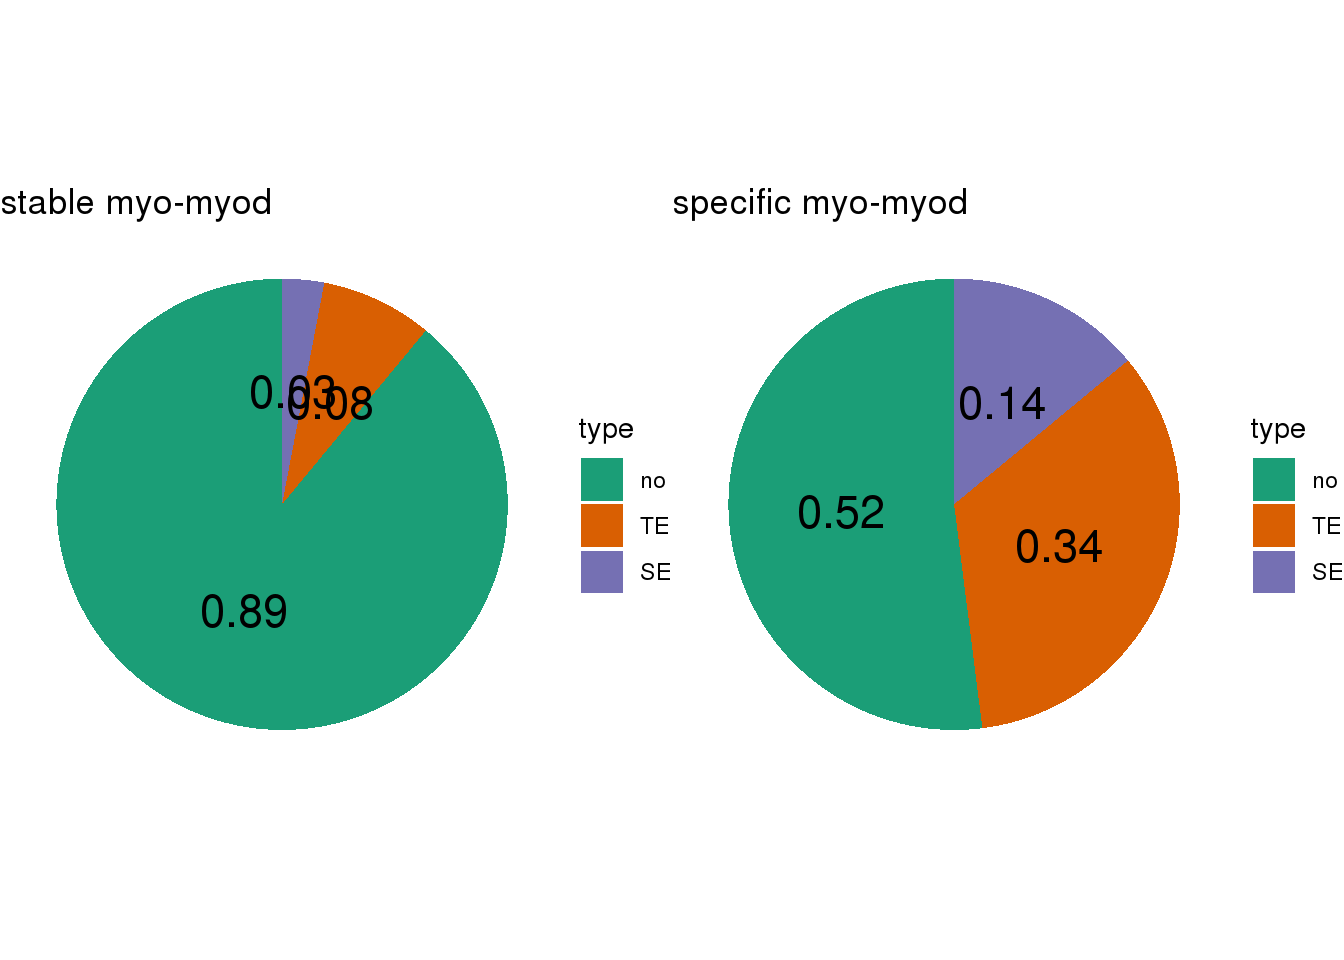
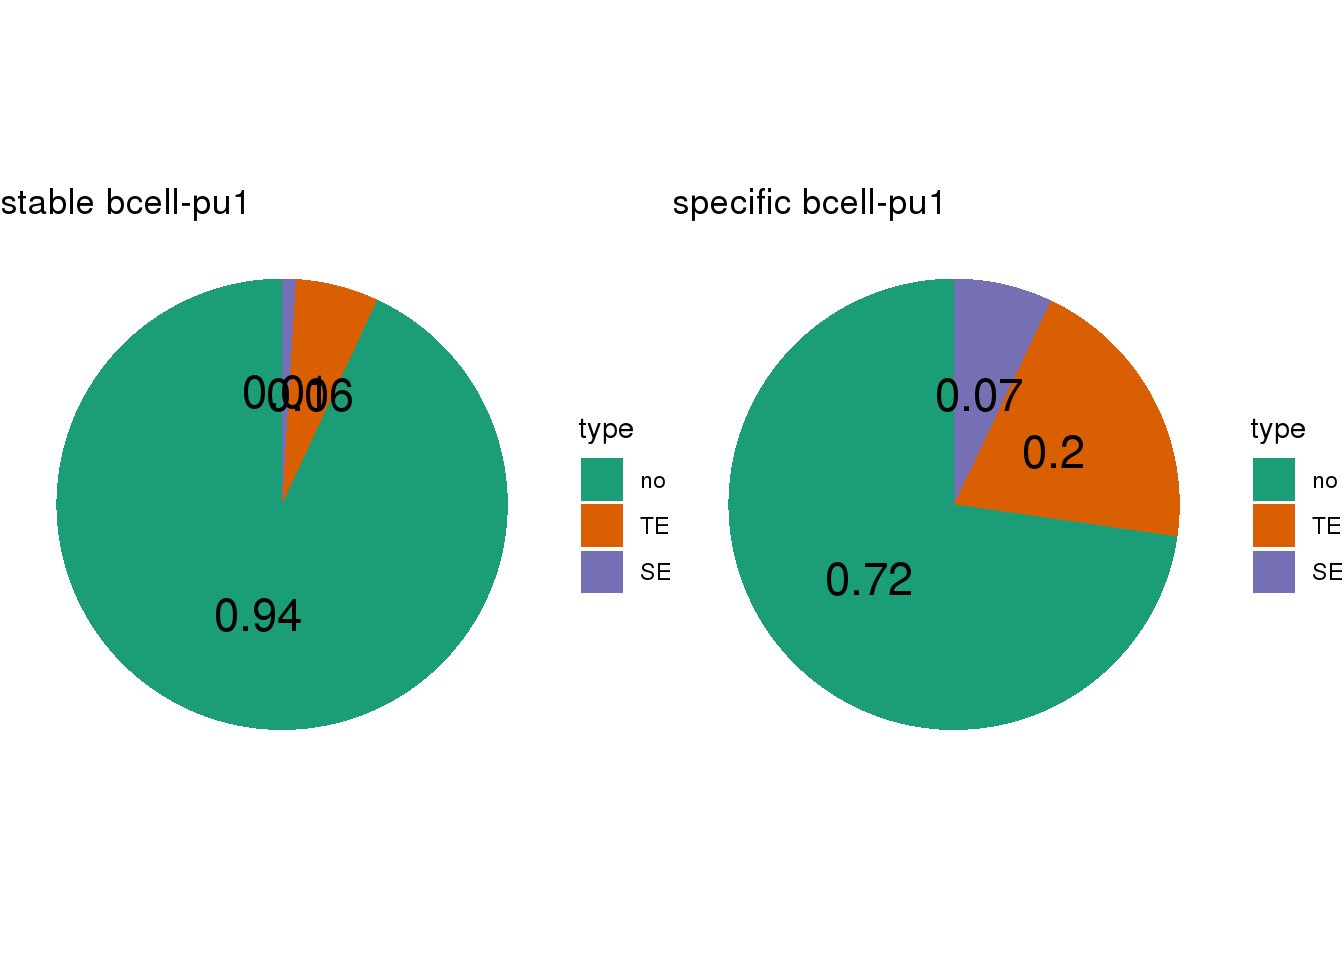
Chapter 4 diffBD enhancer containing ratio piechart
4.1 Description
- Calculate the TE/SE-containing percentage for lineage-stable/specific CBS
- SEs are called by
roseusing H3K27ac and TF ChIP-seq profiles
4.2 Loda data
cbs.ls <- list.files('data/DiffBD/', full.names = T)
enh.ls <- list.files("data/peakfiles/Enhancer-groupby-CBS/AllEnh-table/", full.names = T)
cbs.ls
## [1] "data/DiffBD//human-BcellVSAllotherWithoutNeutrophilANDmonocyteE-CTCF.diffBD.minOverlap1.log2FC1FDR005.upinBcell.D210112-Alltissues.bed"
## [2] "data/DiffBD//human-LiverVSAllother-CTCF.diffBD.minOverlap1.log2FC1FDR0001.upinLiver.D210112-Alltissues.bed"
## [3] "data/DiffBD//human-MTVSAllotherWithouMB-CTCF.diffBD.minOverlap1.log2FC1FDR001.upinMT.D210112-Alltissues.bed"
## [4] "data/DiffBD//liver.npc.mt.macrophage.mb.lungfibroblast.spleen.netrophil"
## [5] "data/DiffBD//liver.npc.mt.macrophage.mb.lungfibroblast.spleen.netrophil.center200bp.bed"
## [6] "data/DiffBD//liver.npc.mt.macrophage.mb.lungfibroblast.spleen.netrophil.center400bp.bed"enh.ls## [1] "data/peakfiles/Enhancer-groupby-CBS/AllEnh-table//ENCSR000AUP-human-Bcell-H3K27ac_AllEnhancers.table.txt"
## [2] "data/peakfiles/Enhancer-groupby-CBS/AllEnh-table//ENCSR601OGE-human-liver-HNF4A-treat_AllEnhancers.table.txt"
## [3] "data/peakfiles/Enhancer-groupby-CBS/AllEnh-table//ENCSR981UJA-human-rightlobeLiver-tissue-H3K27ac_AllEnhancers.table.txt"
## [4] "data/peakfiles/Enhancer-groupby-CBS/AllEnh-table//GSE50413-MYOD-human-MT-treat-Rep2_1_AllEnhancers.table.txt"
## [5] "data/peakfiles/Enhancer-groupby-CBS/AllEnh-table//GSM3686918_PU1_human_primaryBcell-treat_AllEnhancers.table.txt"
## [6] "data/peakfiles/Enhancer-groupby-CBS/AllEnh-table//GSM733666-H3K27ac-human-MB-treat_AllEnhancers.table.txt"
## [7] "data/peakfiles/Enhancer-groupby-CBS/AllEnh-table//GSM733666-H3K27ac-human-MT-treat_AllEnhancers.table.txt"4.3 Define function: calculate overlap
getVP <- function(stable.f, specific.f, enh.f, cell){

  enh <- fread(enh.f, header = T)

  ## Section: get the CTCF and SE regions in GR format
  ##################################################
  getGR <- function(f){
    mat <- fread(f, header = F)
    mat <- mat[,1:3]
    colnames(mat) <- c('chr', 'start', 'end')
    bed <- makeGRangesFromDataFrame(mat)
    return(bed)
  }

  stable.gr <- getGR(stable.f)
  specific.gr <- getGR(specific.f)
  se.gr <- enh[which(enh$isSuper == 1), c(2:4,1)]
  se.gr <- makeGRangesFromDataFrame(se.gr, keep.extra.columns = T)
  te.gr <- enh[which(enh$isSuper == 0), c(2:4,1)]
  te.gr <- makeGRangesFromDataFrame(te.gr, keep.extra.columns = T)

  ## Section: group the CBS based on enhancer type
  ##################################################
  getEnh <- function(gr){
    comm1 <- findOverlaps(gr, se.gr)
    comm2 <- findOverlaps(gr, te.gr)
    n1 <- length(unique(queryHits(comm1)))
    n2 <- length(unique(queryHits(comm2)))
    n <- length(gr) - n1 -n2
    return(c(n,n2,n1))
  }

  stable.freq <- getEnh(stable.gr)
  specific.freq <- getEnh(specific.gr)

  df <- data.frame(cbind(region = rep(c('stable', 'specific'), each = 3),
                         type = rep(c('no','TE','SE'),2),
                         value = c(stable.freq, specific.freq)))
  df$region <- factor(df$region, levels = c('stable', 'specific'))
  df$type <- factor(df$type, levels = c('no','TE', 'SE'))
  df$value <- as.numeric(as.character(df$value))


  ## Section: pie chart plots
  ##################################################
  gp.ls <- list()
  for (i in 1:2) {

    df1 <- df[which(df$region == unique(df$region)[i]),]
    # Compute the position of labels
    data <- df1 %>%
      arrange(desc(type)) %>%
      mutate(prop = round(value / sum(df1$value) ,2)) %>%
      mutate(ypos = cumsum(prop)- 0.5*prop )

    g <- ggplot(data, aes(x = "", y = prop, fill = type)) +
      geom_bar(stat="identity", width=1)+
      coord_polar("y", start=0) +
      theme_void()+
      geom_text(aes(y = ypos, label = prop), size=6) +
      scale_fill_brewer(palette = "Dark2")+
      #  scale_fill_manual(values = c('with' = 'darkgoldenrod2', 'without' = 'azure3')) +
      ggtitle(str_c(unique(df$region)[i], " ",cell))

    gp.ls[[i]] <- g
  }

  return(gp.ls)

}
4.4 Plot
para.ls <- list(stable = rep(cbs.ls[6], 6),
                specific = rep(c(cbs.ls[2], cbs.ls[3], cbs.ls[1]), 2),
                enh = c(enh.ls[3], enh.ls[7], enh.ls[1], enh.ls[2], enh.ls[4], enh.ls[5]),
                cell = c("hep-k27ac", "myo-k27ac", "bcell-k27ac", "hep-hnf4a", "myo-myod", "bcell-pu1" ))

gp.ls <- pmap(para.ls, getVP)

gp.ls %>% map(~ {
  grid.arrange(.x[[1]], .x[[2]], ncol = 2)
})


## [[1]]
## TableGrob (1 x 2) "arrange": 2 grobs
##   z     cells    name           grob
## 1 1 (1-1,1-1) arrange gtable[layout]
## 2 2 (1-1,2-2) arrange gtable[layout]
##
## [[2]]
## TableGrob (1 x 2) "arrange": 2 grobs
##   z     cells    name           grob
## 1 1 (1-1,1-1) arrange gtable[layout]
## 2 2 (1-1,2-2) arrange gtable[layout]
##
## [[3]]
## TableGrob (1 x 2) "arrange": 2 grobs
##   z     cells    name           grob
## 1 1 (1-1,1-1) arrange gtable[layout]
## 2 2 (1-1,2-2) arrange gtable[layout]
##
## [[4]]
## TableGrob (1 x 2) "arrange": 2 grobs
##   z     cells    name           grob
## 1 1 (1-1,1-1) arrange gtable[layout]
## 2 2 (1-1,2-2) arrange gtable[layout]
##
## [[5]]
## TableGrob (1 x 2) "arrange": 2 grobs
##   z     cells    name           grob
## 1 1 (1-1,1-1) arrange gtable[layout]
## 2 2 (1-1,2-2) arrange gtable[layout]
##
## [[6]]
## TableGrob (1 x 2) "arrange": 2 grobs
##   z     cells    name           grob
## 1 1 (1-1,1-1) arrange gtable[layout]
## 2 2 (1-1,2-2) arrange gtable[layout]pdf('results/Features/N4-Hep.Myo.Bcell-specificANDstable-CTCF_EnhancerContainingRatio_pichartplot.pdf', width = 6, height = 3)
gp.ls %>% map(~ {
grid.arrange(.x[[1]], .x[[2]], ncol = 2)
})
dev.off()