Chapter 5 CBS-containing ratio for all enhancers and SEs
5.1 Description
Calculate the CBS-containing ratio for all enhancers and SEs per cells
5.2 Load peak regions
getGR <- function(f){
  mat <- fread(f)
  mat <- mat[,1:3]
  names(mat) <- c('chr', 'start', 'end')
  gr <- makeGRangesFromDataFrame(mat)
  return(gr)
}

all.ls <- list.files('data/peakfiles/Enhancer-groupby-CBS/AllEnh/', full.names = T, recursive = T)
se.ls <- list.files('data/peakfiles/Enhancer-groupby-CBS/SE/', full.names = T, recursive = T)
f.ls1 <- c(all.ls[2], se.ls[3], all.ls[3], se.ls[4], all.ls[1], se.ls[1])
f.ls2 <- list.files('data/DiffBD/', full.names = T, recursive = T)
f.ls2 <- f.ls2[c(2,3,1)]

enh.ls <- f.ls1 %>% map(getGR)
cbs.ls <- f.ls2 %>% map(getGR)
cbs.ls <- list(cbs.ls[[1]], cbs.ls[[1]], cbs.ls[[2]], cbs.ls[[2]], cbs.ls[[3]], cbs.ls[[3]])

names(enh.ls) <- c("hep-all", "hep-se", "myo-all", "myo-se", "bcell-all", "bcell-se")
5.3 Calculate overlap
## Section: get overlap
##################################################
getOvp <- function(a, b){
  comm <- findOverlaps(a, b)
  n1 <- length(unique(queryHits(comm)))
  n2 <- length(a)
  return(c(n1, n2))
}


freq.df <- as.data.table(t(map2_dfc(enh.ls, cbs.ls, getOvp)))
colnames(freq.df) <- c("overlap", "total")
freq.df[, ratio := overlap/total*100]
5.4 Fisher test
## Section: Fisher test
##################################################
getP <- function(vec){
  vec <- unlist(vec)
  a1 <- vec[1]
  b1 <- vec[2]
  a <- vec[3]
  b <- vec[4]
  Convictions <- matrix(c(a1, b1, (a-a1), (b-b1)), nrow = 2,
                        dimnames =
                          list(c("Dizygotic", "Monozygotic"),
                               c("Convicted", "Not convicted")))
  res <- fisher.test(Convictions)
  return(c(res$p.value))
}

mat <- matrix(c(1984, 450, 84459, 1551,
                689, 158, 71164, 1465,
                302, 143, 31138, 1384), nrow = 3, byrow = T)
p.ls <- apply(mat, 1, getP)
5.5 Bar Plot
## Section: plot the percentage
##################################################
df <- data.frame(Boundary = rep(c('Hep','Myo','Bcell'),each = 2),
                 CBS = rep(c('AllEnh', 'SE'), 3),
                 value = freq.df$ratio)
df$Boundary <- factor(df$Boundary, levels = c('Hep', 'Myo','Bcell'))
df$CBS <- factor(df$CBS, levels = c('AllEnh', 'SE'))
df$value <- as.numeric(as.character(df$value))

fontsize = 8
linesize = 0.35


g1 <- ggplot(df, aes(x = Boundary, y = value)) +
  geom_bar(aes(fill = CBS), stat = "identity", width = 0.5,position = "dodge") +
  theme_bw() +
  theme(panel.grid.major = element_blank(),panel.grid.minor = element_blank(),
        strip.background = element_blank(),panel.border = element_blank())+
  theme(text = element_text(size = fontsize), line = element_line(size = linesize),
        axis.ticks.length = unit(.1, "cm"), axis.ticks.x = element_blank(),
        axis.line = element_line(colour = "black", size = linesize)) +
  ylab('percentage of Enhancer with specific CBS')+
  xlab('Cell types')+
  geom_text(aes(label = round(value,2)), size = 2) +
  ggtitle(label = paste0('Fisher test Pvalue \n', p.ls[1],"\n ", p.ls[2], " \n",p.ls[3]))
#  coord_cartesian(ylim = c(0,10))

g1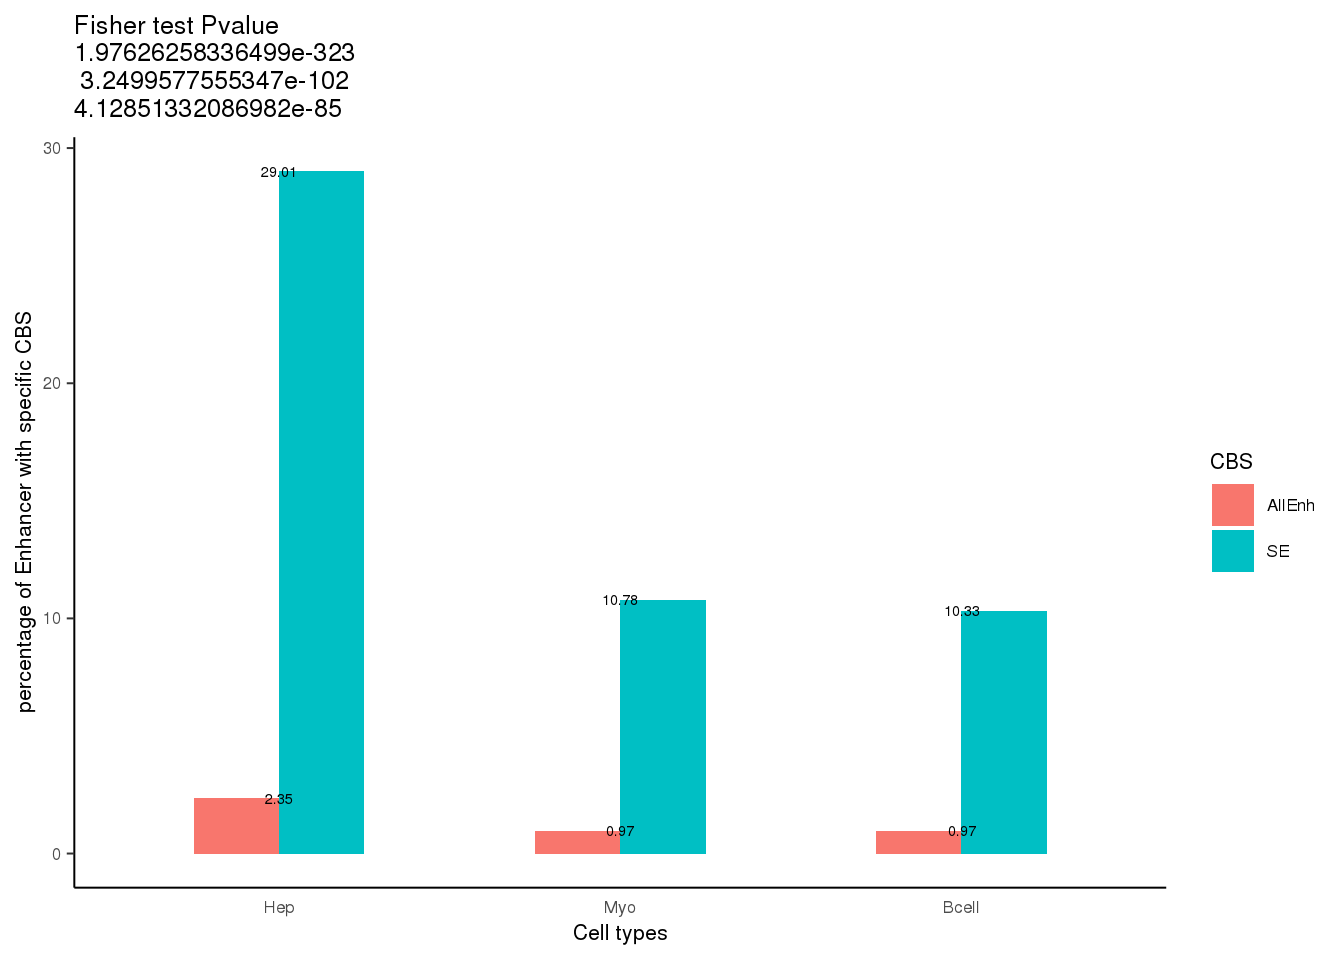
## Section: plot the percentage
##################################################

pdf('results/Features/N5-Human-enhancers-overlap-with-specificCBS_percentage_barplot.pdf',
    width = 3, height = 2.5)
g1
dev.off()