Chapter 17 Compare Loop Length Distribution
17.1 Description
Comapre loop length distributions for conserved-CBS-loops and specific-CBS-loops
17.2 Load loops
## Section: load data
##################################################
rm(list = ls())
file.ls <- list.files('data/HiC/loops/', pattern = "ANDS", full.names = T)


getLen <- function(f){
  loop <- fread(f)
  len <- abs(loop$y2 - loop$x2)
  len <- log10(len)
  return(len)
}

len.ls <- lapply(file.ls, getLen)


st = len.ls[[2]]
de = len.ls[[1]]
17.3 Culmulative plot
## Section: plots
##################################################
par(mar = rep(4,4),lwd=0.5)

plot(ecdf(st), verticals=TRUE, do.points=FALSE, col= 'azure3', xlim=c(4.3, 8.2),
     main="", xlab=expression(log[10]* '(bp distance)'),
     col.01line = NULL, cex.lab=2, ylab=expression(F[n]*'(x)')) #St-St St-Non
plot(ecdf(de), verticals=TRUE, col = 'green3', do.points=FALSE, add=TRUE, col.01line = NULL) #De-De  De-Non


legend("bottomright", c('St-St/Non', 'De-De/Non'),
       col=c('azure3', 'green3'),
       lty=rep(1,2), bty="n")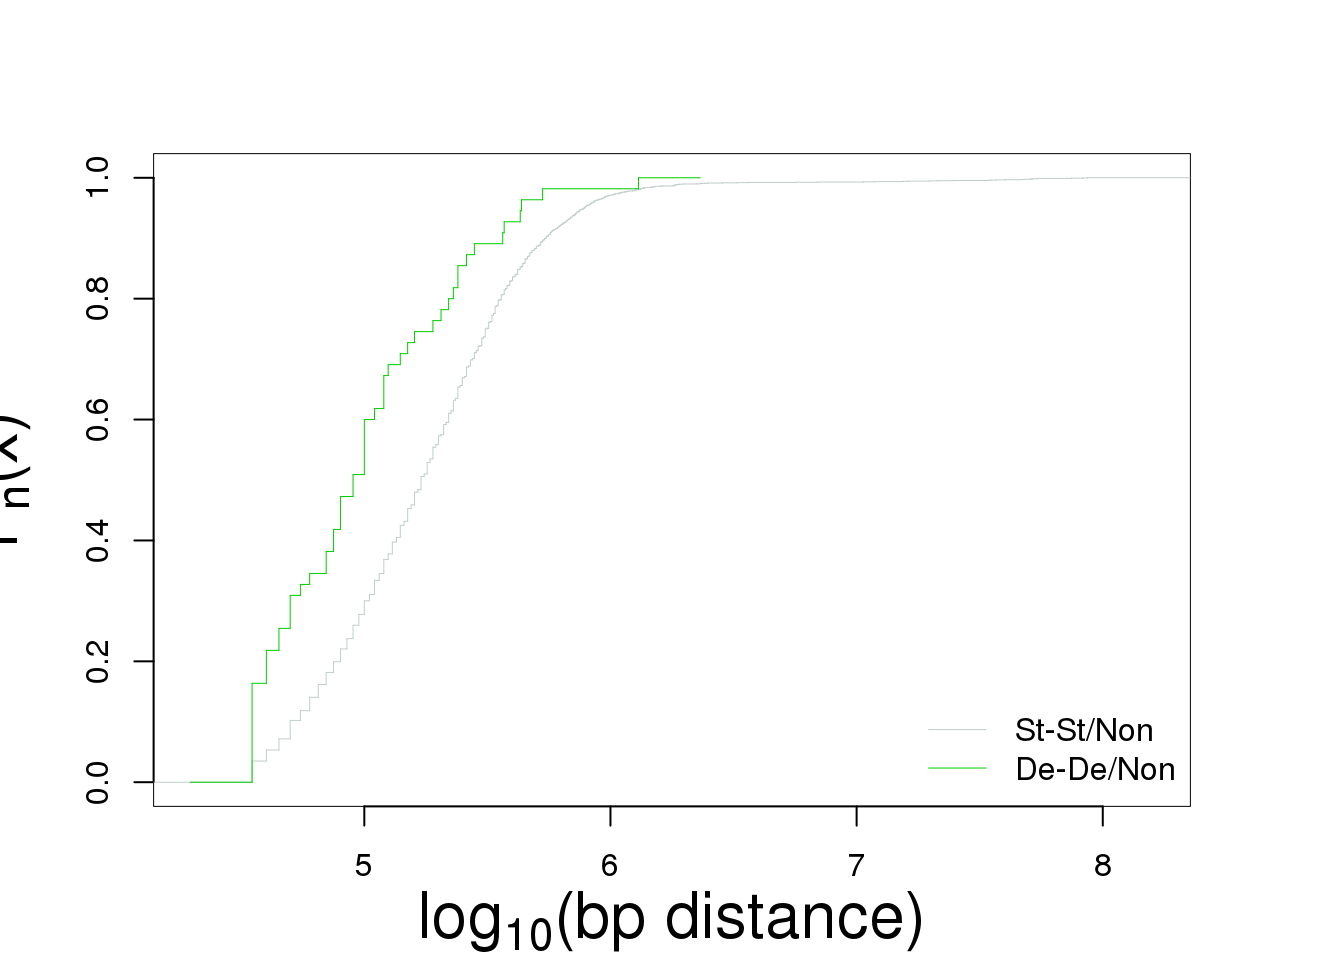
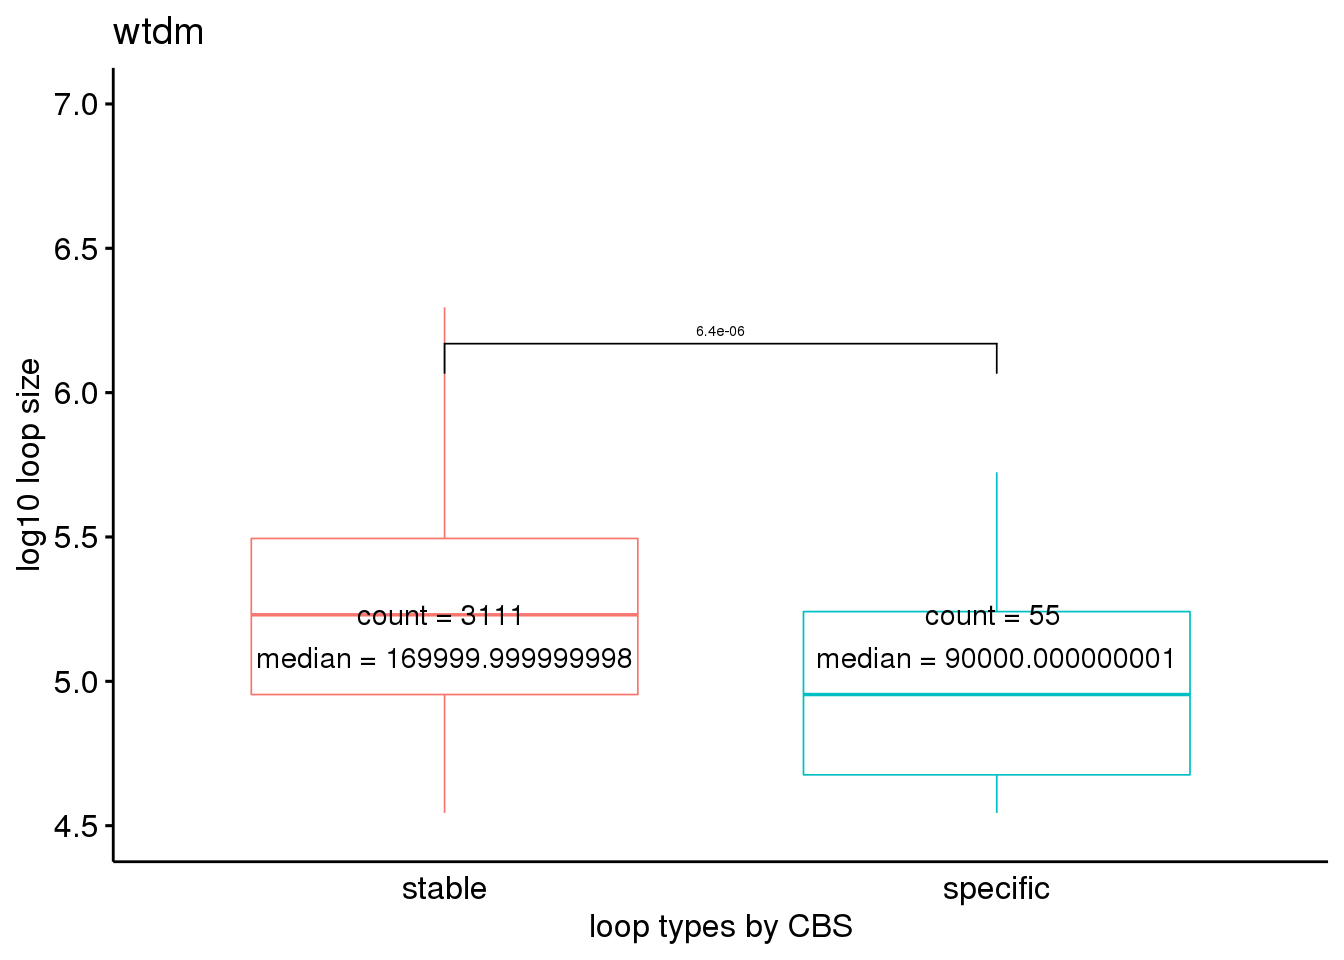
17.4 Box plot
## Section: boxplots
##################################################
## Section: generate the dataframe
##################################################
df <- data.frame(cbind('type' = c(rep('stable',length(st)), rep('specific', length(de))),
                       'value' = c(st, de)))
df$type <- factor(df$type, levels = c('stable', 'specific'))
df$value <- as.numeric(as.character(df$value))


## Section: seting plot parameters
##################################################
my_comparisons <- list(c('stable','specific'))
stat_box_data <- function(y, upper_limit = quantile(df$value, 0.50) ) {
  return(  data.frame( y = upper_limit,
                       label = paste('count =', length(y), '\n','median =', 10^median(y), '\n')))
}

fontsize = 4
linesize = 1

ggboxplot(df, x = "type", y = "value",
          color = 'type', size = .3, font.label = list(size = fontsize), outlier.shape = NA)+
  stat_summary(fun.data = stat_box_data, geom = "text", hjust = 0.5,vjust = 0.9)+
  theme(legend.position = "none", axis.ticks.x = element_blank())+
  stat_compare_means(comparisons = my_comparisons, label.y = c(6),method = 't.test', size = 2) +
  ylab('log10 loop size')+ xlab('loop types by CBS')+ ggtitle(label = "wtdm") +# labs
  coord_cartesian(ylim = c(4.5,7))