Chapter 10 diffBD genes expression
10.1 Description
check the expression levels for genes associated with lineage-specific CBS
10.2 Load expression mat
## Section: load expression table
##################################################
mat <- fread("~/lustrelyt/ChenQ/public/Human-Multitissue-CTCF/RNA-seq/Hep.Myo.Bcell_FPKM.table")
10.3 Load lineage-specific/conserved CBS
## Section: load peaks
##################################################
file.ls <-
  list.files('data/DiffBD/', full.names = T, pattern = "bed")
peaks <- list(
  stable = file.ls[5],
  liver = file.ls[2],
  muscle = file.ls[3],
  bcell = file.ls[1]
)
10.4 Annotate genes for CBS
## Section:  annotate genes by promoters
##################################################
txdb = TxDb.Hsapiens.UCSC.hg19.knownGene
gene.ls <- peaks %>% map( ~ {
  peak <- readPeakFile(.x)
  gene <-
    seq2gene(
      peak,
      tssRegion = c(-1000, 1000),
      flankDistance = 0,
      TxDb = txdb
    )

})
10.5 Extract submat
## Section: subset fpkm table based on genes
##################################################
submat.ls <- gene.ls %>% map( ~ {

  loci <- match(.x, mat$entrez)
  loci <- loci[which(!is.na(loci))]

  # subset fpkm table
  submat <- mat[loci, 2:4]

  # add gene symbol
  gid <- mat$symbol[loci]
  rownames(submat) <- make.names(gid, unique = TRUE)

  # log norm
  submat <- log2(submat + 1)
  #submat <- t(scale(t(submat)))
  return(submat)
})
10.6 Boxplot to explore the expression levels across cells
stat_box_data <- function(y, upper_limit = quantile(df$value, 0.50) ) {
  return(  data.frame( y = upper_limit,
                       label = paste('count =', length(y), '\n','mean =', round(mean(y), 3), '\n')))
}
my_comparisons <- list(c('hepatocyte', 'myocyte'), c('hepatocyte', 'Bcell'), c('myocyte', 'Bcell'))

gp.ls <- submat.ls %>% imap(~ {
  sample <- .y
  submat <- .x

  df <- melt(submat)
  colnames(df) <- c('type', 'value')
  df$type <- factor(df$type, levels = c('hepatocyte', 'myocyte',  'Bcell'))
  df$value <- as.numeric(as.character(df$value))

  fontsize = 10
  linesize = 1


  g <-  ggboxplot(df, x = "type", y = "value",
                  color = 'type', size = .3, font.label = list(size = fontsize), outlier.shape = NA)+
    ggtitle(sample) +
    ylab('log2 FPKM')+ xlab(paste0("genes n=", nrow(submat) ))+
    stat_summary(fun.data = stat_box_data, geom = "text", hjust = 0.5,vjust = 0.9)+
    theme(legend.position = "none", axis.ticks.x = element_blank())+
    stat_compare_means(comparisons = my_comparisons, label.y = c(6,7,8),method = 't.test', size = 2)+
    scale_color_manual(values = c("hepatocyte" = rgb(223, 97, 20, maxColorValue = 255),
                                  "myocyte" = rgb(66, 117, 224, maxColorValue = 255),
                                  "Bcell" = rgb(125, 0, 250, maxColorValue = 255)))

  return(g)

})

do.call(cowplot::plot_grid, c(list(ncol = 4), gp.ls))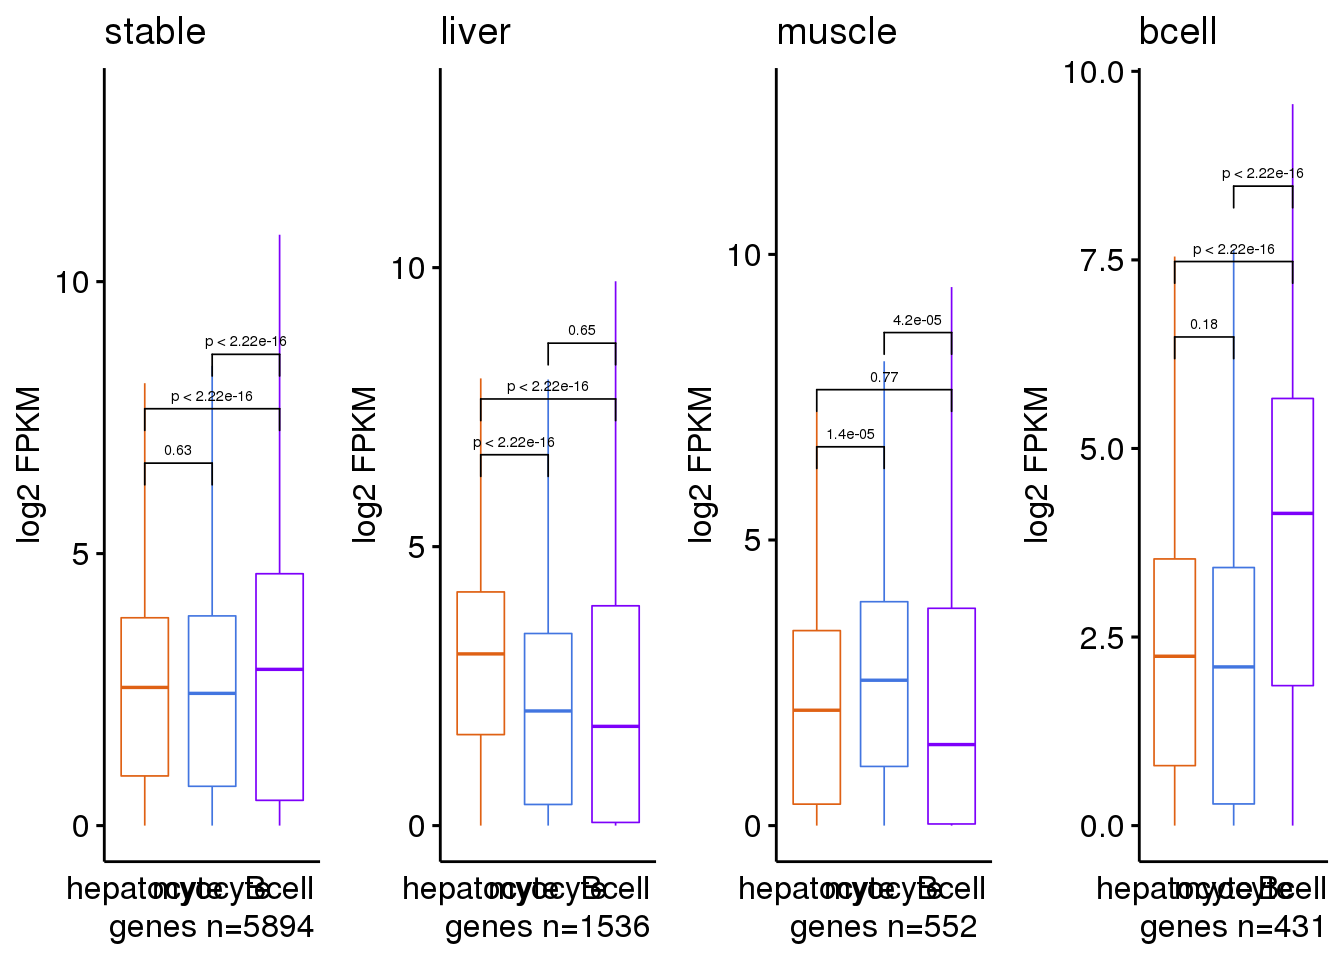
10.7 Save plots
pdf('results/Genes/N10-Hep.Myo.Bcell-specificCBS-AssociatedGenes-log2FPKM-fromENCODEData-boxplot.pdf',
    width = 2.5*4, height = 3.5)
do.call(cowplot::plot_grid, c(list(ncol = 4), gp.ls))
dev.off()