Chapter 1 Introduction
1.2 Method description
The CMDdemux workflow includes three major steps: (1) within-cell centered log-ratio (CLR) normalization, (2) K-medoids clustering, and (3) Mahalanobis distance (MD)-based classification.
Step 1: Within-cell CLR normalization
This step is also referred to as local CLR normalization. First, hashtag counts of each cell are normalized by their library size. Then, the geometric mean of these normalized counts is calculated. Next, each normalized count is divided by the geometric mean and log-transformed to obtain the final CLR-normalized values.
Step 2: K-medoids clustering
K-medoids clustering is performed in the local CLR space. In most cases, the number of clusters (k) equals the number of hashtags, although additional clusters may occasionally be required. Core and non-core cells are defined based on their Euclidean distance to the cluster centroid: core cells have distances smaller than a defined threshold, while non-core cells have larger distances. Defining core and non-core cells prevents non-core cells from biasing the estimation of cluster-based covariance. Each cluster is then assigned to its corresponding hashtag.
Step 3: Mahalanobis distance-based classification
The hashtag-hashtag covariance matrix is calculated using only core cells. The Mahalanobis distance (MD) is then computed using the CLR-normalized values (from Step 1), the cluster centroids (from Step 2), and the covariance matrix. In the initial demultiplexing step, outlier cells are identified based on a threshold derived from the MD distribution. Non-outlier cells are classified as singlets and assigned to the hashtag with the minimum MD value. Outlier cells are further distinguished as negatives or doublets based on their hashtag library sizes.
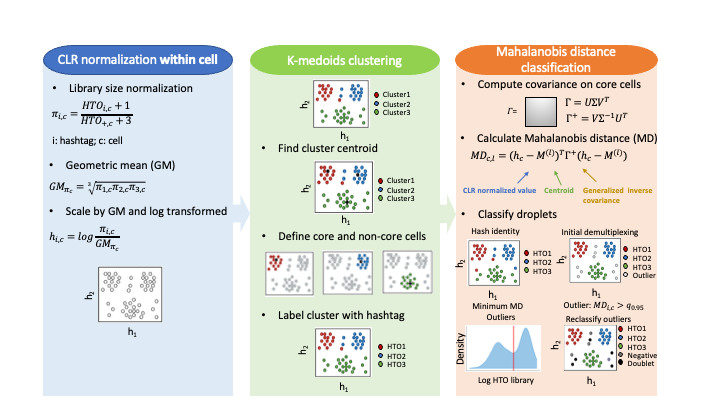
Figure 1.1: Schematic workflow of CMDdemux.
1.3 Hashing data types
Cell hashing experiments can sometimes produce low-quality data. For high-quality data, we expect each cell to be predominantly labelled by one hashtag, and the distributions of all hashtags to be similar to each other — typically showing a peak at larger values corresponding to true signals and a smaller peak representing background noise. Uneven labelling is a common feature of low-quality cell hashing data. This type of data can be divided into weak-signal and strong-signal cases: cells may either be insufficiently labelled by hashtags (weak signals) or excessively labelled (over-strong signals). In such cases, the affected hashtags exhibit skewed distributions compared to other standard hashtags. Contamination occurs when cells are attached to multiple hashtags, resulting in intermediate signal levels for several hashtags. This typically produces a secondary peak between the true-signal and noise peaks, referred to as contamination signals. Empty droplets are not inherently low-quality data; however, if their number is large, they can distort the expected number of cell clusters in the dataset, and thus are often considered low-quality in practice. Low-input is another type of low-quality data, where cells are bound by only a limited amount of hashtag and show generally low expression levels. In this document, we aim to demonstrate how to use CMDdemux to demultiplex both high- and low-quality datasets.
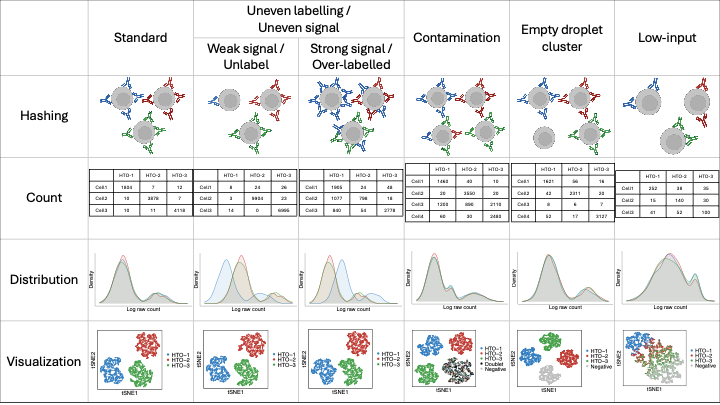
Figure 1.2: A summary of hashing data type.
1.4 Example data
| Data | Quality | Number of hashtags | Number of cells | Technology | Tissue/Cell type | Gene expression data | Low quality type | Publication | Data source |
|---|---|---|---|---|---|---|---|---|---|
| Human brain | High-quality | 8 | 2754 | Single nucleus hashing | Human brain cortex | ✓ | NA | (Gaublomme et al. 2019) | https://hub.docker.com/r/regevlab/demuxem |
| BAL | 8 | 24804 | TotalSeq antibodies | Paediatric bronchoalveolar lavage fluid | ✗ | (Howitt et al. 2023) | https://zenodo.org/records/8304003 | ||
| Vehicle mouse | 3 | 7403 | TotalSeq antibodies | Vehicle treated mouse immune cells | ✓ | (Virassamy et al. 2023) | https://zenodo.org/records/7325111 | ||
| Treated mouse | Low-quality | 3 | 4436 | TotalSeq antibodies | Ipatasertib treated mouse immune cells | ✗ (Available upon requests) | Uneven labelling with weak signals | https://zenodo.org/records/16976382 | |
| OT | 4 | 9405 | TotalSeq antibodies | Ovarian carcinoma | ✓ | Uneven labelling with strong signals | (Hippen et al. 2023) | GSE217517 | |
| EMBRYO MULTI-Seq LMO | 12 | 9745 | MULTI-Seq lipid modified oligo (LMO) | Mouse E18.5 brain | ✓ | Uneven labelling with unlabelled hash | (Brown et al. 2024) | https://zenodo.org/records/11134439 | |
| EMBRYO MULTI-Seq CMO | 12 | 19494 | Custom MULTI-Seq cholesterol modified oligo (CMO) | ✓ | Contamination | ||||
| PDX CellPlex | 4 | 4327 | CellPlex | Nuclei from human ovarian carcinosarcoma patient-derived xenograft (PDX) | ✓ | Uneven labelling with strong signals / Low input | |||
| PDX Hashtag Ab | 4 | 7071 | TotalSeq antibodies | ✓ | Low-input | ||||
| PDX MULTI-Seq CMO | 4 | 4178 | Custom MULTI-Seq CMO | ✓ | Uneven labelling with strong signals / Low input | ||||
| PBMC | 8 | 21522 | Antibodies | Peripheral blood mononuclear cells (PBMC) | ✓ | Empty droplets | (Stoeckius et al. 2018) | GSE108313 |