13.11 轨迹图
rasterly 百万量级的散点图
library(rasterly)
plot_ly(quakes, x = ~long, y = ~lat) %>%
  add_rasterly_heatmap()

quakes %>%
  rasterly(mapping = aes(x = long, y = lat)) %>%
rasterly_points()library(plotly)
# 读取数据
# uber 轨迹数据来自 https://github.com/plotly/rasterly
ridesDf <- readRDS(file = 'data/uber.rds')
ridesDf %>%
rasterly(mapping = aes(x = Lat, y = Lon)) %>%
rasterly_points()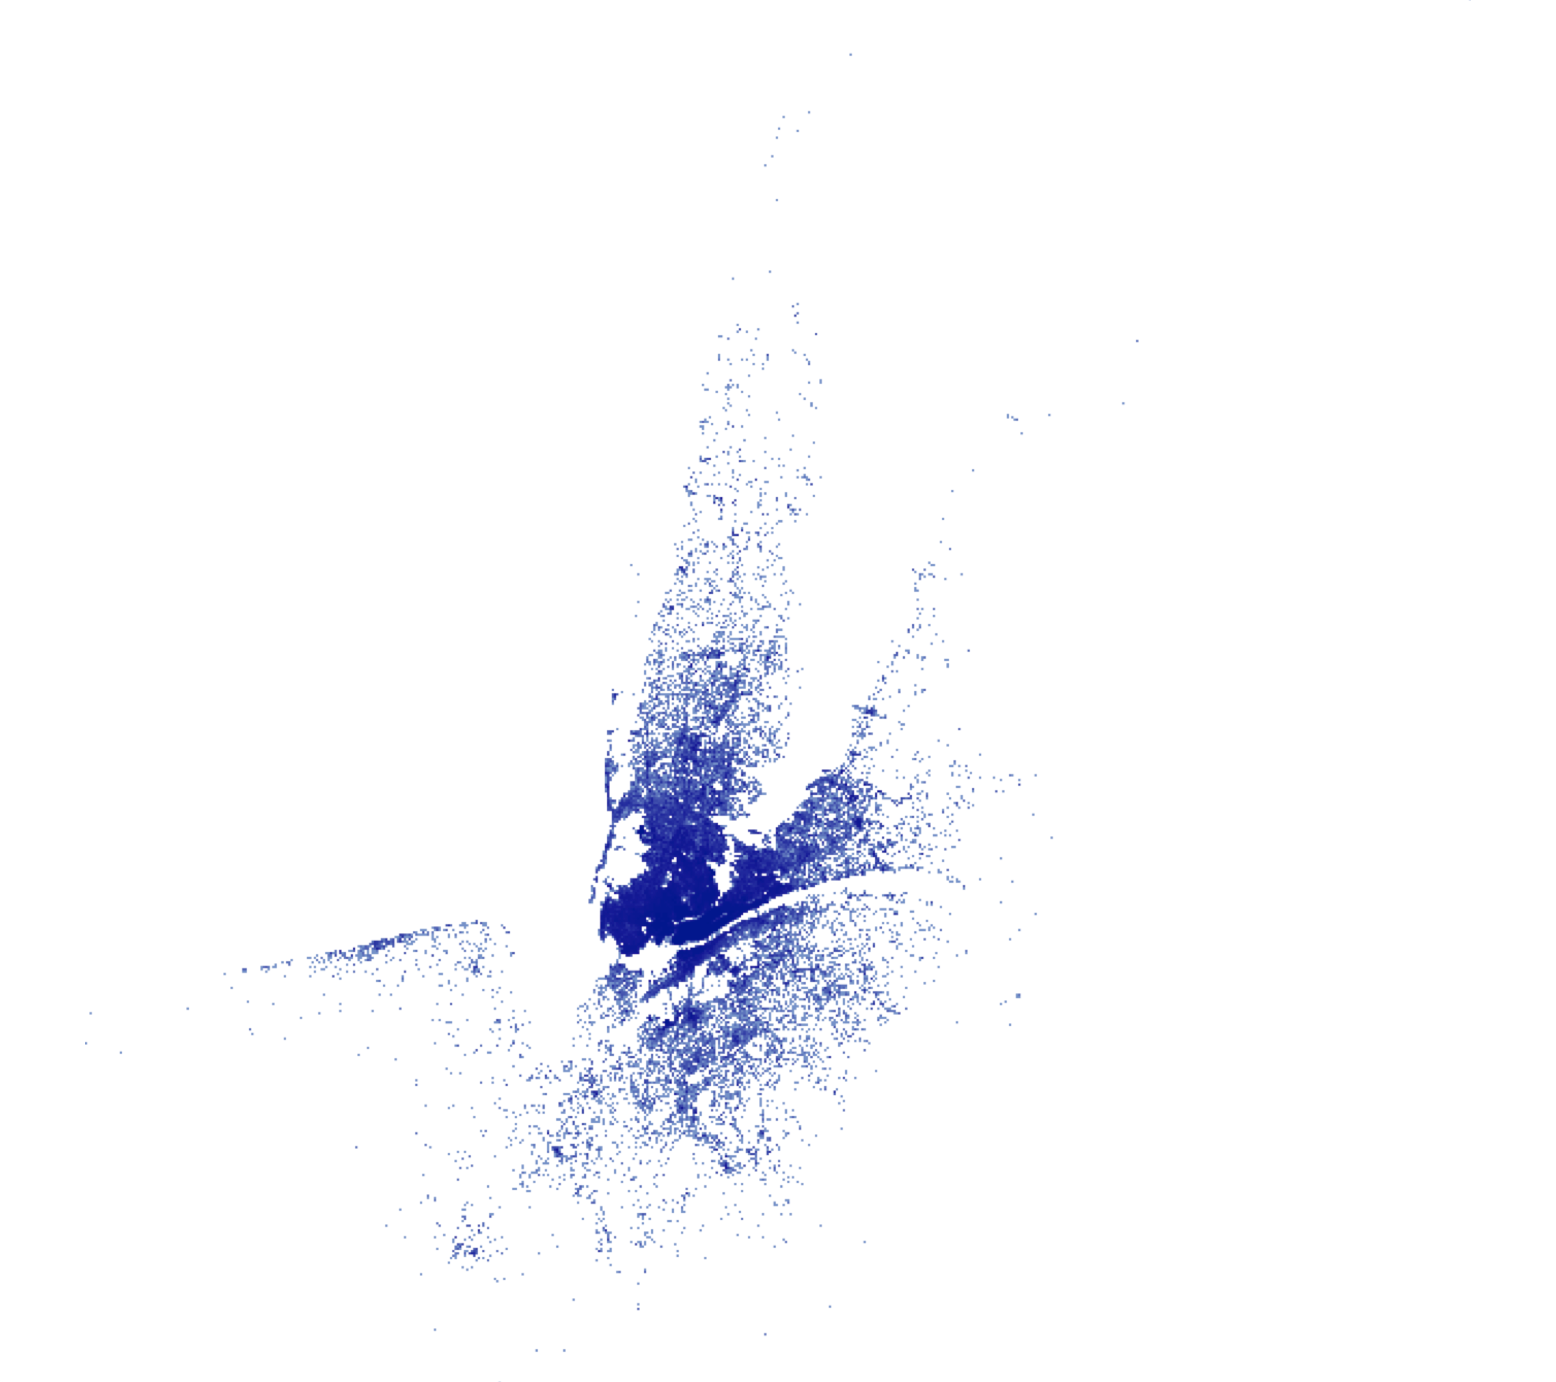
图 13.9: 轨迹数据