12.25 水流图
常用于时间序列数据展示的堆积区域图,ggstream 和 streamgraph
library(ggstream)

ggplot(blockbusters, aes(year, box_office, fill = genre)) +
  geom_stream() +
  theme_minimal()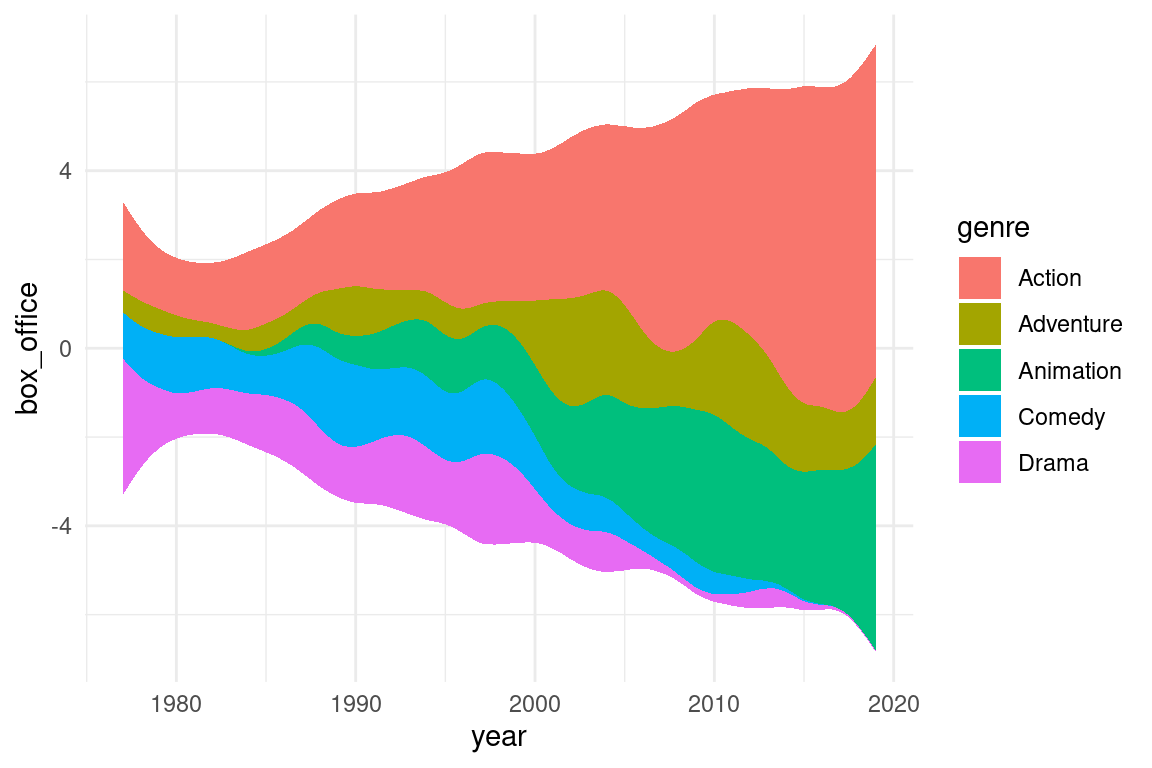
图 12.66: 堆积区域图
常用于时间序列数据展示的堆积区域图,ggstream 和 streamgraph
library(ggstream)
ggplot(blockbusters, aes(year, box_office, fill = genre)) +
geom_stream() +
theme_minimal()图 12.66: 堆积区域图