12.19 包络图
ggpubr 包提供了 stat_chull() 图层
library(ggpubr)
ggscatter(mpg, x = "displ", y = "hwy", color = "drv")+
 stat_chull(aes(color = drv, fill = drv), alpha = 0.1, geom = "polygon")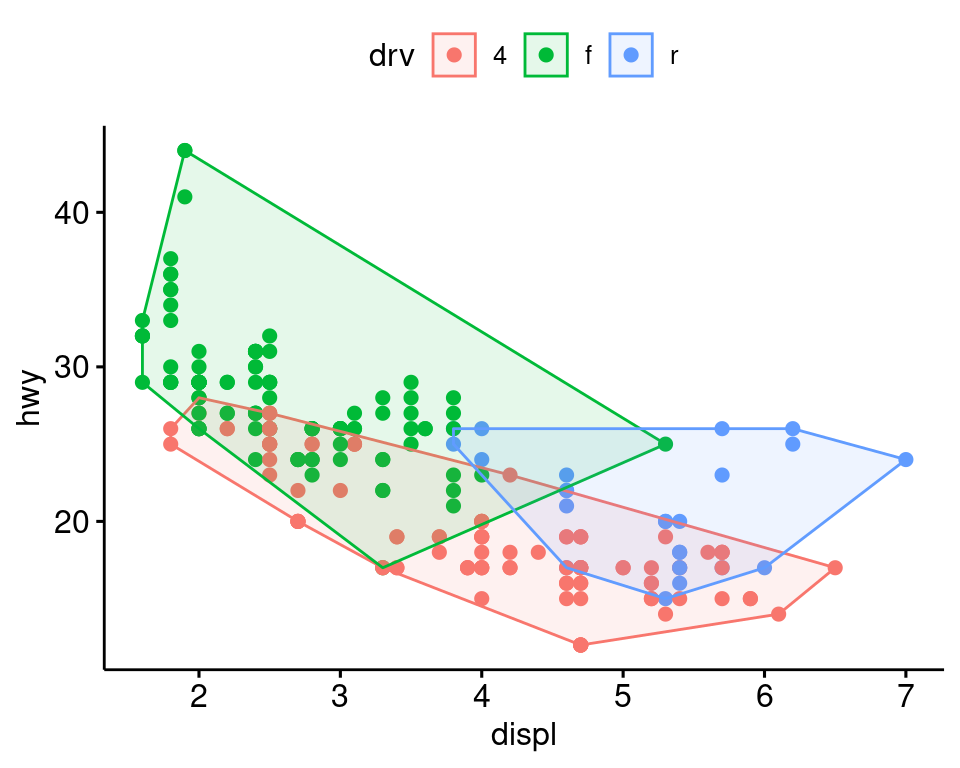
图 12.59: 包络图
其背后的原理如下
stat_chull## function (mapping = NULL, data = NULL, geom = "path", position = "identity",
## na.rm = FALSE, show.legend = NA, inherit.aes = TRUE, ...)
## {
## layer(stat = StatChull, data = data, mapping = mapping, geom = geom,
## position = position, show.legend = show.legend, inherit.aes = inherit.aes,
## params = list(na.rm = na.rm, ...))
## }
## <bytecode: 0x563de265dba0>
## <environment: namespace:ggpubr>StatChull <- ggproto("StatChull", Stat,
compute_group = function(data, scales) {
data[chull(data$x, data$y), , drop = FALSE]
},
required_aes = c("x", "y")
)
stat_chull <- function(mapping = NULL, data = NULL, geom = "polygon",
position = "identity", na.rm = FALSE, show.legend = NA,
inherit.aes = TRUE, ...) {
layer(
stat = StatChull, data = data, mapping = mapping, geom = geom,
position = position, show.legend = show.legend, inherit.aes = inherit.aes,
params = list(na.rm = na.rm, ...)
)
}
ggplot(mpg, aes(displ, hwy)) +
geom_point() +
stat_chull(fill = NA, colour = "black")
ggplot(mpg, aes(displ, hwy, colour = drv)) +
geom_point() +
stat_chull(fill = NA)