2.12 Di-Graphs
The di-graph captures a network where, rather than ties occuring between nodes at the same level of analysis (i.e. people connected with people), ties occur between nodes at different levels of analysis. For example, people work at companies, so we might say that a worker is connected with the company, rather than any specific individual there. People also connect to sports teams, schools, relgious communities, and other organizations which can have an influence in structuring their social world.
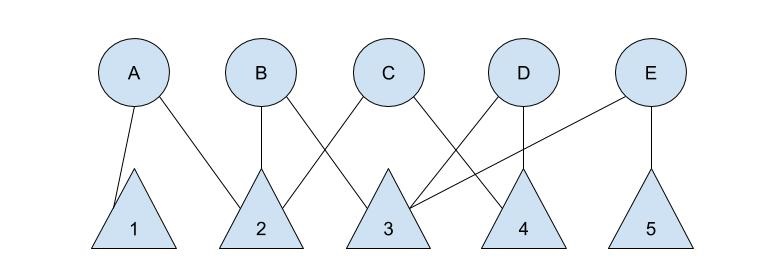
Figure 1.7 represents an example of a di-graph where cirlces connect to triangles. One common example in sociology is company board interlock networks. In this case, we could think of the circles as board members who run companies, and the triangles are the companies they work for. Thus, board member A is on the board of both company 1 and 2, while board member B is on the board of company 2 and 3.
Figure 0.12: A Di-Graph

Figure 1.7
While this information alone may be useful, you might realize that board members A and B both are on the boards of company 2! In fact, board member C is also on the board of company 2! We might thus conclude that board members A, B, and C all know each other from working together.
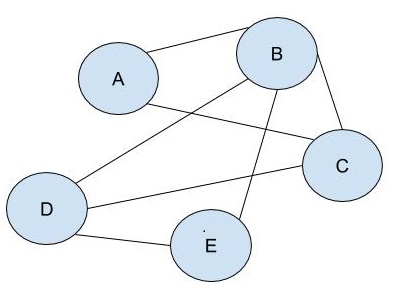
If this sort of information was important, we could convert the di-graph into a graph capturing connections between the same level of analysis. Thus, we could, as shown in Figure 1.8, create a graph that shows board members who know each other because they work at the same company. In the resulting graph, it clearly shows that board members A, B, and C all know each other as a result of working at company 2 together.
Figure 0.13: An Incidence Graph for Circles

Figure 1.8
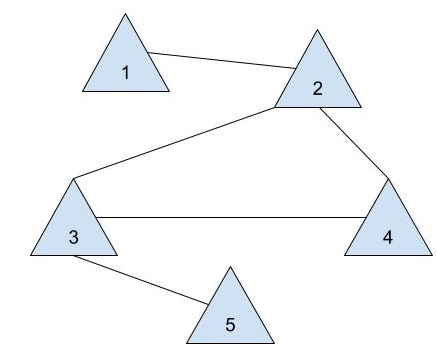
Likewise, we can transform the di-graph into a graph that captures companies that share board members. Comapny 2 is thus connected to Companies 1 (because of person A), 3 (because of person B), and 4 (because of person 5).
Figure 0.14: An Incidence Graph for Triangles

Famous Network Studies: Mizruchi 1989
Mizruchi, Mark S. 1989. “Similarity of Political Behavior Among Large American Corporations.” \(American\) \(Journal\) \(of\) \(Sociology\) 95 (2): 427-436.