4.1 Introducing exploratory data analysis
Exploratory data analysis (EDA) aims to describe the main characteristics of a data set often using visual techniques. Wikipedia defines it as “an approach to analyzing data sets to summarise their main characteristics, often with visual methods”.
It is an iterative process typically:
1. Eyeball the data and look for patterns
2. Generate questions
3. Search for answers by visualising, transforming, and modelling
4. Repeat
(Grolemund and Wickham 2018)
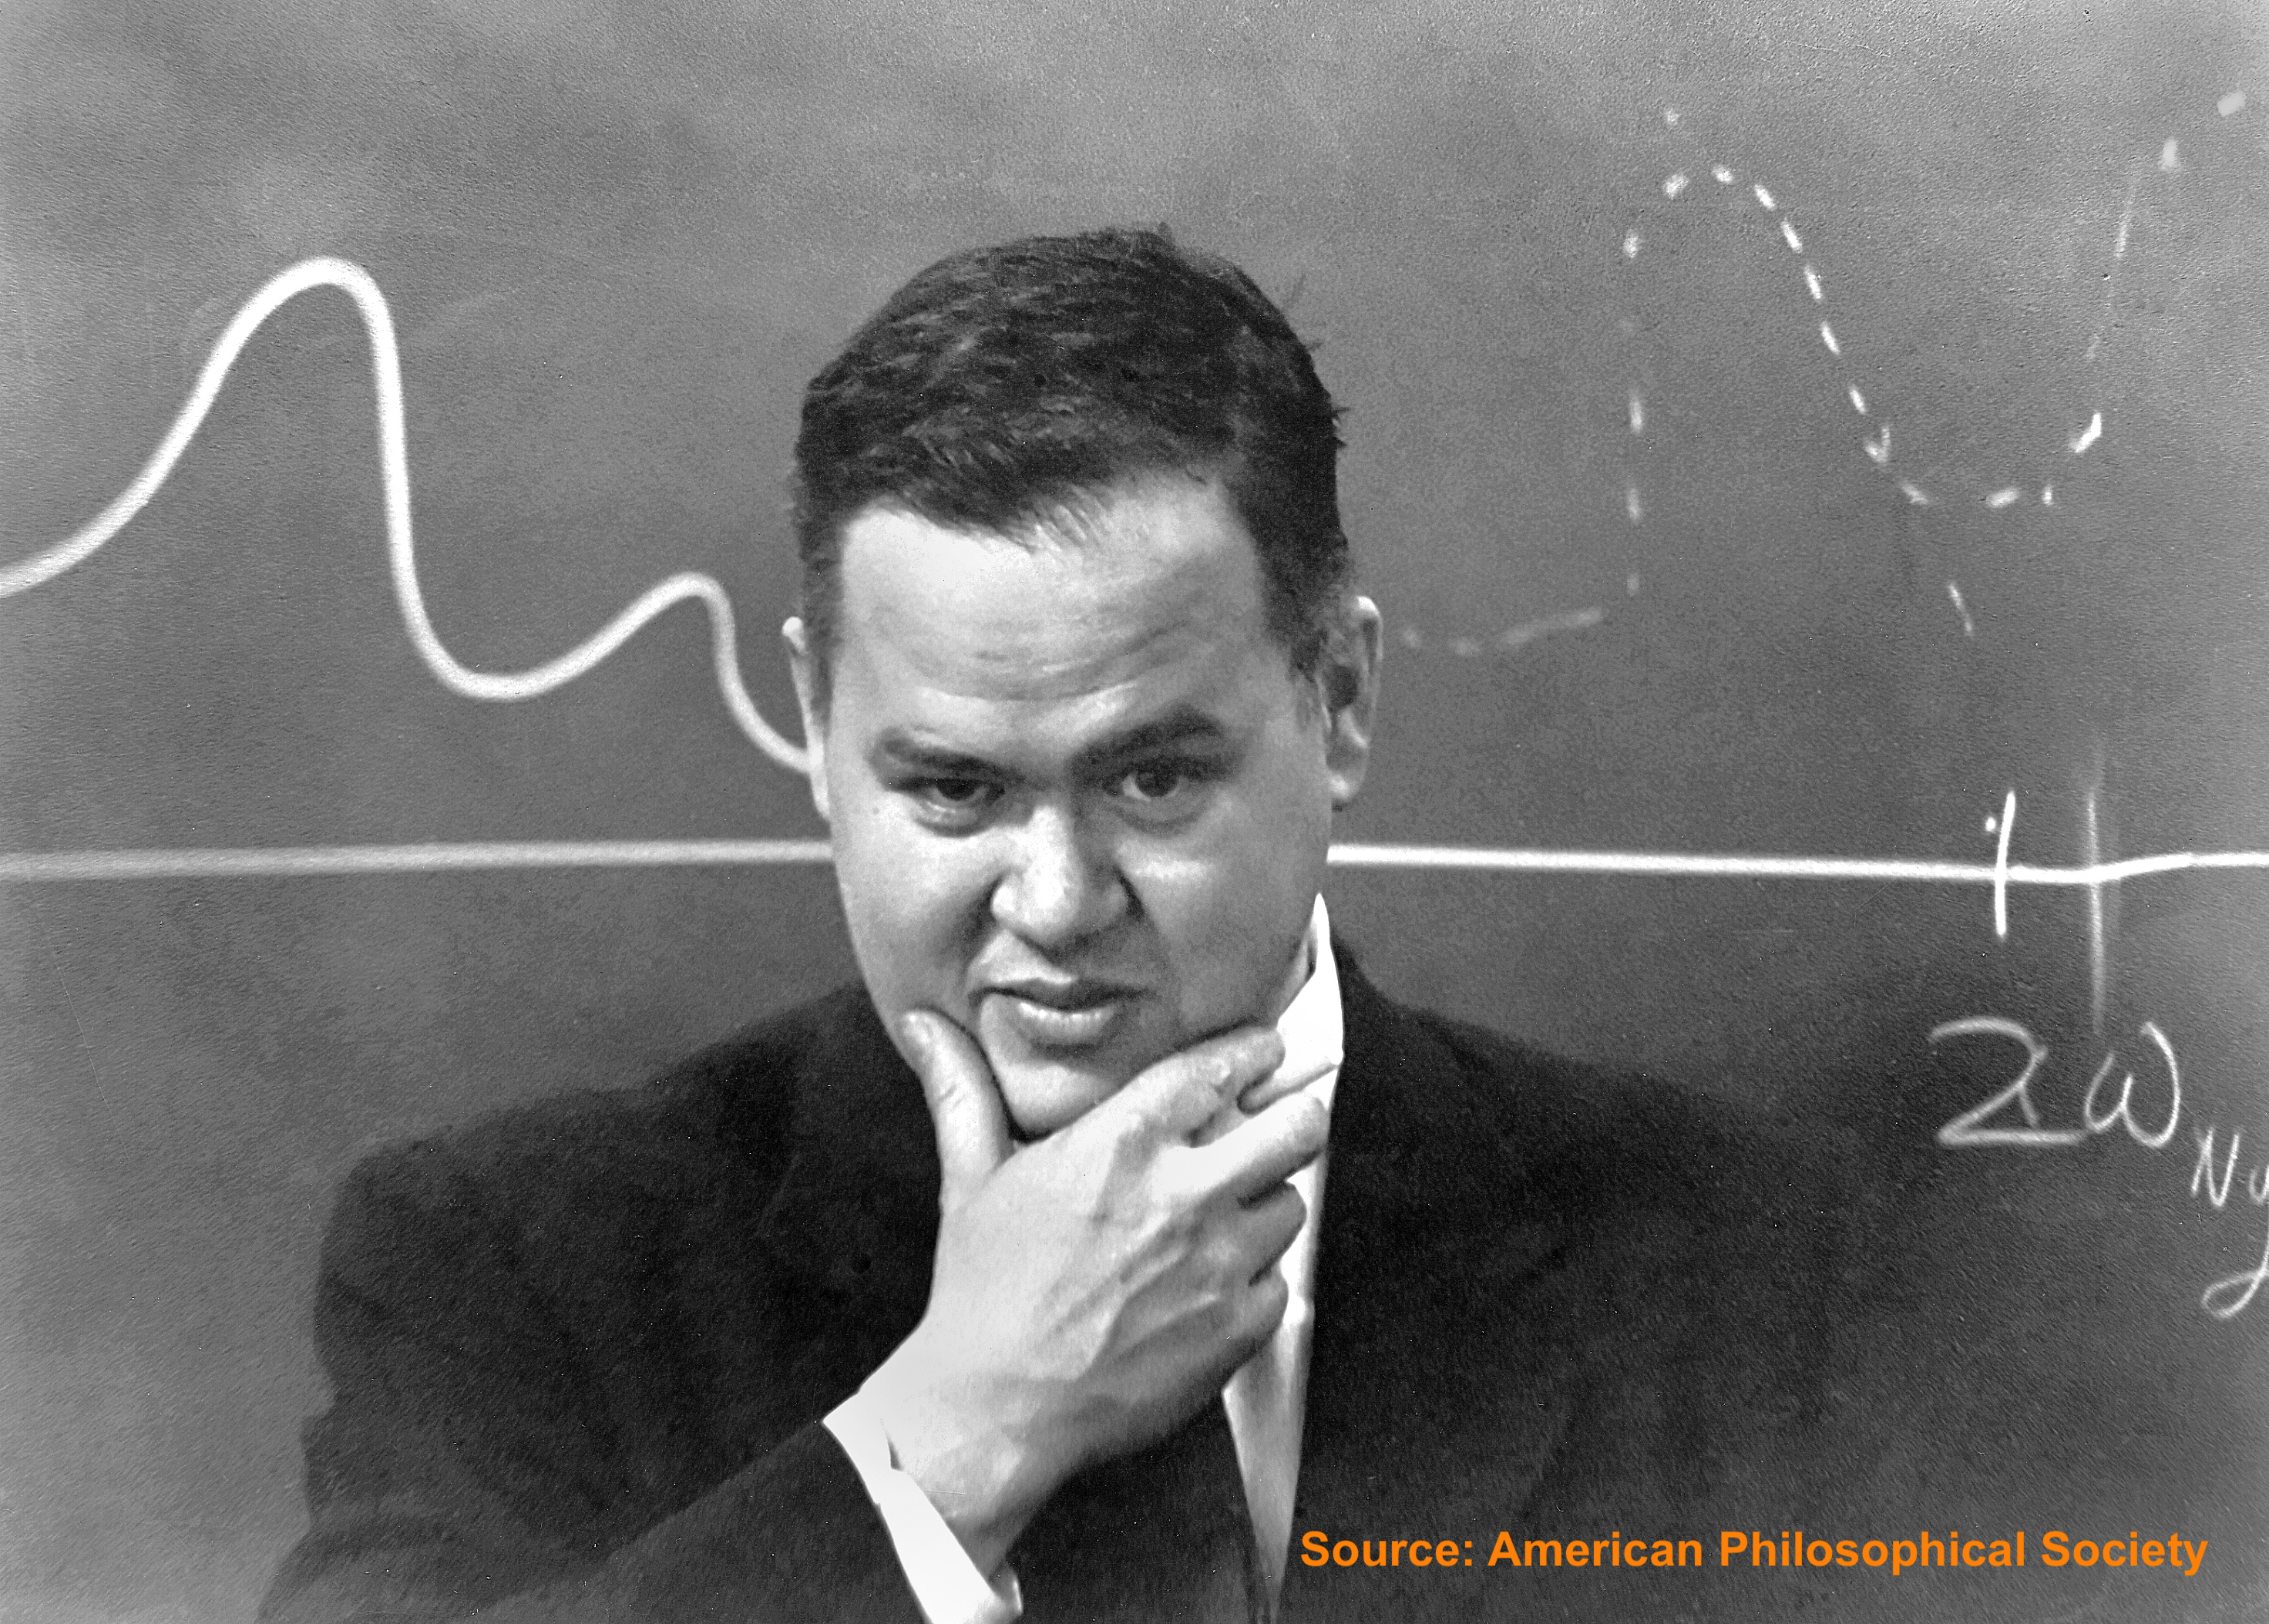
John Tukey (1915-2000) is the statistician largely credited with developing and promoting Exploratory Data Analysis, along with a bunch of other stuff! As the name suggests, it’s about exploring data, i.e., hypothesis generation rather than hypothesis confirmation (sometimes called confirmatory analysis typically using inferential statistics such as ANOVA and t-tests).

With the availability of interactive data analysis tools, such as RStudio, EDA is seen as a key part of the data analysis process. It also helps address problems of data complexity and difficulties in knowing what are the important questions to be answered. Note that these may be different from, or a superset of, the questions identified by the relevant stakeholders.
Remember by its very nature EDA, will not be a well-defined process. Nevertheless, it should be systematic.
4.1.1 Data questions
Far better an approximate answer to the right question, which is often vague, than an exact answer to the wrong question, which can always be made precise. -— John Tukey
There is, unsurprisingly, no rule about which questions you should ask but, these questions might be helpful:
- What data types am I dealing with?
- What is a typical value?
- What uncertainty surrounds this estimate of typicality?
- What type of variation occurs within my variables?
- Does the data set contain outliers?
- What type of covariation occurs between my variables?
- More specifically, if there are any factors, do they have an effect?
A longer list of analysis questions can be found from the NIST Engineering Statistics Handbook. Of course many questions will be domain specific, supplied by the client or stakeholder or discovered through the EDA process itself.
Why are questions so important for the data analyst? For more information on exploratory data analysis see Chapter 4 of (Peng and Matsui 2015) or Chapter 7 from (Grolemund and Wickham 2018).
4.1.2 Spotting data quality problems
you always need to investigate the quality of your data
– (Grolemund and Wickham 2018)
One purpose of EDA is to help you spot data quality problems. Although there is no recipe, getting a ‘feel’ for the data or ‘eyeballing’ it can be very powerful. This early encounter can help you spot anomalies and potential problems plus improve your understanding. Obviously the earlier data quality can be checked and the data cleaned, the fewer the opportunities for wasted effort and misleading analyses.
The next chapter reviews data quality checking, cleaning and imputation in detail but I want to flag up in advance that this is a key benefit of EDA.